
Source: Wall Street Insights
Wall Street has shown significant divergence after a sharp drop in US technology stocks. Bank of America issued a warning, stating that there are "too many danger signals" in the market, recommending investors to lock in profits; meanwhile, Morgan Stanley and Citigroup maintain a bullish stance, suggesting buying on the dip.
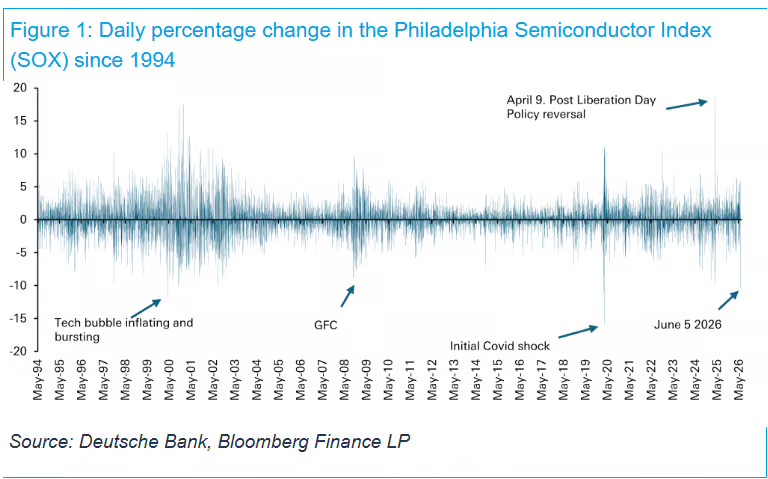
Last Friday, the Philadelphia Semiconductor Index plummeted over 10% in a single day, marking the largest single-day drop since March 2020 and the fourth largest single-day drop since data began in 1994. Strong US employment data boosted bond yields, increasing market bets on the Federal Reserve's next move being a rate hike, further dampening risk sentiment. (Related reading: Seeking Alpha hot article: Why US stocks might crash in June?)
Savita Subramanian, head of quantitative strategy at Bank of America, subsequently released a report stating that "too many danger signals have triggered," maintaining a year-end target for the S&P 500 at 7100 points, implying about 6% downside from last Friday's closing price.
Despite this, Morgan Stanley strategist Mike Wilson still insists that the S&P 500 will reach 8000 points by year-end, while Citigroup strategist Scott Chronert's team raised their year-end target from 7700 points to 8100 points. Both institutions cite strong corporate earnings growth and robust macro data as key arguments.
The two completely opposing judgments have left investors facing a directional choice after the sell-off in tech stocks: whether to take advantage of the dip or lock in profits before market volatility intensifies.
Bank of America: Bear market signals trigger 70%, reaching historical peak levels
The core basis of Bank of America's warning is its quantitative signal system tracking bear market precursors. According to Subramanian's report, among the ten indicators monitored by the bank, seven have now triggered—two were triggered in May, five in April, and four in March—resulting in a triggering ratio of 70%, which is about the average level before the S&P 500 market tops since 1990.
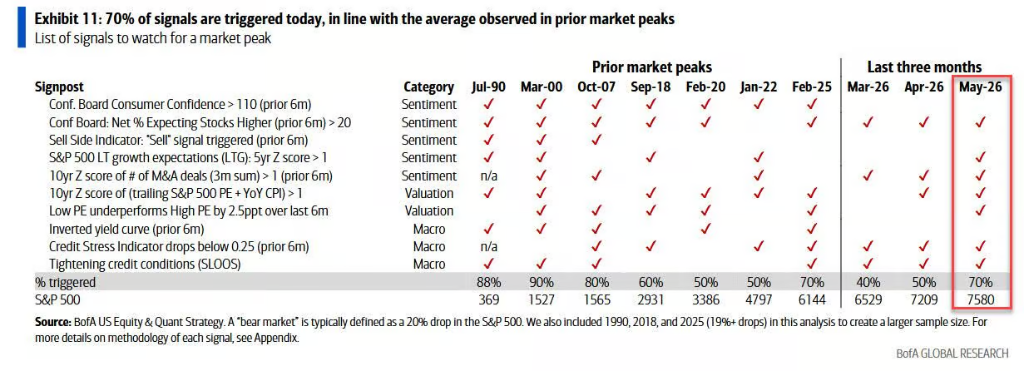
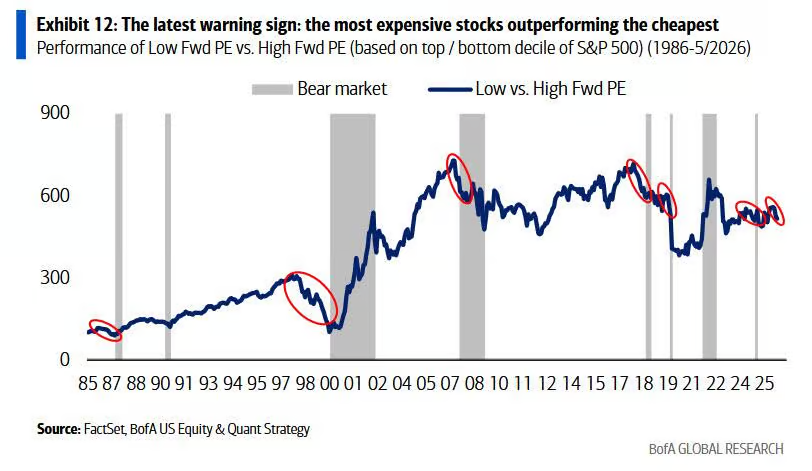
Two of the latest triggered signals are particularly noteworthy: first, high PE stocks significantly outperformed low PE stocks, seen as a typical sign of excessive speculation in the market; second, long-term growth expectations are excessively high, and valuation levels have reached a zone where stocks are sensitive to performance disappointments.
The Bank of America sentiment model's "sell signal" has not officially triggered, but there has been a noticeable deterioration in May, with market sentiment continuing to trend towards extreme optimism. Meanwhile, the yield curve has not inverted, but the spread between 2-year and 10-year US Treasury yields has compressed to 39 basis points, the lowest level since the introduction of countervailing tariffs.
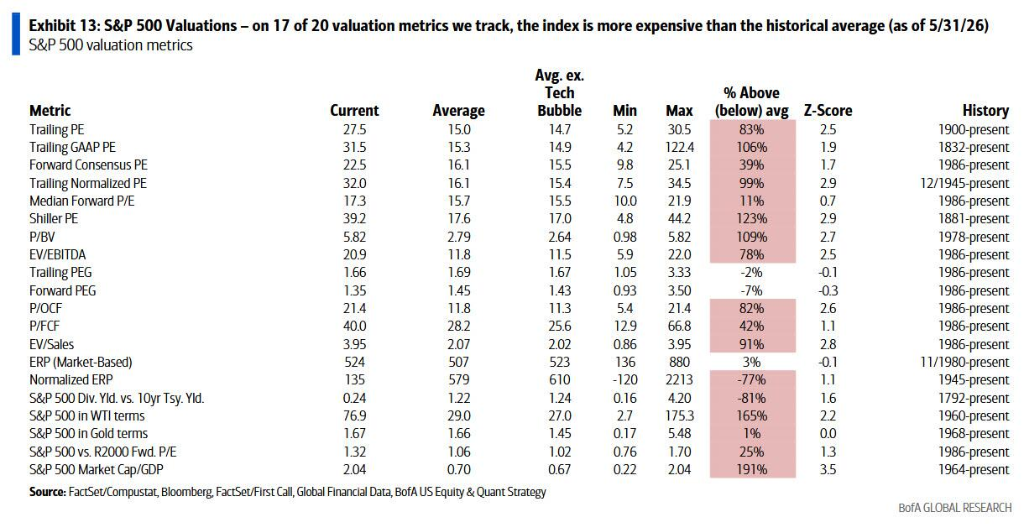
The report also indicates that from a valuation perspective, 17 out of 20 metrics tracked by Bank of America show that the S&P 500 is above historical averages, also indicating a high risk of overvaluation overall.
Technology sector resembles the peak of the internet bubble in February 2000
The most striking assertion in Bank of America's warning is the direct comparison of the current technology sector's trajectory to February 2000—about a month before the peak of the internet bubble.
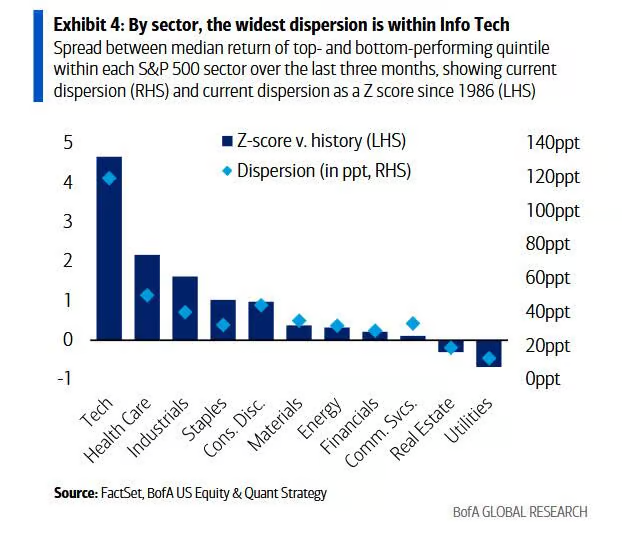
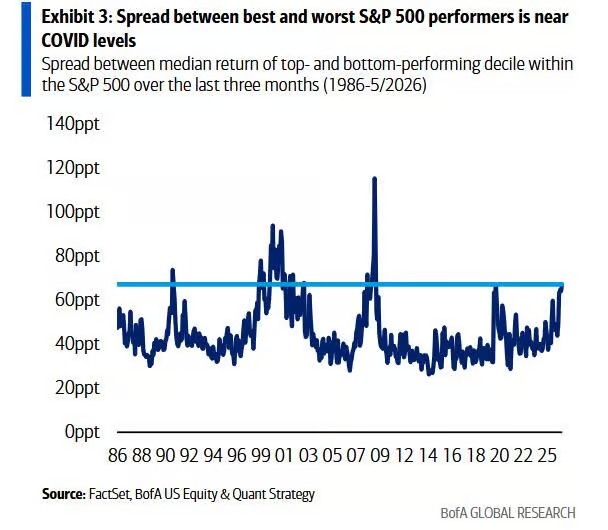
The most critical indicator cited in the report is the degree of differentiation within the sector: the median return gap between the best and worst-performing quintile stocks in the tech sector has now reached around 120 percentage points, the highest level since February 2000—at that time, this indicator peaked at about 130 percentage points on March 24, 2000, just before the market top.
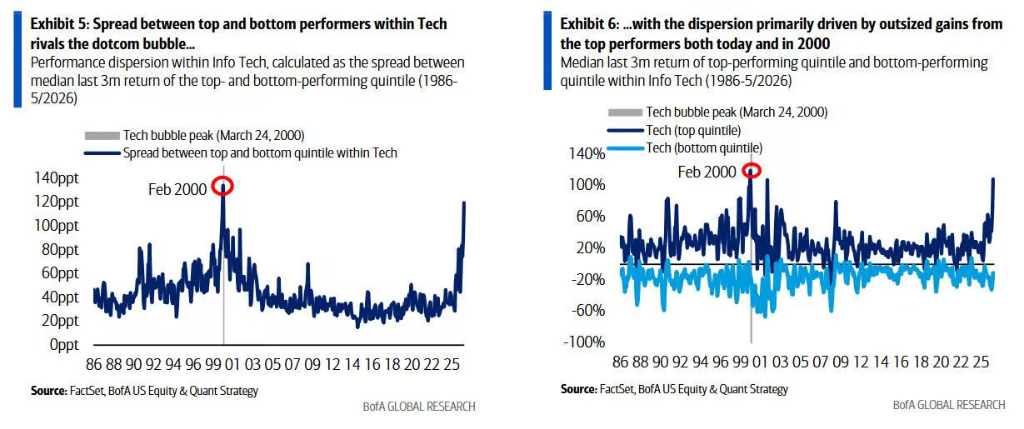
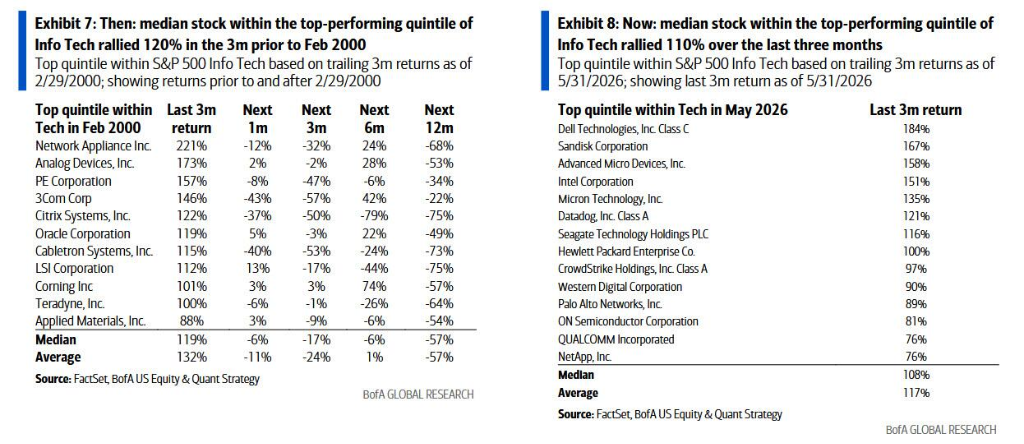
In terms of stock price increases, within the current best-performing quintile of the tech sector, the median stock has risen approximately 110% over the past three months; during the internet bubble period, similar stocks reached a maximum rise of about 120% before the bubble burst.
Bank of America summarizes that the current situation bears three highly similar characteristics to February 2000:
The energy sector ranks first in Bank of America's tactical sector model, possessing a triple advantage of momentum, earnings revision, and valuation; information technology and communication services tie for second, showing strong momentum and earnings revisions but high valuations; consumer staples rank last, mirroring February 2000—this sector proved most resilient after the tech bubble burst, outperforming the index by 73 percentage points during the period from March 2000 to October 2002 when the S&P 500 hit bottom.
Morgan Stanley and Citigroup maintain bullishness: breadth of earnings revision reaches cyclical high
In response to the same market fluctuations, Mike Wilson of Morgan Stanley reached a completely different conclusion. In a report released on Monday, he indicated that the rapid rise of the S&P 500 since the March low was difficult to sustain, and this adjustment is "inevitable and ultimately beneficial for the continuation of the bull market until year-end."
Wilson attributes the bullish core basis to the breadth of earnings revisions: the breadth of earnings revisions for the S&P 500 has now reached 26%, setting a new cycle high.
At the macro level, the ISM Manufacturing PMI rose to 54 last week, the highest since 2022; private sector wage growth’s three-month average improved to 166,000, the strongest since 2023. He believes that after normalizing the crowded semiconductor and storage stock positions, cyclical sectors like consumer discretionary, transportation, and regional banks are expected to take the lead in performance.
Scott Chronert from Citigroup also raised the year-end target for the S&P 500 from 7700 points to 8100 points, citing "a significant leap in earnings expectations," implying a 9.7% upside from last Friday's closing price.
Bank of America acknowledges that technology fundamentals are stronger than during the internet bubble era, but a deterioration trend has emerged
Bank of America does not entirely dismiss the current technology sector fundamentals. The report points out that on several metrics such as leverage, valuation, and capital intensity, the health of the current technology sector is better than during the internet bubble period.
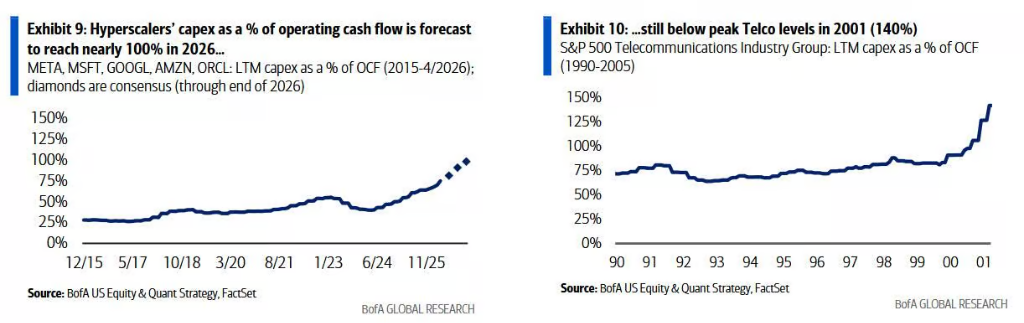
However, the report also documents several signs of deterioration that have emerged since the beginning of the year: cash flow conversion rates have stabilized, supply of investment-grade bonds and stocks has increased, and the proportion of buybacks relative to market value has slowed; the ratio of capital expenditures by ultra-large-scale cloud computing companies to operating cash flow is expected to approach 100% by year-end, a significant increase from 40% in 2023. Although this number is still below the 140% peak during the telecommunications industry's peak in 2001, the rate of increase has raised concerns.
Subramanian wrote in the report that the S&P 500 has risen about 11% this year, but the overall market increase is primarily driven by earnings revisions; the overall valuation multiple has actually slightly compressed from a forward P/E ratio of 22 times at the beginning of the year to 21 times.
Meanwhile, sectors such as finance, healthcare, and consumer discretionary have recorded negative returns this year, and the strong performance at the index level masks the fact that the internal yield differentiation has continued to rise to its highest level since the pandemic.
免责声明:本文章仅代表作者个人观点,不代表本平台的立场和观点。本文章仅供信息分享,不构成对任何人的任何投资建议。用户与作者之间的任何争议,与本平台无关。如网页中刊载的文章或图片涉及侵权,请提供相关的权利证明和身份证明发送邮件到support@aicoin.com,本平台相关工作人员将会进行核查。


