Dear friends, I am Sister Qinglan. This morning, the market experienced two noteworthy pieces of news amid extreme fear. On one hand, the Fear and Greed Index fell to 8, reaching an historical low, and on-chain data shows that large whales are quietly accumulating BTC, which is usually seen as a signal of a bottom area. On the other hand, news of institutions buying on dips is also spreading, indicating that large funds have not been shaken by the drop below 60,000. The combination of these two pieces of information suggests that the current price may be at an emotional tipping point, but whether the technical aspect is ready to reverse still requires careful verification.
Current Price and Time
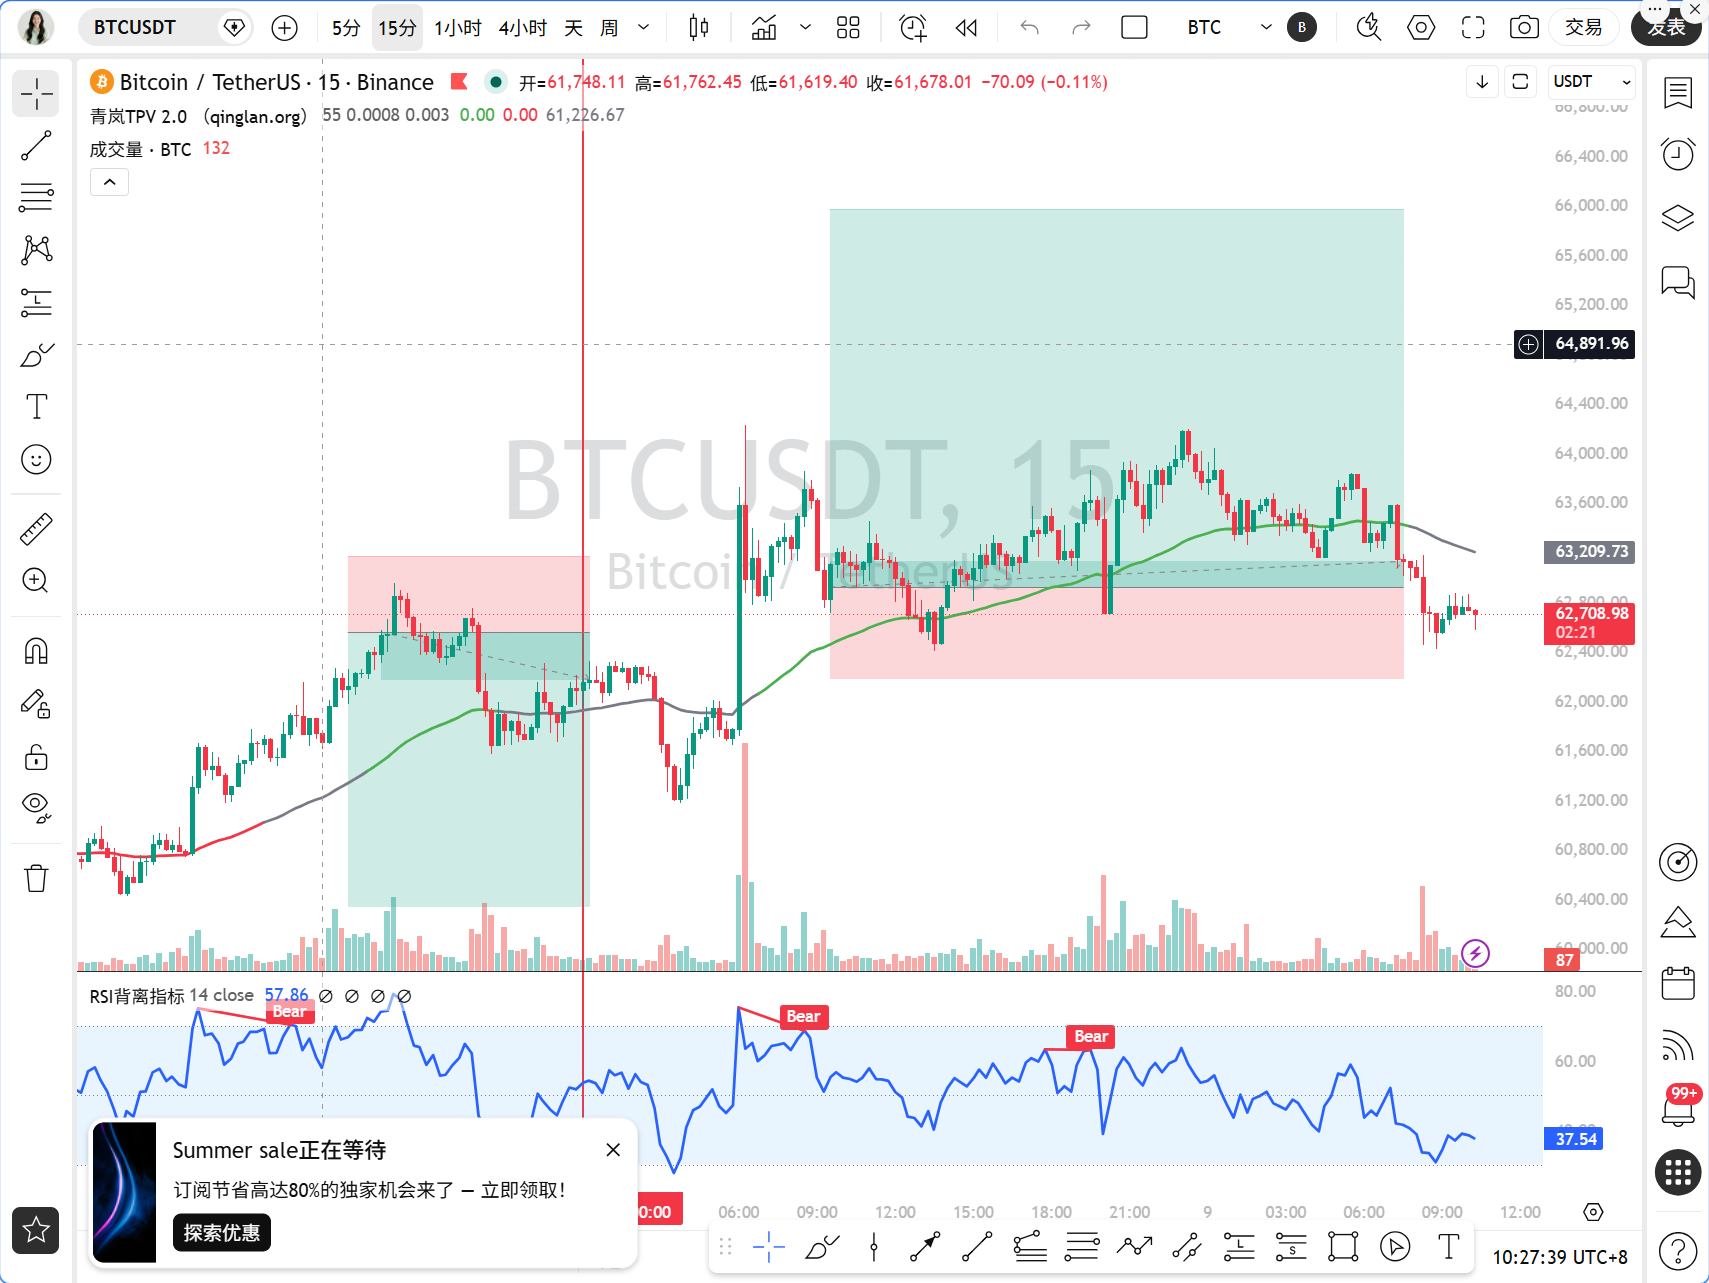
It is now June 9th, 10:28 AM, with Bitcoin quoted at 62718 USDT. The 24-hour decline narrowed to 0.39%, and the market has temporarily entered a narrow fluctuation period after experiencing a round of panic selling.
Multi-Cycle Overview
First, looking at the daily level, MA5 is at 62215, MA10 is at 65095, and MA30 is at 73178, and the moving average system presents a bearish arrangement. The MACD's DIF is -4040, DEA is -3164, and the negative values of the histogram are still expanding, indicating that the downward momentum at the daily level has not yet exhausted. The RSI has dropped to 15.15, which has entered a severely oversold area; historically, such extreme values are often accompanied by short-term rebounds, but a trend reversal will still take time.
Switching to the 4-hour chart, the situation is somewhat different. MA5 is at 63286, MA10 is at 62959, and MA30 is at 62275, with the price currently above the short-term moving averages. The MACD's DIF is -303, DEA is -679, and the histogram has turned positive at 376, indicating a bullish divergence signal at the 4-hour level, suggesting that the downward momentum is weakening. The RSI has risen to 64.66, moving out of the oversold zone.
The 1-hour chart is the focus for today. MA5 is at 62914, MA10 is at 63217, and MA30 is at 63238, with the price operating below the moving averages. The MACD's DIF is 44.48, DEA is 209.14, and the histogram negative value is -164.66, indicating weak short-term momentum. The RSI is at 28.79, on the edge of being oversold. The EMA55 is at 62618.60, which is our bullish-bearish dividing line.
The 15-minute chart shows that MA5 and MA10 are close around 62742 and 62738, with MA30 at 63195, and the price is below the short-term moving averages. The MACD's DIF is -211, DEA is -191, and the histogram negative value is -20.47; the RSI is at 26.82, in an oversold state.
TPV Signal Verification
According to the Qinglan TPV system, we first look at the position of the 1-hour EMA55. The current price is 62718, which is above the EMA55 of 62618.60, with a margin of about 0.16%, classified as line fluctuations. We check the last 8 hourly candles, and the number of closing prices above EMA55 is 7, with 2 crossings. Although the counts lean towards the bulls, the two crossings and price near the line increase the probability of fluctuations. The system judges that the current conditions do not meet strict fluctuation thresholds, but near-line fluctuations remind us not to chase the rise and kill the fall.
For long conditions, first, the price needs to close above the EMA55 for 2 consecutive hourly candles. The current price has just stood above EMA55 but has not yet formed the confirmation of two consecutive candles. Second, the support stabilization signal, the 15-minute chart RSI at 26.82 is oversold, and there are multiple lower shadows near the price of 62500, which can be seen as a short-term support. Third, the downward momentum exhaustion, the hourly MACD histogram's negative value is narrowing, but there is not yet a clear signal of consecutive cycles shortening. In summary, the conditions for going long are not yet fully matured and require waiting for clearer confirmation.
Regarding short conditions, first, the price needs to close below the EMA55 for 2 consecutive hourly candles. The current price is above EMA55, which does not meet the condition. Second, the resistance signal, where the price meets resistance in the 63000-63200 area with MA30, but an effective top reversal has not yet formed. Third, the weak rebound signal, with RSI at 28.79, indicating a low level and insufficient rebound momentum. The short conditions are also not mature.
Therefore, the current TPV system determines a fluctuating bullish pattern, but near-line fluctuations increase uncertainty. We should approach this with a range mindset and not actively chase long or short positions.
On-Chain Capital Situation
The Fear and Greed Index has dropped to 8, which is historically very low and usually corresponds with market bottom areas. The news of whales accumulating and institutions buying on dips corroborates this. However, on-chain data also shows that whales are shorting ETH, which may suppress overall market sentiment. On the capital front, the correlation with the US stock market has increased, and Bank of America warns of bear market signals, indicating that the external environment is not friendly. Overall, on-chain data suggests a bottom area, but short-term capital still faces pressure.
Key Defense and Attack Levels
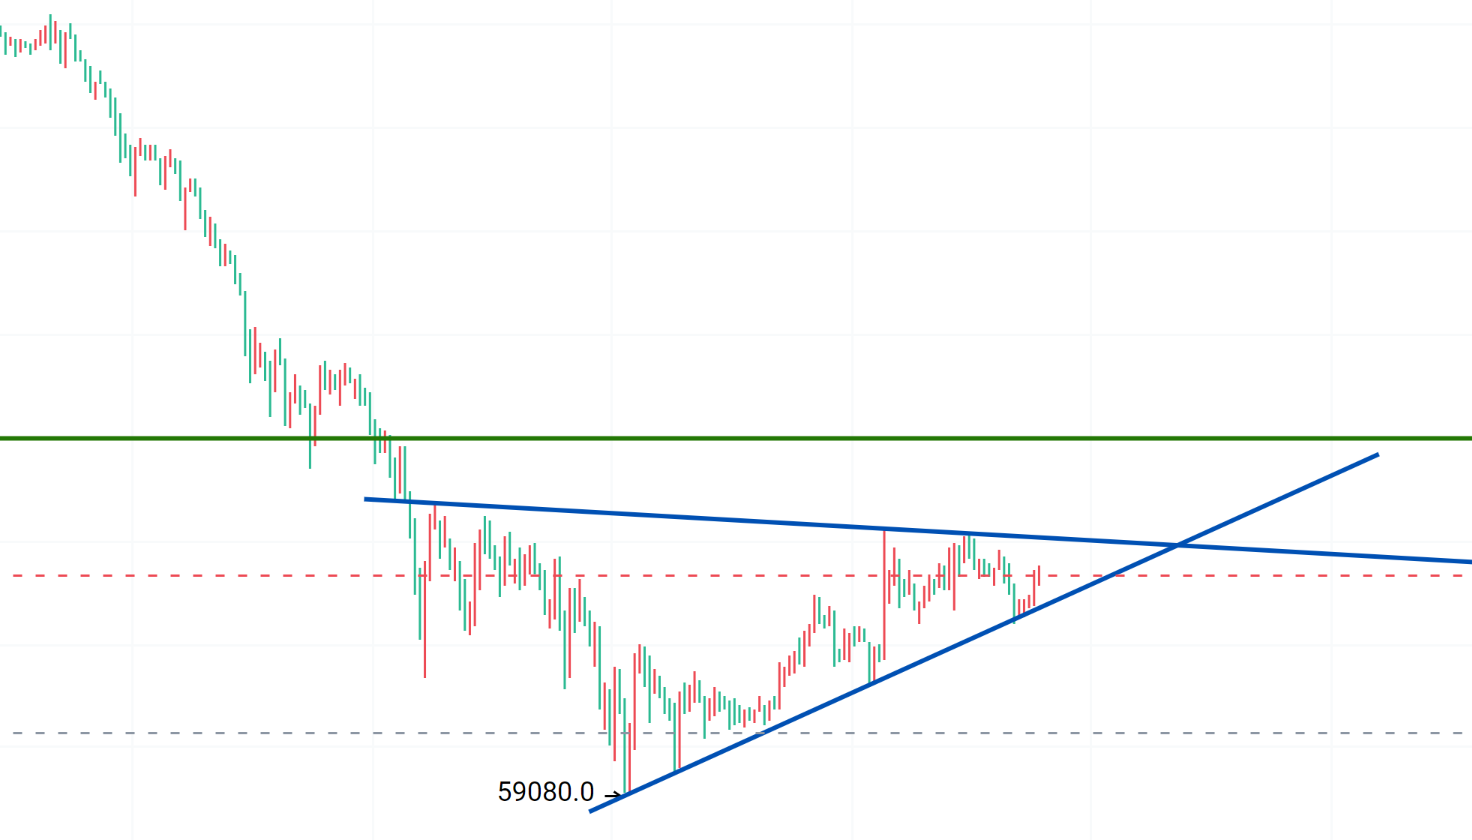
The first resistance level above is in the 63200-63500 area, which is the 1-hour MA30 and previous minor peaks. The second resistance level is in the 64000-64500 range, which is the recent rebound high. The first support level below is in the 62500-62600 area, which is the EMA55 and recent low region. The second support level is in the 62000-61500 area, which is the daily MA5 and a previous high transaction area. If the price breaks below 61500, it may test the significant level of 60000.
Trading Strategy
Direction: Fluctuating bullish, but confirmation is needed. Currently, do not actively go long or short, focusing on range trading.
Entry Conditions: For long positions, wait for the price to pull back to the 62500-62600 area, and look for a 15-minute bottom formation or long lower shadow, with the hourly MACD histogram shortening for two consecutive cycles. For short positions, wait for the price to rebound to the 63200-63500 area, and look for a 15-minute top formation or long upper shadow, with the hourly MACD histogram shortening for two consecutive cycles.
Stop-loss Level: Set the long stop-loss below 62300, and the short stop-loss above 63700.
Target Level: For longs, the first target is 63200, and the second target is 64000. For shorts, the first target is 62500 and the second target is 62000.
Risk Warning
The current market is in an extremely fearful state, volatility may intensify, and all trades must have strict stop-loss policies; do not hold onto losing positions.
Follow the Qinglan Crypto Classroom to seize more trading opportunities! Visit the official website www.qinglan.org
📊 Qinglan TPV Trading Strategy Backtest Reference
🕒 Last Backtest Time: 06-09 07:00:01
Total Analysis: 2117, Backtest: 1707, Accuracy Rate: 68.7% (1173/1707)
免责声明:本文章仅代表作者个人观点,不代表本平台的立场和观点。本文章仅供信息分享,不构成对任何人的任何投资建议。用户与作者之间的任何争议,与本平台无关。如网页中刊载的文章或图片涉及侵权,请提供相关的权利证明和身份证明发送邮件到support@aicoin.com,本平台相关工作人员将会进行核查。