The King of Volatility Changes: In 2026, chips are crazier than Bitcoin.
Written by: DWF Labs
Translated by: Chopper, Foresight News
The most well-known label for Bitcoin is "digital gold." But how closely does it truly follow gold? If not gold, what does it correlate with?
Bitcoin Correlates More with Stocks
From 2016 to 2019, Bitcoin was almost uncorrelated with all assets. Its correlation with stocks, gold, US treasury bonds, and the US dollar was weak every year, never exceeding 0.22 and never dropping below -0.14, oscillating between slightly positive and slightly negative correlation without a stable pattern.
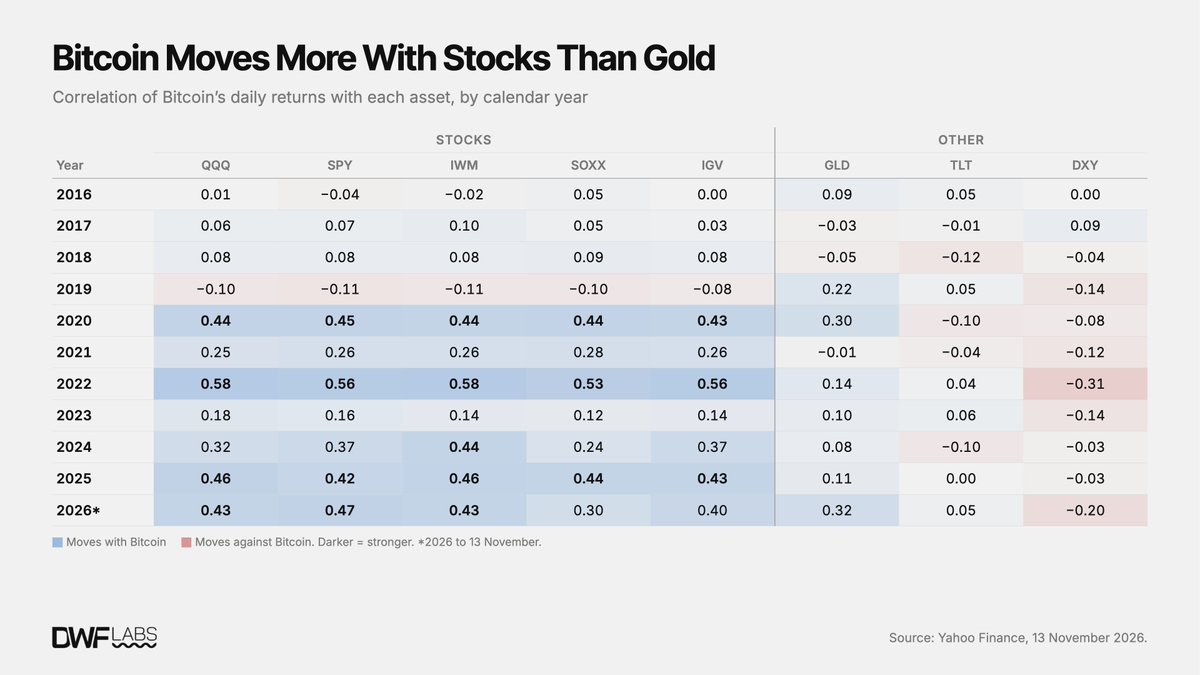
Correlation Between Bitcoin and Major Assets Since 2016
Despite its title as "digital gold," Bitcoin's correlation with gold has mostly been weak over the past decade: of ten complete years, eight fell between -0.05 and 0.15, with only 2019 (0.22) and 2020 (0.30) showing an uptick. The year 2026 has so far the highest at 0.32.
This uptick occurred in the summer of 2026. The 90-day correlation hovered around 0.2 until June, then rose to 0.59 in September, the highest in ten years, far exceeding Bitcoin's correlation with NASDAQ at that time (0.34).
Bitcoin has consistently had a high correlation with stocks. Whether comparing to the S&P 500 (SPY) or NASDAQ 100 (QQQ), the correlation rose from nearly zero before 2020 to 0.39-0.40 at the time of the spot ETF's launch in 2020, and has since maintained at 0.39, with peaks during the sell-off in 2022 exceeding a 90-day peak of 0.6 and a 30-day peak of over 0.8.
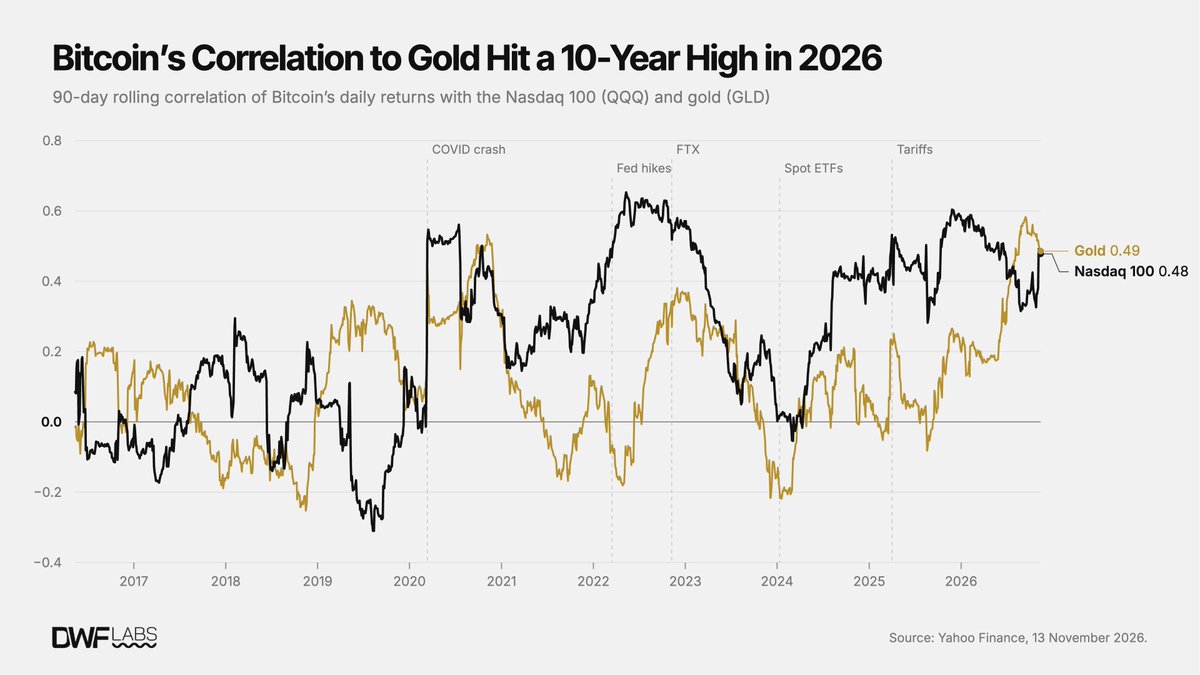
Correlation Between Bitcoin and SPY, QQQ
A correlation of 0.4 is moderate, not high. Stocks can only explain about one-sixth of Bitcoin's daily volatility. The real importance lies in the trend: from zero to 0.4, and surging during the sell-off. In May 2022, the peak 90-day correlation reached 0.65.
Other sectors of the stock market also showed a similar pattern. Small-cap stocks (IWM), chips (SOXX), and software (IGV) all surged in 2020, peaked during the sell-off in 2022, retreated in 2023, and then rebounded again.
Bitcoin had a slight negative correlation with the US dollar index (DXY), most noticeably in 2022 at -0.31; this year it is -0.20. It has no stable relationship with long-term US treasury bonds (TLT), with annual correlations ranging from -0.11 to 0.06. A part of the reason is that bonds have changed themselves: before 2020, they were inversely related to stocks, while since 2021, they've correlated slightly in the same direction.
On Days When the Stock Market Drops, Bitcoin Drops Too
On trading days when NASDAQ falls by 1% or more, Bitcoin has been down about three-quarters of the time—74% from 2020 until the ETF's launch and 77% since the ETF's launch, averaging a drop of 2.0%. This is not the behavior expected from a safe-haven asset. During the same period, gold was down on these trading days 57% of the time, averaging only a 0.2% drop.
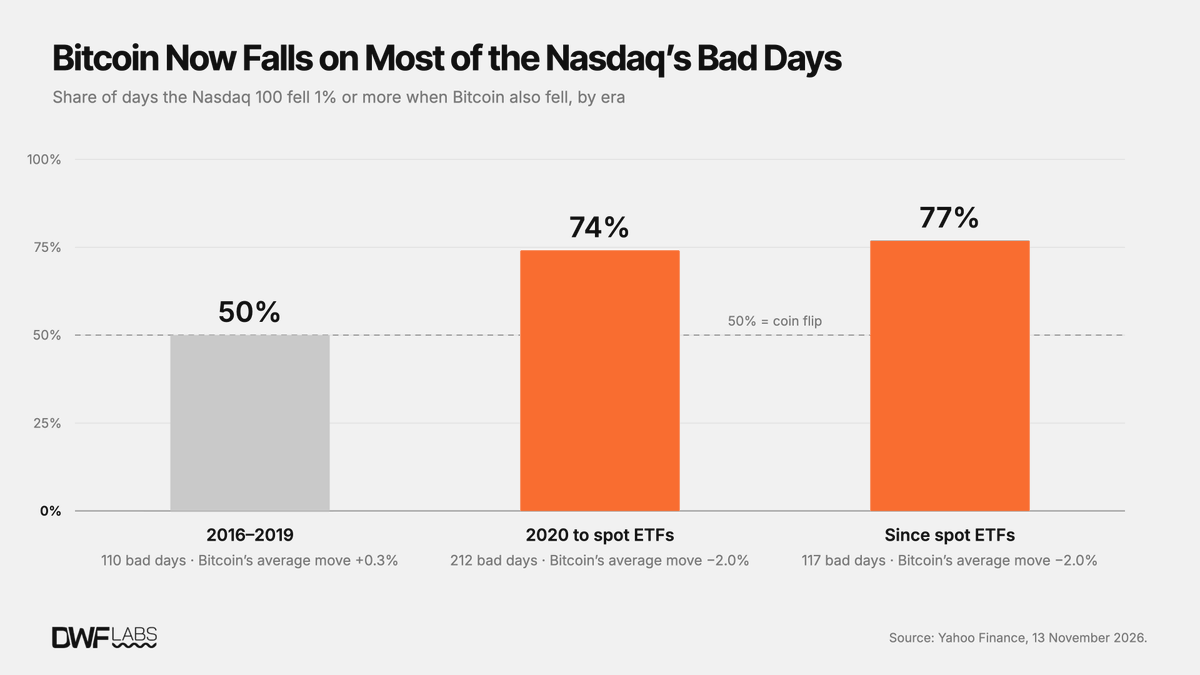
Average Performance and Drop Probability of Assets When NASDAQ Falls Over 1%
Chip Stocks Become the "King of Volatility"
Bitcoin's annualized volatility in 2017 was 90%, five times that of chips and nine times that of NASDAQ. As of 2026, Bitcoin's annualized volatility is 44%, only slightly lower than 2025's volatility (40%). However, it is still double NASDAQ's volatility of 22%.
An unexpected development has emerged in semiconductors (SOXX). This year, chips' volatility stands at 52%, exceeding that of Bitcoin for the first time in a decade. From 2016 to 2025, Bitcoin was the most volatile among these assets every year.
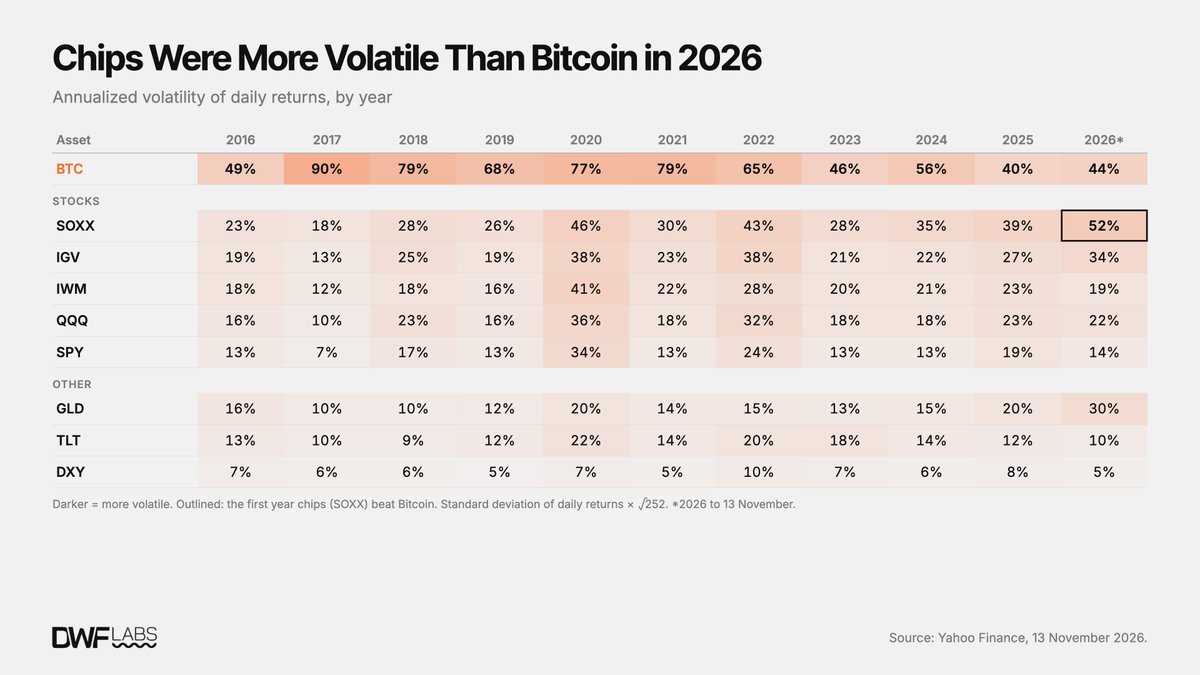
Annualized Volatility of Assets, 2016–2026
Bitcoin's volatility has roughly halved since 2017, decreasing from 90% to 44%, showing a decline each year until a slight rebound in 2026. Meanwhile, the volatility of each stock sector and gold has been rising. NASDAQ's volatility rose from 10% to 22%, software from 13% to 34%, and chips and gold tripled to their respective peaks of 52% and 30%, with only US treasury bonds and the US dollar staying flat. The year 2017 was unusually calm for stocks, so part of this rise was due to the low starting point.
Since September 2025, AI Trading Has Surpassed Bitcoin
Chip stocks decoupled from NASDAQ in September 2025. By the end of that month, its 60-day correlation with the NASDAQ dropped to 0.61, the lowest since 2018. Since then, chips have risen 85%, NASDAQ up 21%, software down 6%, and Bitcoin down 39%.
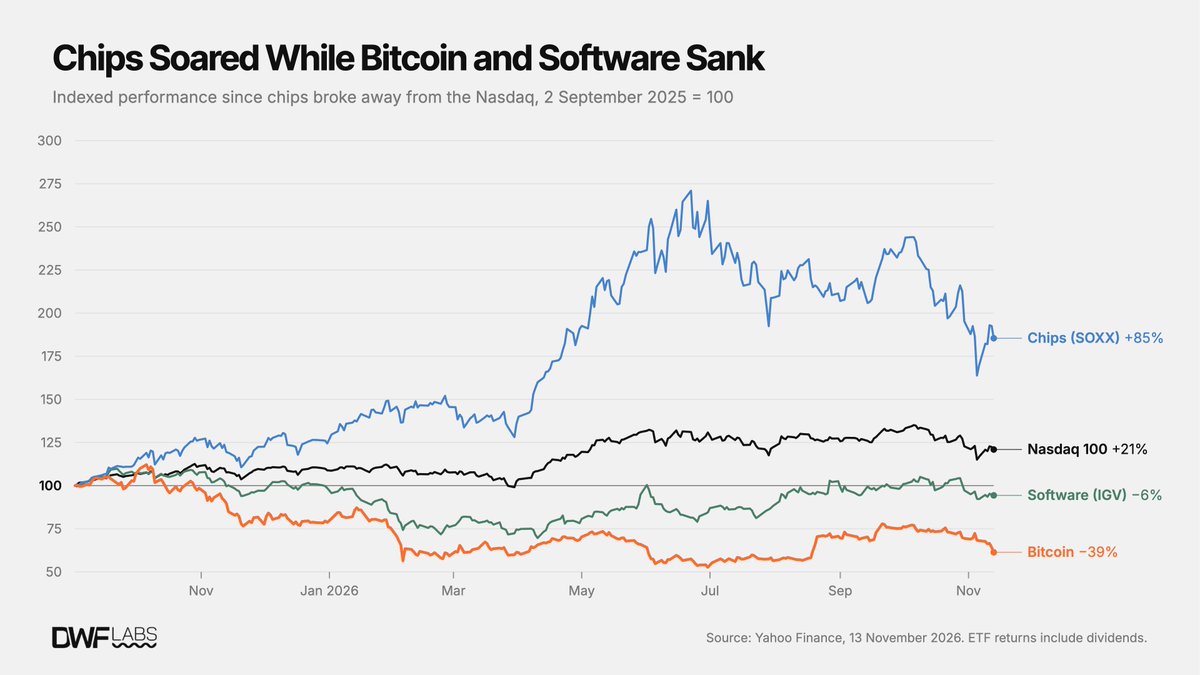
Cumulative Rise and Fall of Chips, NASDAQ, Software, and Bitcoin Since September 2025
Bitcoin Now Moves with Software, Opposite to Chips
This year, Bitcoin is positively correlated with both chips (0.30) and software (0.40), as NASDAQ tends to move these three together on the same day. To eliminate NASDAQ's pull, we measure each asset's relative performance against NASDAQ: If NASDAQ rises 2% and chips rise 3%, the relative performance of chips is +1%. We then examine whether Bitcoin's relative performance moves in the same direction as chips or software.
Before the advent of ChatGPT, Bitcoin's performance did not align with chips or software, having a correlation of 0.02 with chips and 0.03 with software. After ChatGPT's introduction, Bitcoin began to lag behind on days when chips outperformed. Since September 2025, Bitcoin's performance has aligned with software, with a correlation of 0.35; however, for six months, chips also moved in the same direction, with a correlation of 0.18, likely because the tech stock sell-off at the end of 2025 dragged all three down together. Since March 2026, Bitcoin's performance has diverged significantly: with a correlation of 0.20 with software and -0.30 with chips.
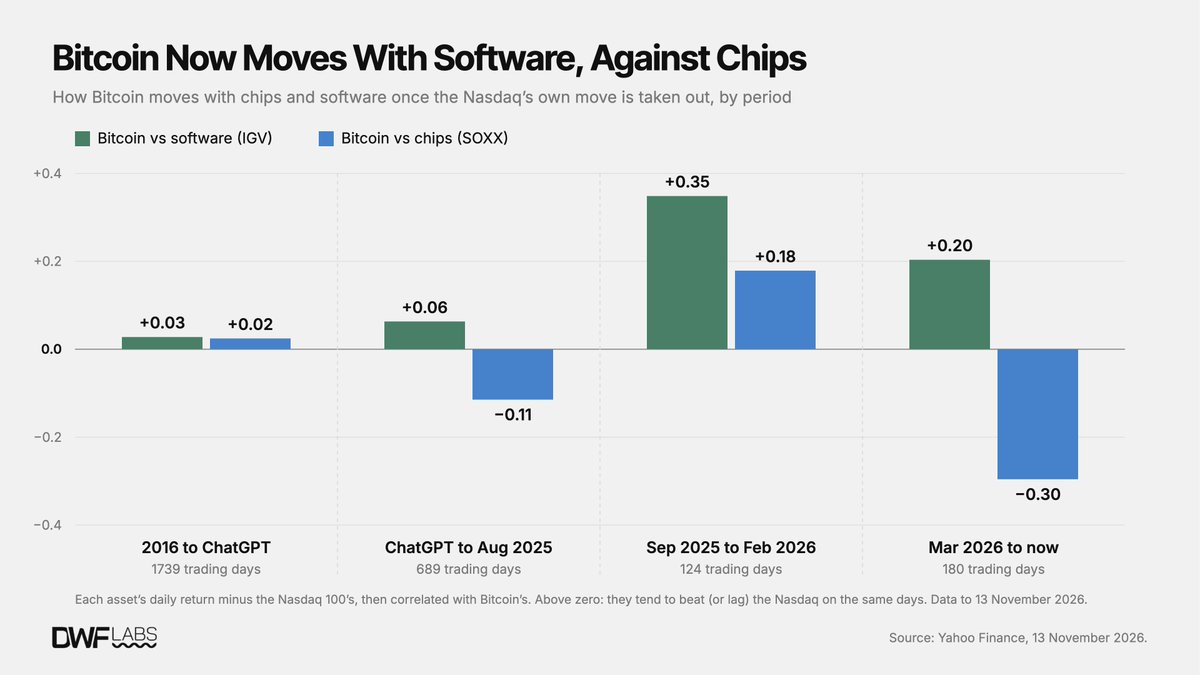
Bitcoin's Relative Performance Against NASDAQ and Its Correlation with Chips and Software's Relative Performance
Monthly returns measured in the same way point to the same conclusion. After ChatGPT, Bitcoin's relative monthly performance against NASDAQ has been inversely correlated with chips. In the months when chips outperformed NASDAQ (22 months), Bitcoin lagged by an average of 1.2%; in months when chips underperformed NASDAQ (25 months), Bitcoin outperformed by an average of 3.6%. Before ChatGPT, there was hardly any difference between the two.
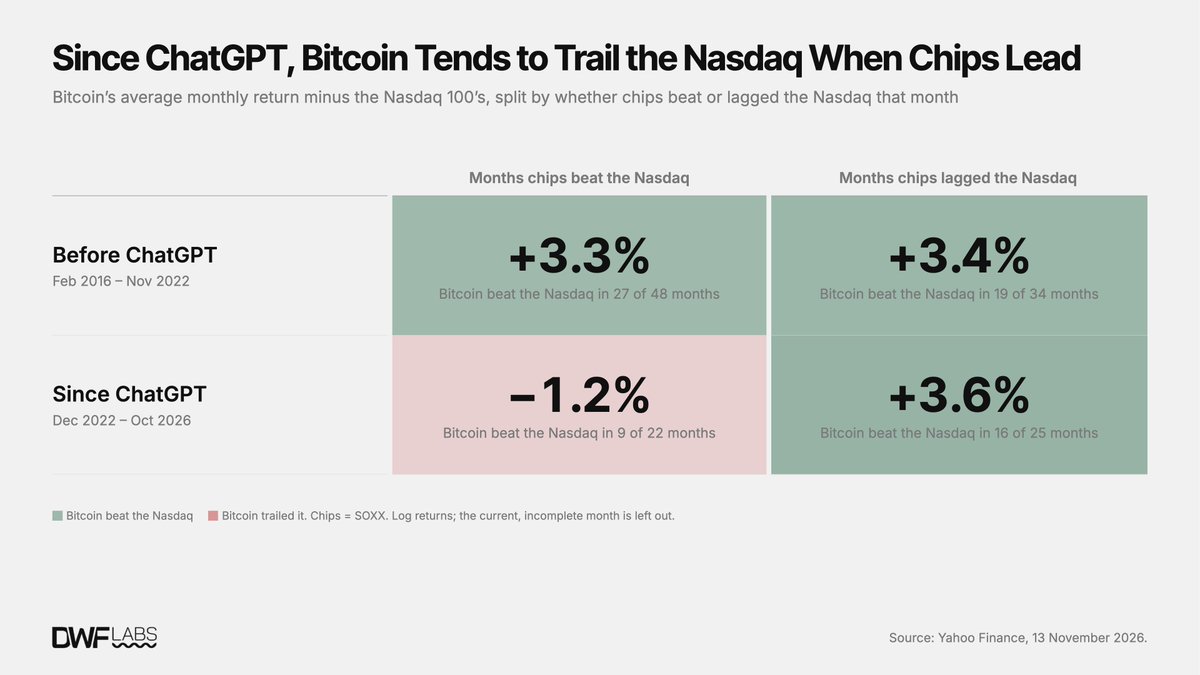
Relative Monthly Performance of Chips / Software Against NASDAQ Compared to Bitcoin's Relative Performance
Bitcoin Remains a Risk Asset, But It's More Stable and is Moving Closer to Gold
History shows that Bitcoin is a risk-seeking asset, not a safe-haven asset. Since 2020, its correlation with stocks has been the strongest, not with gold. It has also become more stable: its volatility has roughly halved since 2017, while this year chips' volatility has surpassed Bitcoin for the first time. Despite this, Bitcoin's volatility is still about twice that of the NASDAQ index.
In the past year, there have been two changes. First, Bitcoin has been excluded from the dominant risk-seeking trading AI, moving in line with software instead of chips since March 2026. Second, its correlation with gold has reached the strongest in ten years, with the 90-day correlation peaking at 0.59 in September, currently around 0.49, equal to that of NASDAQ. If this bond continues to strengthen and volatility continues to converge, it will be the first sign that Bitcoin is truly starting to exhibit its safe-haven properties.
免责声明:本文章仅代表作者个人观点,不代表本平台的立场和观点。本文章仅供信息分享,不构成对任何人的任何投资建议。用户与作者之间的任何争议,与本平台无关。如网页中刊载的文章或图片涉及侵权,请提供相关的权利证明和身份证明发送邮件到[email protected],本平台相关工作人员将会进行核查。