In the past week, an unusual phenomenon has appeared in the cryptocurrency market:
Funds have clearly returned, but prices have not really moved.
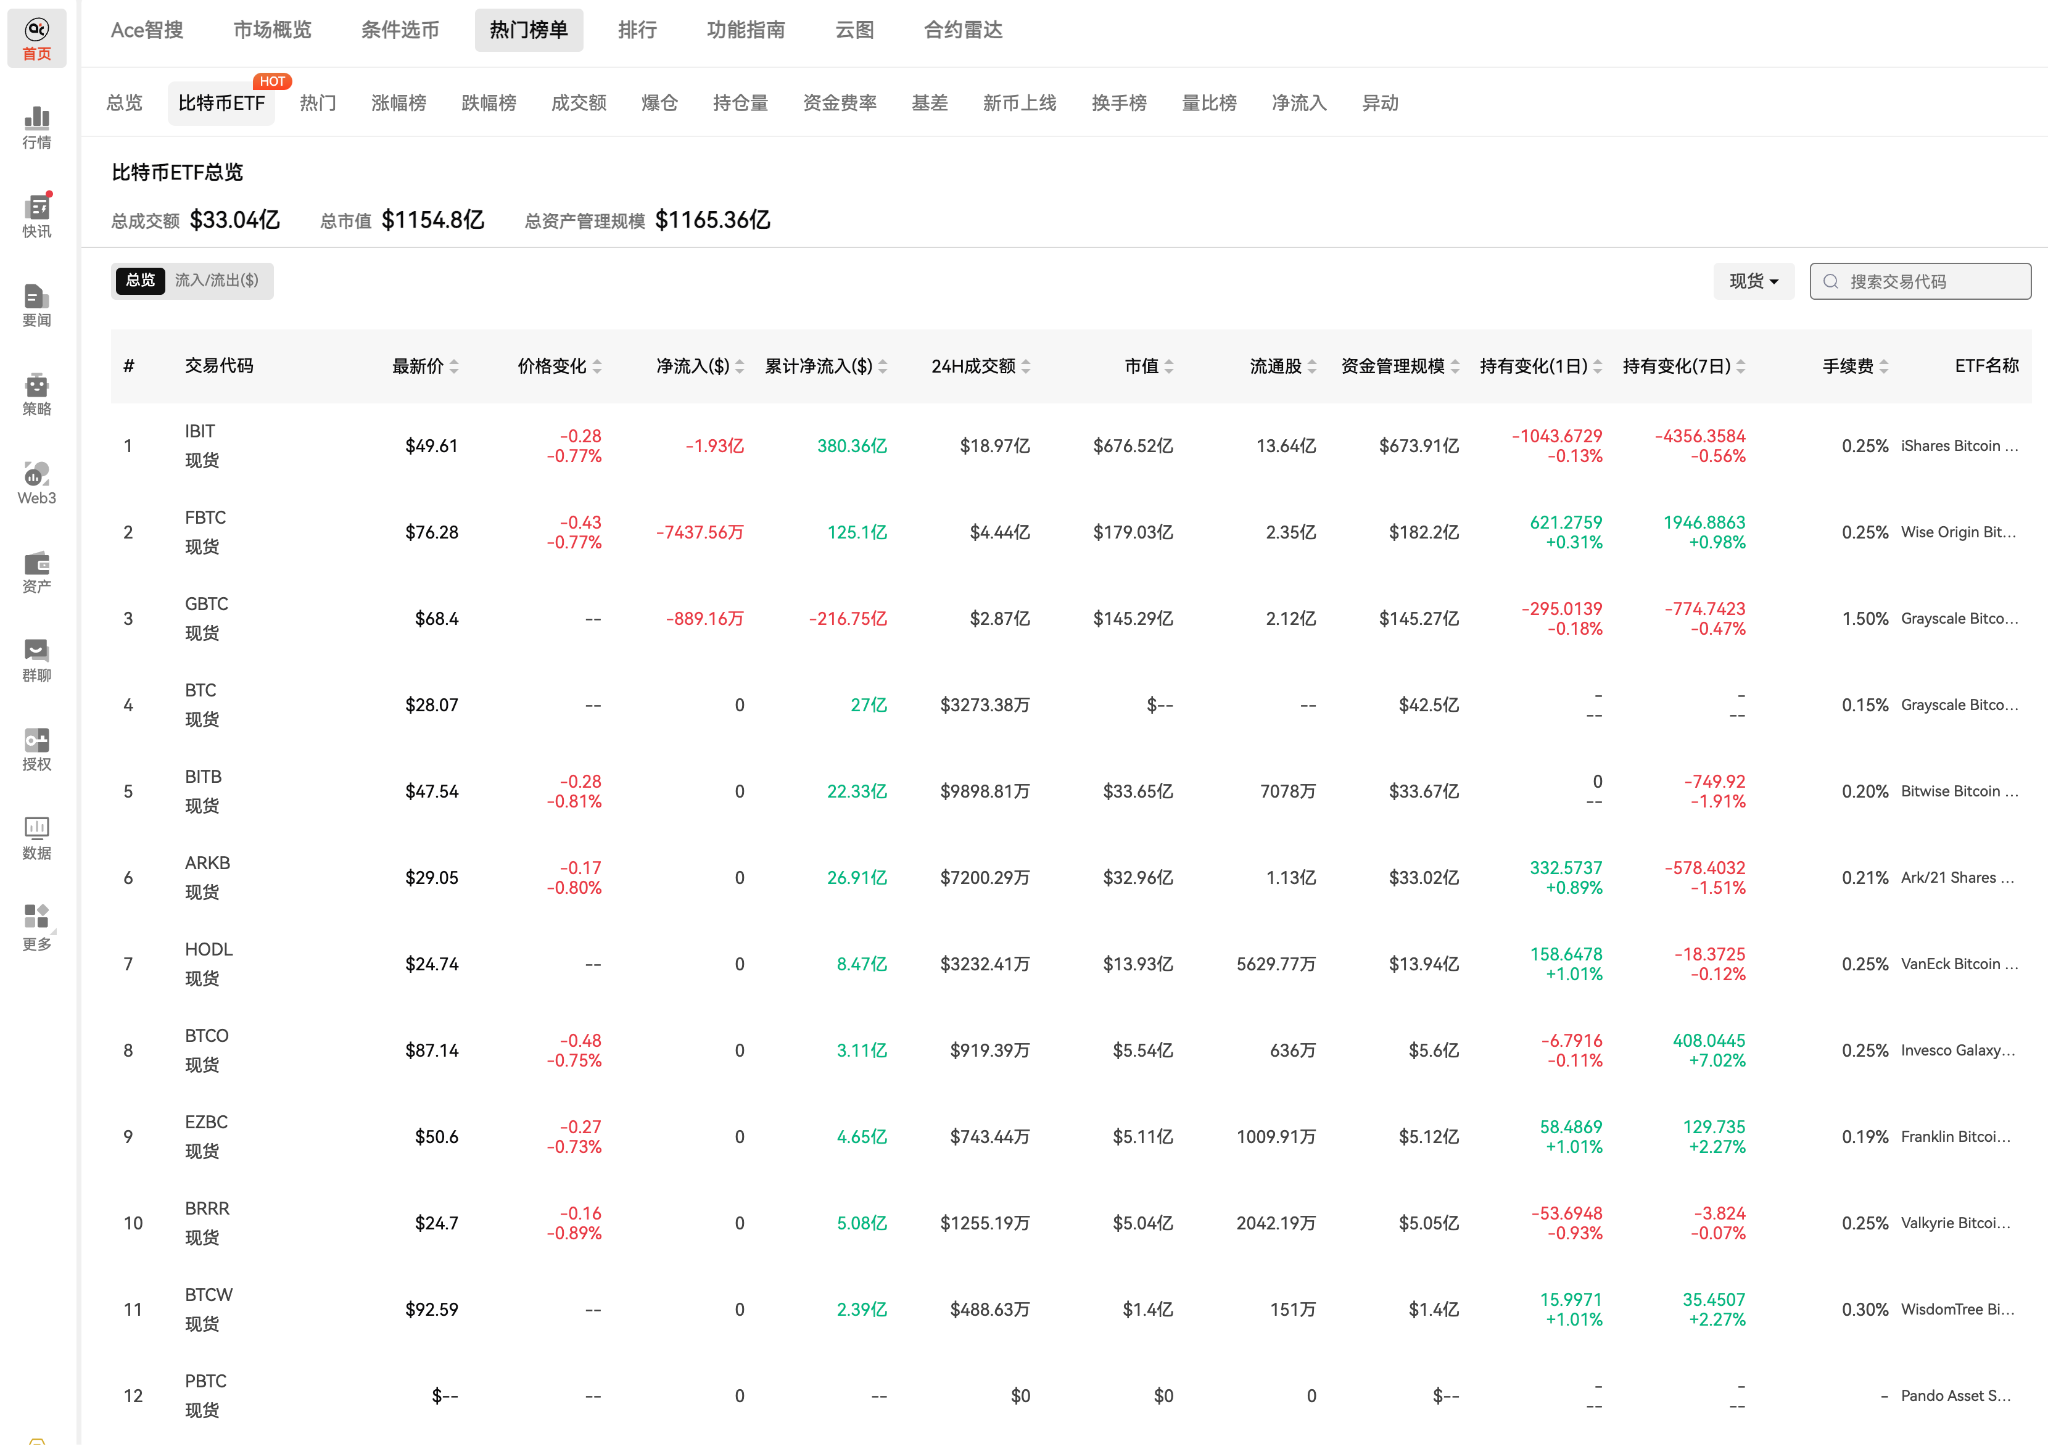
The U.S. spot Bitcoin ETFs have seen a strong inflow of funds, and market liquidity has significantly rebounded. According to recent market statistics, the inflow into BTC spot ETFs reached several hundred million dollars, while the total inflow into BTC and ETH-related spot ETFs reached approximately $1.1 billion.
According to the traditional logic of "funds driving prices," such a scale of buying volume should be sufficient to push BTC upward.
But the reality is that BTC remains in a consolidation structure.
What does this mean?
One possibility is that the buying from the ETFs is continuously absorbed by the selling pressure from the other side of the market.
Another possibility is more complicated:
Some seemingly strong inflows of funds do not entirely equate to directional buying.
When long-term holders, institutions adjusting positions, cash-and-futures arbitrage, and derivatives hedging occur simultaneously, the market may enter a typical state:
Funds are flowing, chips are exchanging, but prices are temporarily not choosing a direction.
With the upcoming U.S. CPI announcement, this balance may soon be disrupted.

1. ETF frenzy buying, why is BTC “not moving an inch”?
To understand this question, one must first overcome a simple misconception:
ETF net inflows ≠ BTC prices should rise by the same magnitude.
After ETFs buy BTC, they must obtain chips from other market holders.
This means that as long as there is sufficiently strong selling in the market simultaneously, the new buying volume can be fully absorbed.
The most noteworthy sellers in the current market come from three directions.
First type: Long-term holders
When BTC is at relatively high levels, investors who have held their coins for a long time often start cashing out in batches.
They do not necessarily think the bull market is over.
Most of the time it's just:
It has risen enough; let's sell a portion first.
This "stepwise" selling does not create obvious sharp declines, but it does form a continuous supply wall.
The ETF keeps buying every day, while long-term holders keep selling every day.
This eventually results in:
Buying absorbs selling, maintaining price consolidation.
Second type: Institutions and whales adjusting positions
The large BTC holders in the market do not necessarily trade simply on a "bullish" or "bearish" outlook.
Institutions may need to:
- Adjust balance sheets;
- Recapture some funds;
- Change spot exposure;
- Manage risks in conjunction with financing structures;
- Hedge through derivatives.
Therefore, seeing a large player sell BTC does not simply lead to the conclusion that "institutions are turning bearish."
What is truly worth observing is:
Whether this selling is persistent and whether the market can absorb all these chips.
Third type: Arbitrage funds
This is the layer that is most easily overlooked.
Some institutional funds buying ETFs do not mean they are betting on BTC’s rise.
If there is a sufficient cash-and-futures price difference in the market, institutions can achieve:
Buying spot/ETF + shorting futures
to capture basis returns.
The characteristic of this kind of trading is:
There are indeed buying volumes in ETFs, but directional risks have been partially hedged.
Therefore, simply observing ETF net inflows does not allow one to directly determine how much "pure long funds" have entered the market.
2. What really matters is what kind of chips the ETF is absorbing
This is also the most core contradiction in the current market.
Assuming the ETF continuously buys BTC, while the sellers mainly come from long-term holders.
This means the market is actually undergoing a large-scale:
Chip transfer.
From early holders to new institutional funds.
This process often does not bring immediate explosive growth.
Because the market first needs to complete the digestion of supply.
But once the selling pressure from long-term holders gradually decreases, and the ETF demand continues, then the supply-demand relationship may suddenly change:
Buyers do not significantly increase, but prices begin to rise.
The reason is very simple:
The sellers have disappeared.
So, what is currently most worth observing is not "how much ETF bought," but:
After ETF buying, how many people are still willing to sell?
This is also why ETF fund flows should not be observed in isolation.
Only by putting ETF inflows, exchange BTC balances, whale addresses, and prices together can we get closer to the true state of market supply and demand.
3. What whales are doing is more important than whether they are "bullish or bearish"
For ordinary investors, the biggest difficulty is:
It’s hard to know what big funds are really doing.
If a whale address transfers BTC to an exchange, does it mean they are going to sell immediately?
Or is it for internal repositioning?
Or for collateral financing?
One individual transfer cannot provide answers.
But if we see:
High prices + multiple large addresses concentrating on transferring to exchanges + increased inflow of BTC to exchanges
Then the potential selling pressure deserves attention.
Conversely, if BTC prices maintain strength, and large addresses do not show a significant increase in exchange deposits, and even continue to transfer BTC out of the trading platform, then supply pressure may be decreasing.
This also highlights the value of on-chain data:
It cannot directly predict prices but can help investors observe the shifts in chips behind the prices.
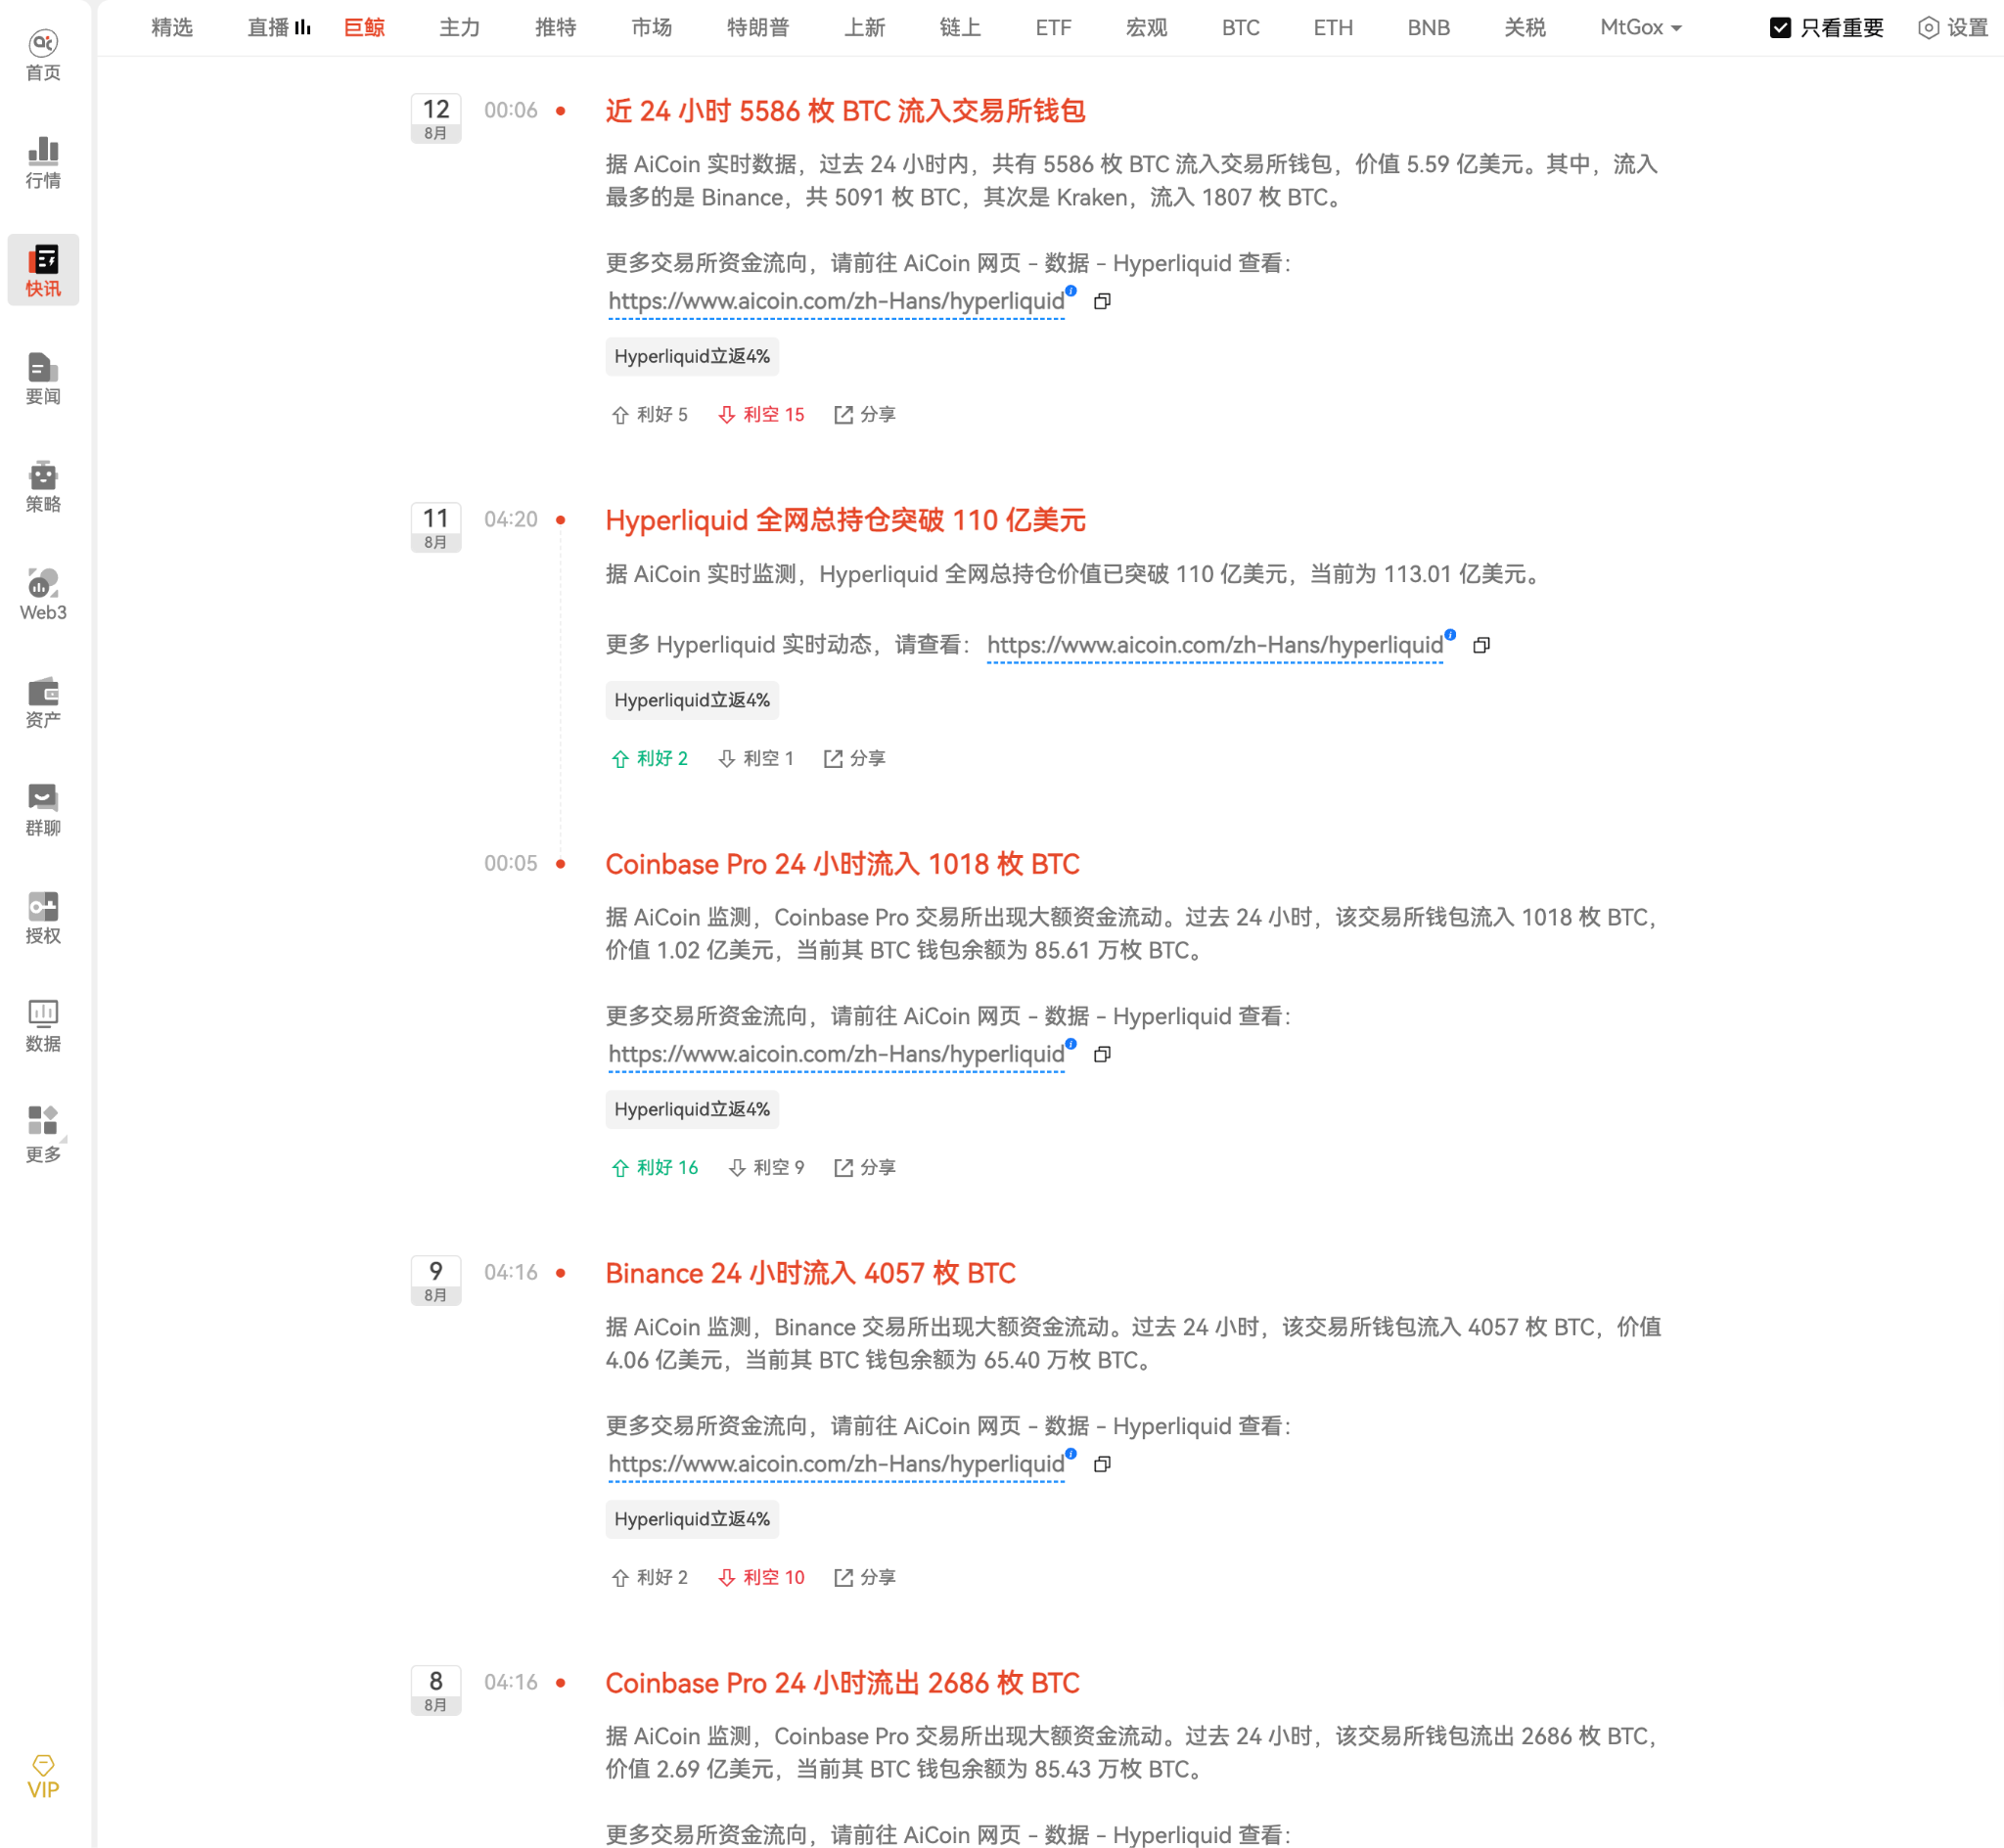
If you need to track this kind of data in real time, market tools like AiCoin can consolidate ETF fund flows, whale addresses, and institutional data into a single observation framework.
The most important thing here is not to "see a whale transfer and trade immediately," but rather:
Verify on-chain anomalies within the overall market structure.
4. There is another key question: How much "leverage" is there in this round of increases?
If ETFs and on-chain data address "what is happening in the spot market," then derivatives data addresses another question:
How crowded is the market?
Especially after BTC has been consolidating, many traders will bet on a breakout in advance.
Thus, the following might occur:
- OI continues to increase;
- Funding rates warm up;
- Cash-and-futures basis expands;
- Long and short leverage quickly accumulate.
At this time, prices may seem strong, but in reality, market fragility is also increasing.
Because once the breakout fails, a large amount of leveraged positions may turn into selling pressure.
Therefore, to determine whether BTC's breakout is healthy, one can simply observe a combination:
Healthy structure
Price rises + increased spot trades + continuous ETF inflows + moderate OI increase
Structures to watch out for
Price rises + OI surges + funding rates rapidly warming up + insufficient spot follow-up
The latter does not necessarily imply falling.
But it means:
This round of increases is increasingly reliant on leverage.
The higher the leverage, the more likely it is for prices to experience drastic reversals.
5. CPI may be the fuse that breaks the current balance
Now, the question arises:
Since both bulls and bears have formed a relative balance, what can break this state?
The answer is likely macro data.
The U.S. July CPI will be announced on August 12.
What the market is truly trading is not "whether CPI is high or low," but rather:
The gap between actual data and market expectations.
Scenario 1: CPI lower than expected
If inflation clearly cools, the market may raise expectations for future easing policies.
The potential path is:
CPI cools
→ Interest rate cut expectations rise
→ U.S. Treasury yields come under pressure
→ The dollar weakens
→ Risk appetite returns
→ BTC breaks out
If ETF funds continue to flow in, while long-term holder selling pressure decreases, then the current consolidation could shift from "chip exchange" to a genuine trend initiation.
Scenario 2: CPI higher than expected
If core inflation shows clear stickiness, the market may lower expectations for easing policies.
What may follow is:
U.S. Treasury yields rise
→ The dollar strengthens
→ Risk assets come under pressure
→ BTC breaks short-term support
If the market has previously accumulated a large amount of leveraged longs, then continuous liquidations may also occur during the decline.
In this case, the most dangerous situation is not "a slight drop."
But rather:
Spot declines + leveraged liquidations + rapid OI decrease forming a chain reaction.
Scenario 3: CPI meets expectations
Many people might think "meeting expectations = no action."
In reality, it may be the opposite.
If the data essentially matches market pricing, the market may first see spikes up and down, clearing long and short leverage, before returning to the original consolidation range.
This type of market easily traps short-term traders in:
Chase up → pull back → stop loss → rebound → chase up again
cycles.
Thus, in event-driven market situations like CPI:
While direction judgment is important, positioning and risk management are often even more critical.
6. After the CPI announcement, don’t rush to guess the ups and downs, first look at these sets of data
Experienced traders often do not focus solely on one BTC candlestick.
After data is announced, focus on observing four groups of signals:
① ETF fund flows
Is the money continuing to flow in?
Or does it weaken rapidly after good news is realized?
② Whale and exchange flows
Have large addresses suddenly increased their deposits to exchanges?
Is there any significant change on the supply side?
③ OI and funding rates
Is the price increase driven by spot or leverage?
④ Cash-and-futures basis
Is there massive arbitrage funding in the market?
Is the derivatives market beginning to overheat?
If several groups of data resonate in the same direction, they often hold more reference value than a single indicator.
For investors needing to monitor these changes in real time, AiCoin's advantage lies here: Consolidating ETF fund flows, whale tracking, institutional holdings, and derivatives data can reduce the cost of switching between multiple data sources.
7. The real trading dilemma is not "understanding" but "execution"
Assuming you judge that the CPI is bullish for BTC.
BTC begins to rise.
Two issues arise:
When to take profit?
If the judgment is wrong, when to cut losses?
This is precisely the reason many traders ultimately incur losses.
It's not due to a lack of analytical ability.
But rather:
Correct analysis but improper execution.
So before and after event-driven situations, the importance of risk management may even exceed direction judgment.
For short-term traders, setting stop-loss and trailing take-profit in advance, allowing the system to execute based on preset conditions, rather than making ad hoc decisions during quick market fluctuations.
For long-term investors holding a large amount of BTC spot, if they are unwilling to sell long positions due to short-term macro risks, they can also consider establishing appropriate hedge positions through futures, perpetual contracts, or options.
For BTC/ETH markets clearly in a consolidation range, grid strategies and phased dollar-cost averaging are two other semi-automated execution methods.
The significance of tools is not to predict the market for you but to enable your trading plan to be genuinely executed.
8. Turning a complex market into a "fund map"
If we break down the current market, it is actually very simple:
ETF: Look at demand
Whales: Look at supply
Institutional holdings: Look at core capital
OI/Funding rate: Look at leverage
Basis: Look at arbitrage
CPI: Look at macro variables
Stop-loss/Hedging: Look at risk
These layers of data combine to form a complete market picture.
This is also where AiCoin is more suited to intervene—
Not telling investors:
"BTC will surely rise."
But helping investors more quickly answer:
"Where is the money going?"
"Who is selling?"
"Is the market excessively leveraged?"
"Is this market healthy after a breakout?"
9. Conclusion: $1.1 billion is not the answer; the fund structure is
Returning to the initial question:
Why is BTC still consolidating despite a significant inflow of ETF funds?
Because the market is undergoing a high-intensity chip exchange.
ETF funds are absorbing supply.
Long-term holders are cashing out.
Whales and institutions are adjusting positions.
Arbitrage funds may also be simultaneously establishing hedges in the derivatives market.
Therefore, the price being temporarily "not moving an inch" does not mean that no changes are happening in the market.
On the contrary.
The calmer the consolidation, the more it is worth observing what changes are occurring in the fund structure.
And CPI may become the catalyst to break this balance.
What is truly worth focusing on is not betting in advance on "whether CPI will rise or fall," but rather:
Will ETF continue inflows?
Will whales start selling in concentration?
Will OI suddenly surge?
Will funding rates become overheated?
Will the basis expand abnormally?
After BTC breaks out, will there be real spot buying support?
If multiple signals begin to point in the same direction, then the market may have truly made a choice.
For investors, rather than endlessly guessing the next candlestick, it is better to observe funds, chips, leverage, and risks within the same framework.
The market is responsible for creating opportunities; data is responsible for helping you see opportunities, and risk management determines whether you can stay in the market.
The ETF fund flows, whale tracking, institutional holdings, and derivatives data provided by AiCoin can be part of this observation framework.
As for the final direction—
Let the market tell you itself.
Risk Warning: This article is for market information and product function introduction only, and does not constitute any investment or trading advice. Cryptocurrency assets are highly volatile, and ETF fund flows, on-chain data, and derivatives indicators cannot predict price trends alone. Significant macro data announcements such as CPI may lead to sharp volatility, slippage, and forced liquidation risks. Please make decisions cautiously based on your own risk tolerance.
免责声明:本文章仅代表作者个人观点,不代表本平台的立场和观点。本文章仅供信息分享,不构成对任何人的任何投资建议。用户与作者之间的任何争议,与本平台无关。如网页中刊载的文章或图片涉及侵权,请提供相关的权利证明和身份证明发送邮件到support@aicoin.com,本平台相关工作人员将会进行核查。