Coin Circle Academician: On August 12, Bitcoin (BTC) indicator signals converge collectively. A detailed analysis of the market characteristics before the arrival of the turning point? Latest market analysis and operation suggestions.
The current price of Bitcoin is 63500. Many friends have been watching Bitcoin swing back and forth lately. A slight increase makes them feel that a bull market is about to restart, while a slight decrease causes panic that a bear market is returning, resulting in a continuous cycle of chasing rises and cutting losses. The current market has not shown a clear unidirectional trend, and most people’s operations are very passive; they don’t dare to chase the rise and don’t dare to buy the dip, missing out on opportunities and easily getting their positions swept away. In trading, the most fearful thing is being influenced by the market sentiment, losing rhythm while watching fluctuations.
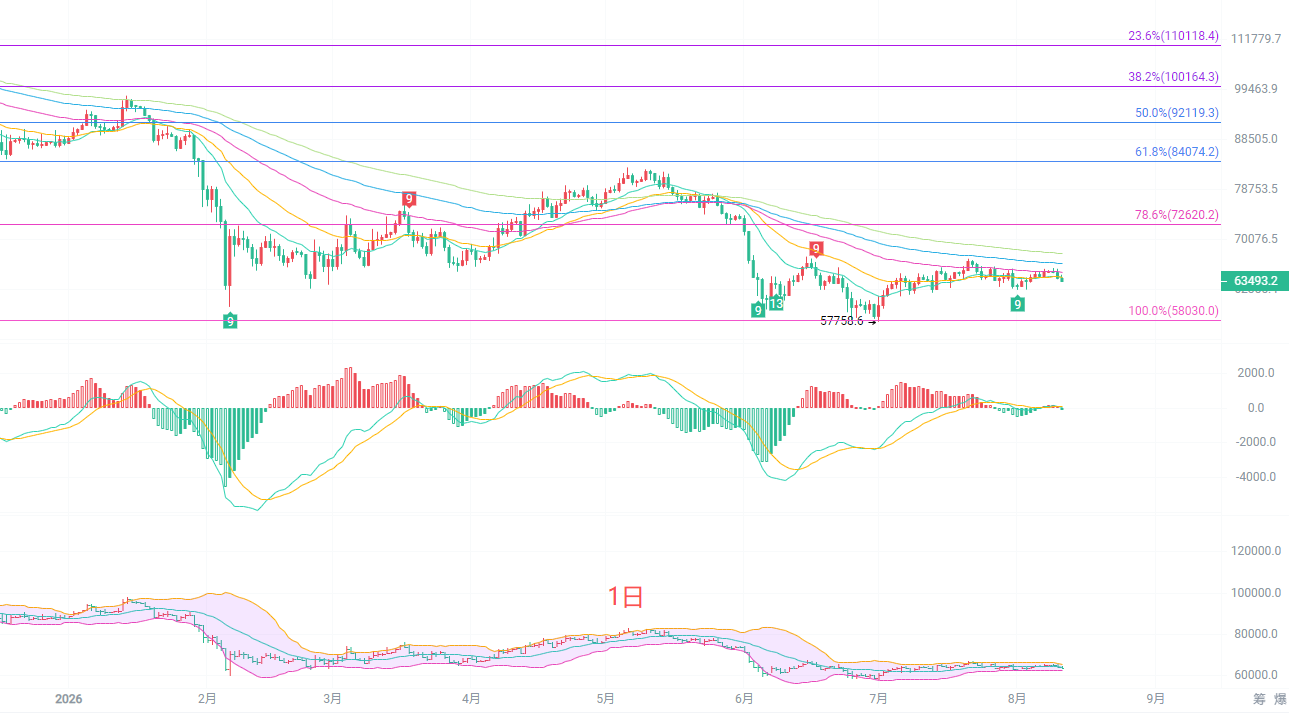
The daily K-line is in a stage of oscillation and repair. After previously reaching a low of 57758, it has started to rebound for repairs, remaining in the repair range after a decline. The moving average system shows a bearish arrangement, with prices under pressure below multiple EMA moving averages, and the upward rebound is significantly constrained. The MACD indicator’s DIF and DEA are intertwined near the zero axis, with long and short forces at a balanced contention, and no obvious unilateral volume expansion has occurred. The Bollinger Bands are continuously narrowing, with the upper track at 65545 and the lower track at 62764, constraining the market’s movement within the track range. Key resistance above is around 64400 to 65500, while core support below is at 62700. If this position effectively breaks down, it will open further downward retracement space.
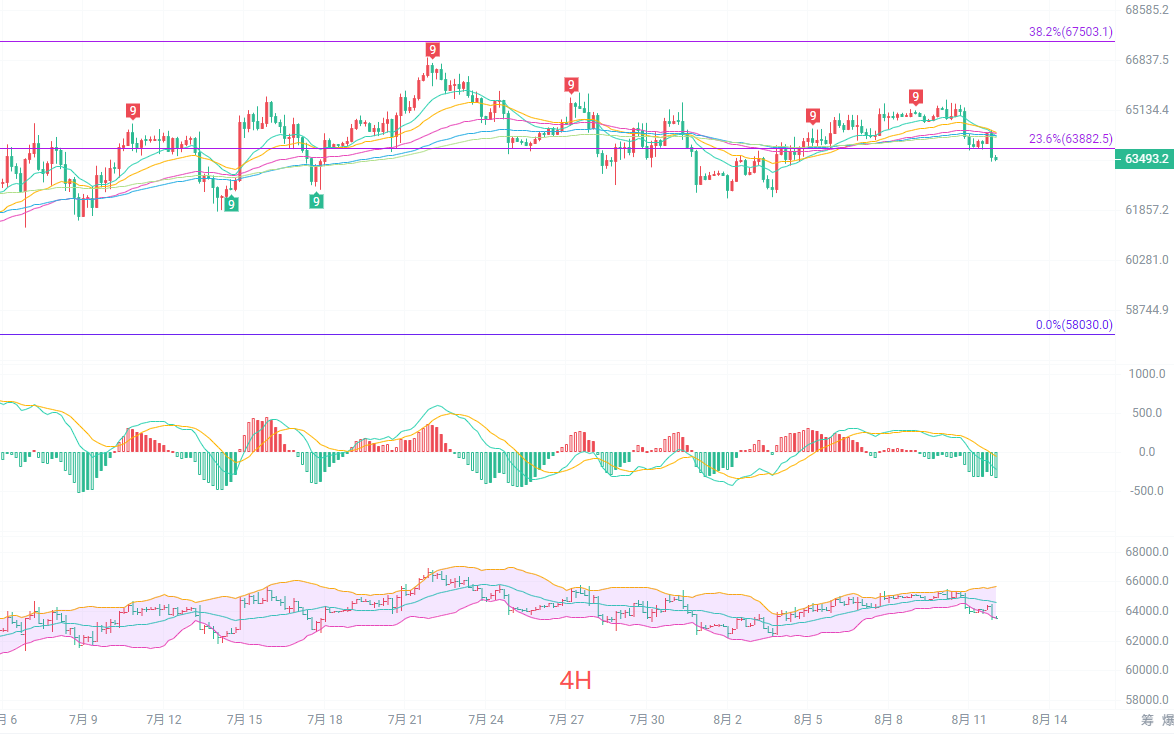
The four-hour K-line has broken below multiple EMA short-term moving averages, with the 15 and 30-period moving averages starting to turn downwards, indicating a decline in short-term bullish momentum. The Fibonacci 23.6% level at 63882 has become a short-term resistance, with the current price having fallen below this level. The four-hour MACD green bars are beginning to expand, indicating the gradual release of bearish strength. The middle track of the Bollinger Bands at 64590 continues to suppress the market, with prices testing support near the lower track at around 63514. Currently, the four-hour level is leaning towards weak oscillation. For bulls to regain control, they need to stabilize above 63882; otherwise, it is likely to continue oscillating downward. Attention should be paid to whether the lower track support can hold; if the support breaks, further downward testing will occur.
Short-term reference:
If the lower support of 63000 to 62500 holds, the target is 64500 to 65500, with a stop loss at 62000.
If the upper resistance of 63800 to 64300 holds, the target is 63500 to 63000, with a stop loss at 43800.
Specific operations should be based on real-time market data. For more detailed information, please consult the author. The article publishing has a delay, and suggestions are for reference only; risk is to be borne by the reader.

Kind Reminder: The above content is only created by the author on the public account. Ads at the end of the article and in the comments section are not related to the author. Please discern carefully. Thank you for reading.
免责声明:本文章仅代表作者个人观点,不代表本平台的立场和观点。本文章仅供信息分享,不构成对任何人的任何投资建议。用户与作者之间的任何争议,与本平台无关。如网页中刊载的文章或图片涉及侵权,请提供相关的权利证明和身份证明发送邮件到support@aicoin.com,本平台相关工作人员将会进行核查。