Li Ying Chat Coin: 8.10 Bitcoin (BTC) and Ethereum (ETH) Latest Market Analysis
The current price of Bitcoin is 65200, this K-line has been sideways for several days at the 65200 level, as if walking a tightrope, unable to rise or fall. Previously, it surged to around 66900 but faced resistance and retreated; now it can't seem to drop, indicating that both bulls and bears are in a wait-and-see mode. From a technical perspective, there is pressure above and support below, resulting in a squeeze market. The short-term moving averages are in a bullish arrangement, and the medium-term trend still leans bullish. The MACD indicator shows a significant decrease in momentum. This suggests a lack of upward strength, and one should be cautious of the risk of a high-level correction. The Bollinger Bands are starting to contract, with the price running above the middle track at 64971, and the upper track resistance level is around 65223. Currently, the price is right at the upper track pressure point; if it cannot break through the upper track with volume, it is very likely to pull back to the middle track to confirm support.
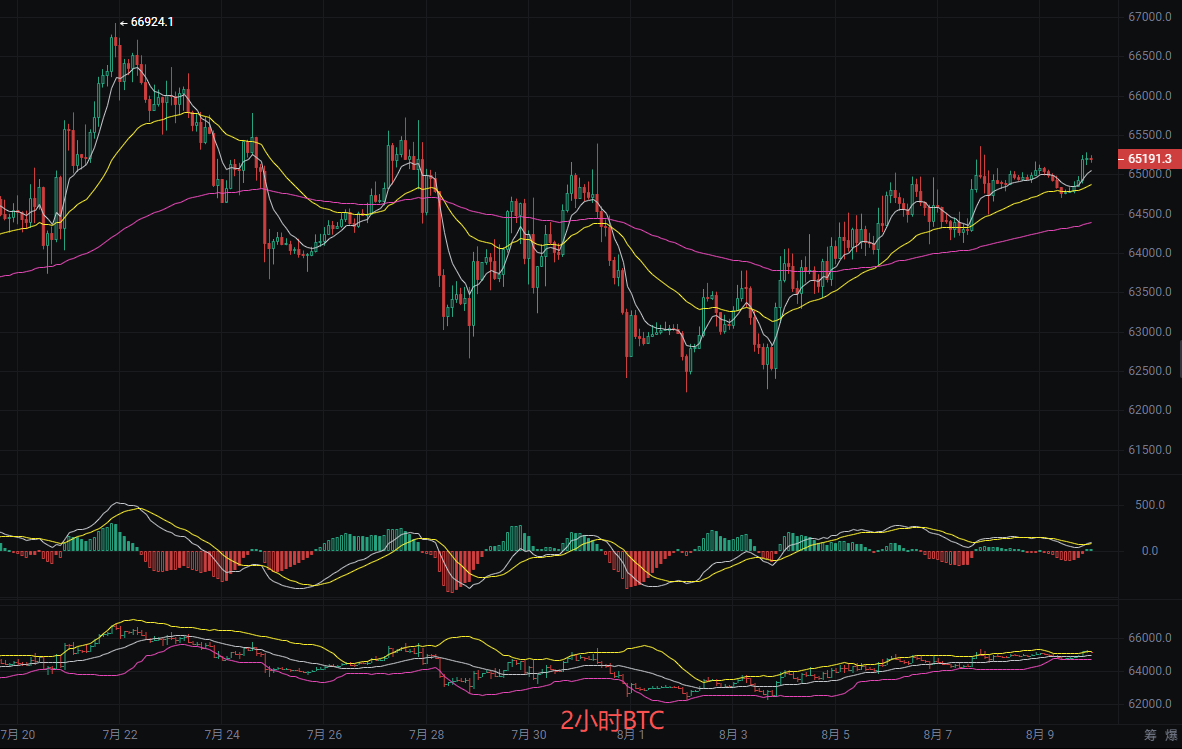
Short-term trading reference:
Going long at 64500-64000, stop loss at 63500, target at 65500 aiming for 66500.
Going short at 66000-66500, stop loss at 67000, target at 65000 aiming for 64500.
Ethereum
Families, the current price of Ethereum is 1924. From the chart, it has just experienced a repair after a wave of decline. It is now oscillating between several moving averages. It previously dropped to around 1840 and held there; now it has rebounded to the 1920-1930 range, and one can clearly feel both sides in a tug-of-war. The EMA moving average system indicates that the short-term and medium-term are almost glued together, with the long-term providing underlying support, indicating that the medium-to-long-term trend remains bullish, but the short term lacks momentum. The MACD indicator's DIF and DEA show a weak golden cross above the zero axis with insufficient upward momentum, and the Bollinger Bands are clearly contracted. The middle track at 1918 is a key support, while the upper track at 1925 forms immediate pressure. The price is operating within a narrow channel, suggesting an imminent change in trend. Overall, the market is in a state of accumulation, awaiting a breakout signal.
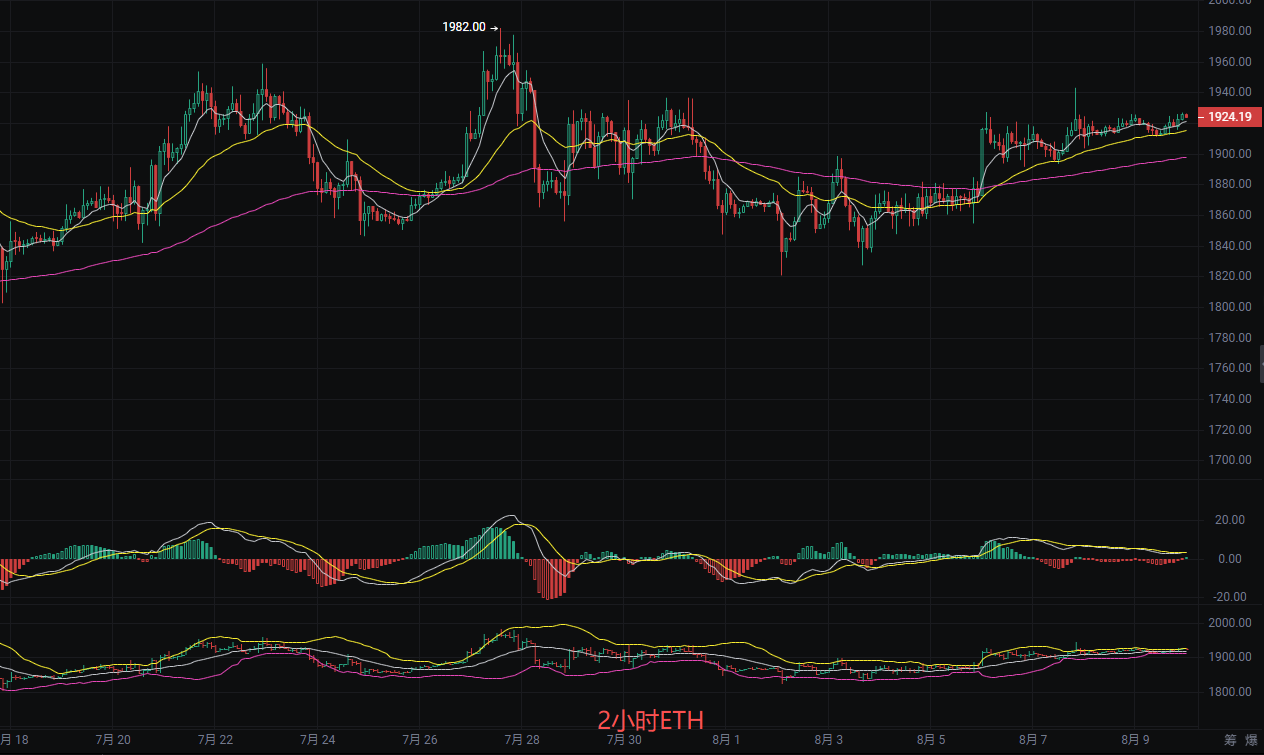
Short-term reference points:
Going long at 1850, with a defense at 1830, stop loss at 1800, target at 1960 aiming for 2000.
Going short at 1980, with a defense at 2010, stop loss at 2040, target at 1920 aiming for 1890.
The above content is exclusively original by Li Ying. Please indicate the source when reprinting! Article publication review may be delayed; the market changes rapidly. The above suggestions are for reference only, and risks are to be borne by the individual.

Warm reminder: The above content is solely created by the author on Weibo. Ads at the end of the article and in the comment sections are unrelated to the author. Please exercise caution in distinguishing them. Thank you for reading.
免责声明:本文章仅代表作者个人观点,不代表本平台的立场和观点。本文章仅供信息分享,不构成对任何人的任何投资建议。用户与作者之间的任何争议,与本平台无关。如网页中刊载的文章或图片涉及侵权,请提供相关的权利证明和身份证明发送邮件到support@aicoin.com,本平台相关工作人员将会进行核查。