Ethereum ETH 4-hour market analysis
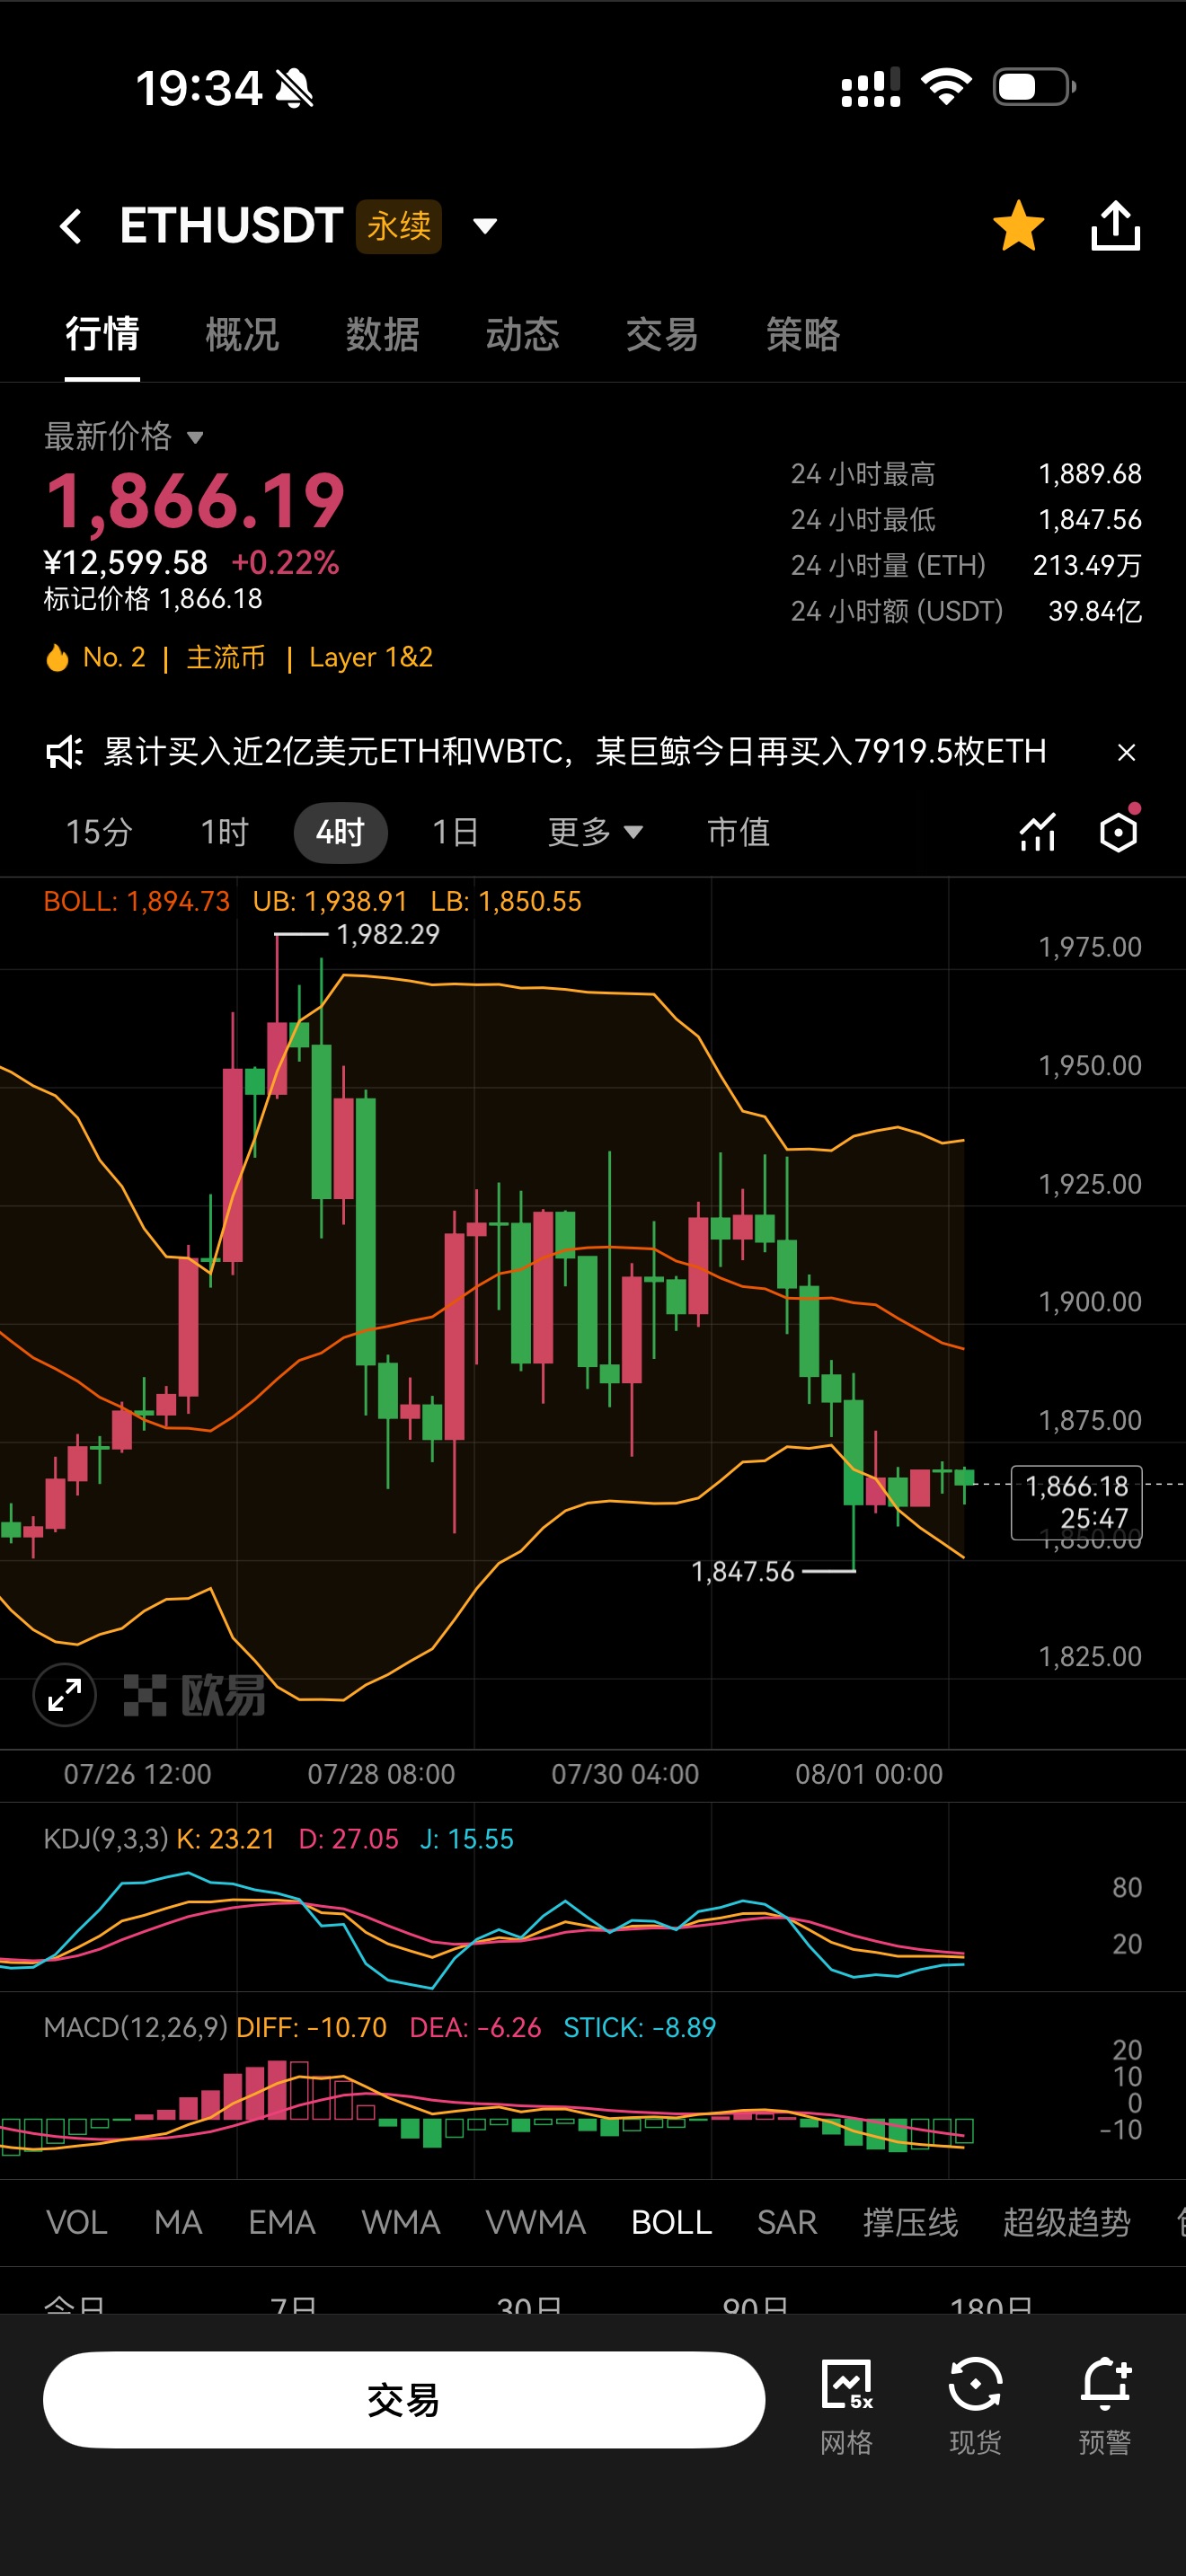
The current price of ETH at the 4-hour level is running in the lower Bollinger Band area, with the trend rhythm highly correlated to BTC, consistent with the previously anticipated market structure.
After a continuous round of decline, the price has retraced to the lower Bollinger Band support near 1850, testing a low of 1847 before starting to stabilize and oscillate. The current price of 1866 is hovering in the support area, and the market has now entered a bullish layout zone, where one can gradually accumulate long positions around 1860.
From the K-line structure, after a continuous drop, bearish momentum has been consistently released, with the lower band forming a critical support defense line. In the short term, the first level of pressure is around the middle Bollinger Band at 1900; the price must effectively stabilize above the middle band to further test the upper band resistance at 1930.
If the lower Bollinger Band support is effectively broken, the current support structure will be disrupted, and the market will continue with a new round of decline.
The current position is not suitable for blindly chasing short positions, as the downward space continues to shrink. Relying on the lower band support to capitalize on rebound opportunities is more cost-effective; participate in the process with gradual accumulation, strictly plan positions, and patiently wait for the price to repair upwards.
The BTC 4-hour market is clearly visible, with the current price operating near the lower Bollinger Band, fully aligning with the structural projections we have been continuously tracking.
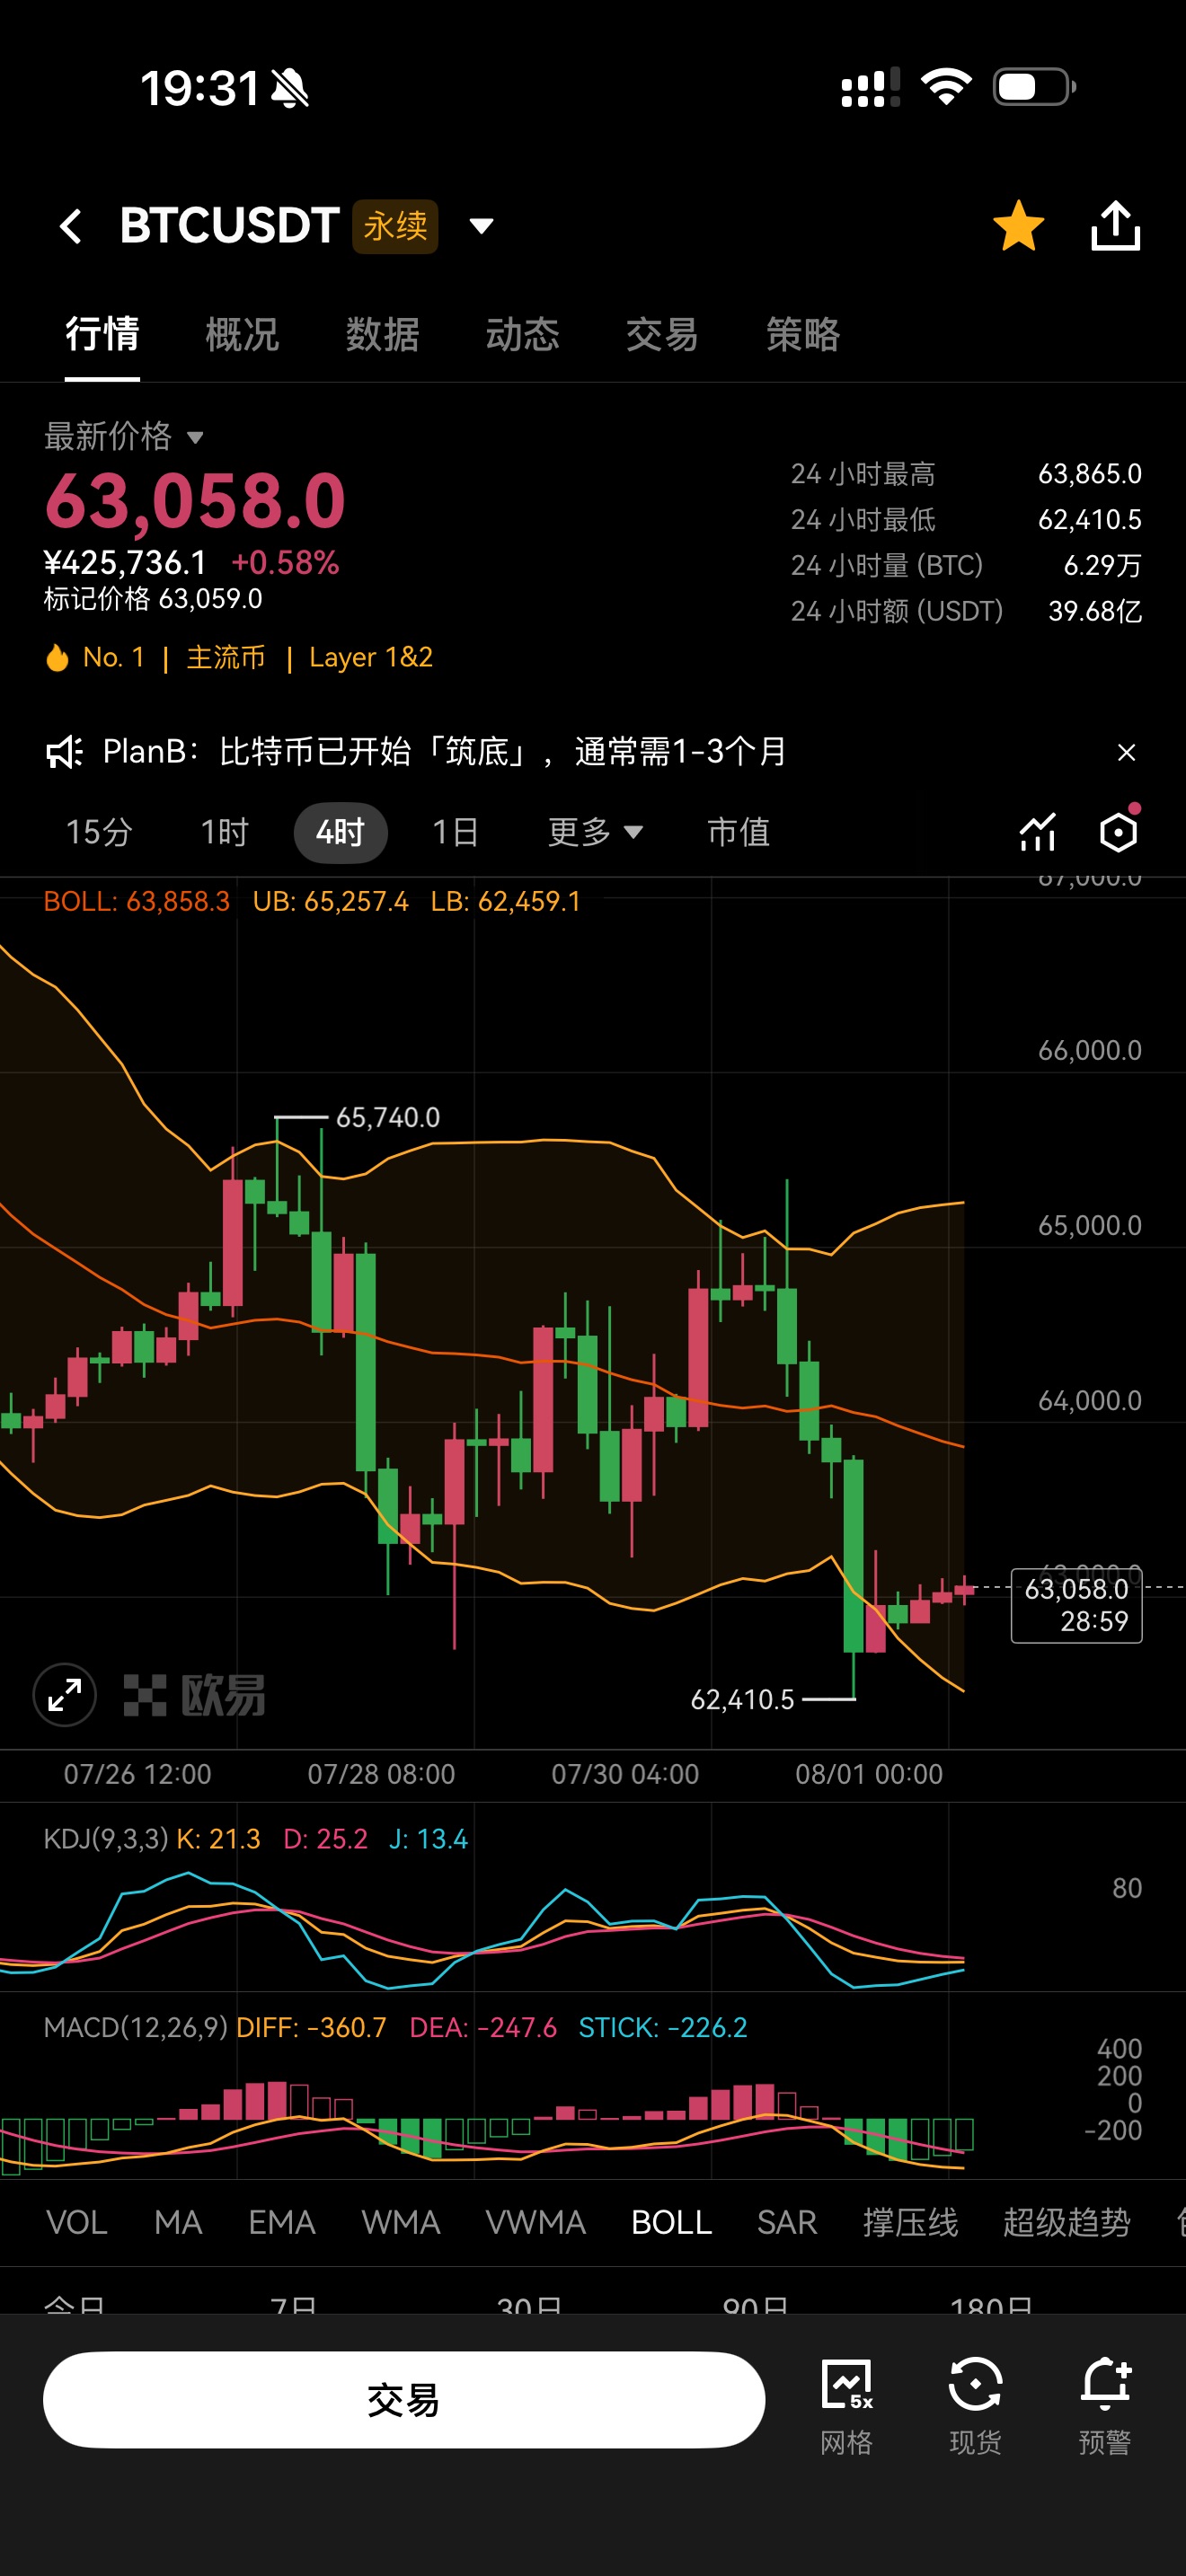
After a previous continuous decline, the price has reached the lower band support area at around 62450 and has initiated a stabilization. The current price at 63058 continues to oscillate within the lower band region; this position represents a favorable short-term long accumulation zone, and one can accumulate long positions in the range around 63000.
From the K-line pattern, after a sustained decline, bearish momentum is gradually released, with the lower band having a strong supporting role. The primary short-term pressure is at the middle Bollinger Band around 64000; if bulls can stabilize above the middle band, further upward testing of the upper band at 65000 will occur. Conversely, if the support below is lost, the price will open up a new round of downward space.
At this stage, do not blindly chase short positions; the downward space has gradually compressed, making the support area more reasonable for bullish speculation. Rely on key support for gradual participation, plan positions carefully, and patiently wait for market repair and rebound.
Public account —— Bitcoin Bear X
(Note: 📣 Due to the timeliness and depth limitations of information on open platforms, the market changes rapidly. Key turning points, precise operational strategies, sudden risk alerts, and other content need to be synchronized immediately on the public account. Here you can obtain: real-time strategy push, in-depth analysis support, interactive Q&A, risk warnings, and optimization suggestions for personal positions. 🚨 Remember: The market always rewards those who act faster and provide more accurate information! Be a winner in the minority.)

免责声明:本文章仅代表作者个人观点,不代表本平台的立场和观点。本文章仅供信息分享,不构成对任何人的任何投资建议。用户与作者之间的任何争议,与本平台无关。如网页中刊载的文章或图片涉及侵权,请提供相关的权利证明和身份证明发送邮件到support@aicoin.com,本平台相关工作人员将会进行核查。