Can you really read support and resistance levels?

CN
1 hour ago

In the eyes of seasoned investors, support and resistance levels are the "eyes" of investors. Whether seasoned technical analysts or newcomers, almost all strategies revolve around these two core concepts.

However, ideals are plentiful, but reality is stark. Have you ever encountered these troubles:

- Drawing lines based on feelings: On the same chart, ten people can draw ten different support and resistance lines; which one is actually effective?
- Difficult to distinguish between real and false breakouts: Seeing a breakout above the resistance level and jumping in, only to find it was a false breakout and you get trapped; seeing a breakdown below the support level and stopping out, only to see a big V reversal afterward.
- Information overload: Candlestick patterns, moving averages, Bollinger Bands, trading volume... too many indicators, it makes your head spin; where exactly are the key points?

If you have these questions, then you might need to reassess: Can you really identify support and resistance levels?

To solve these pain points for traders, AiCoin's "Ace Intelligent Analysis" feature will be your "AI trading assistant" equipped with deep logical reasoning capabilities.

1. Ace Intelligent Analysis: Rejecting Blindness, Returning to Logic

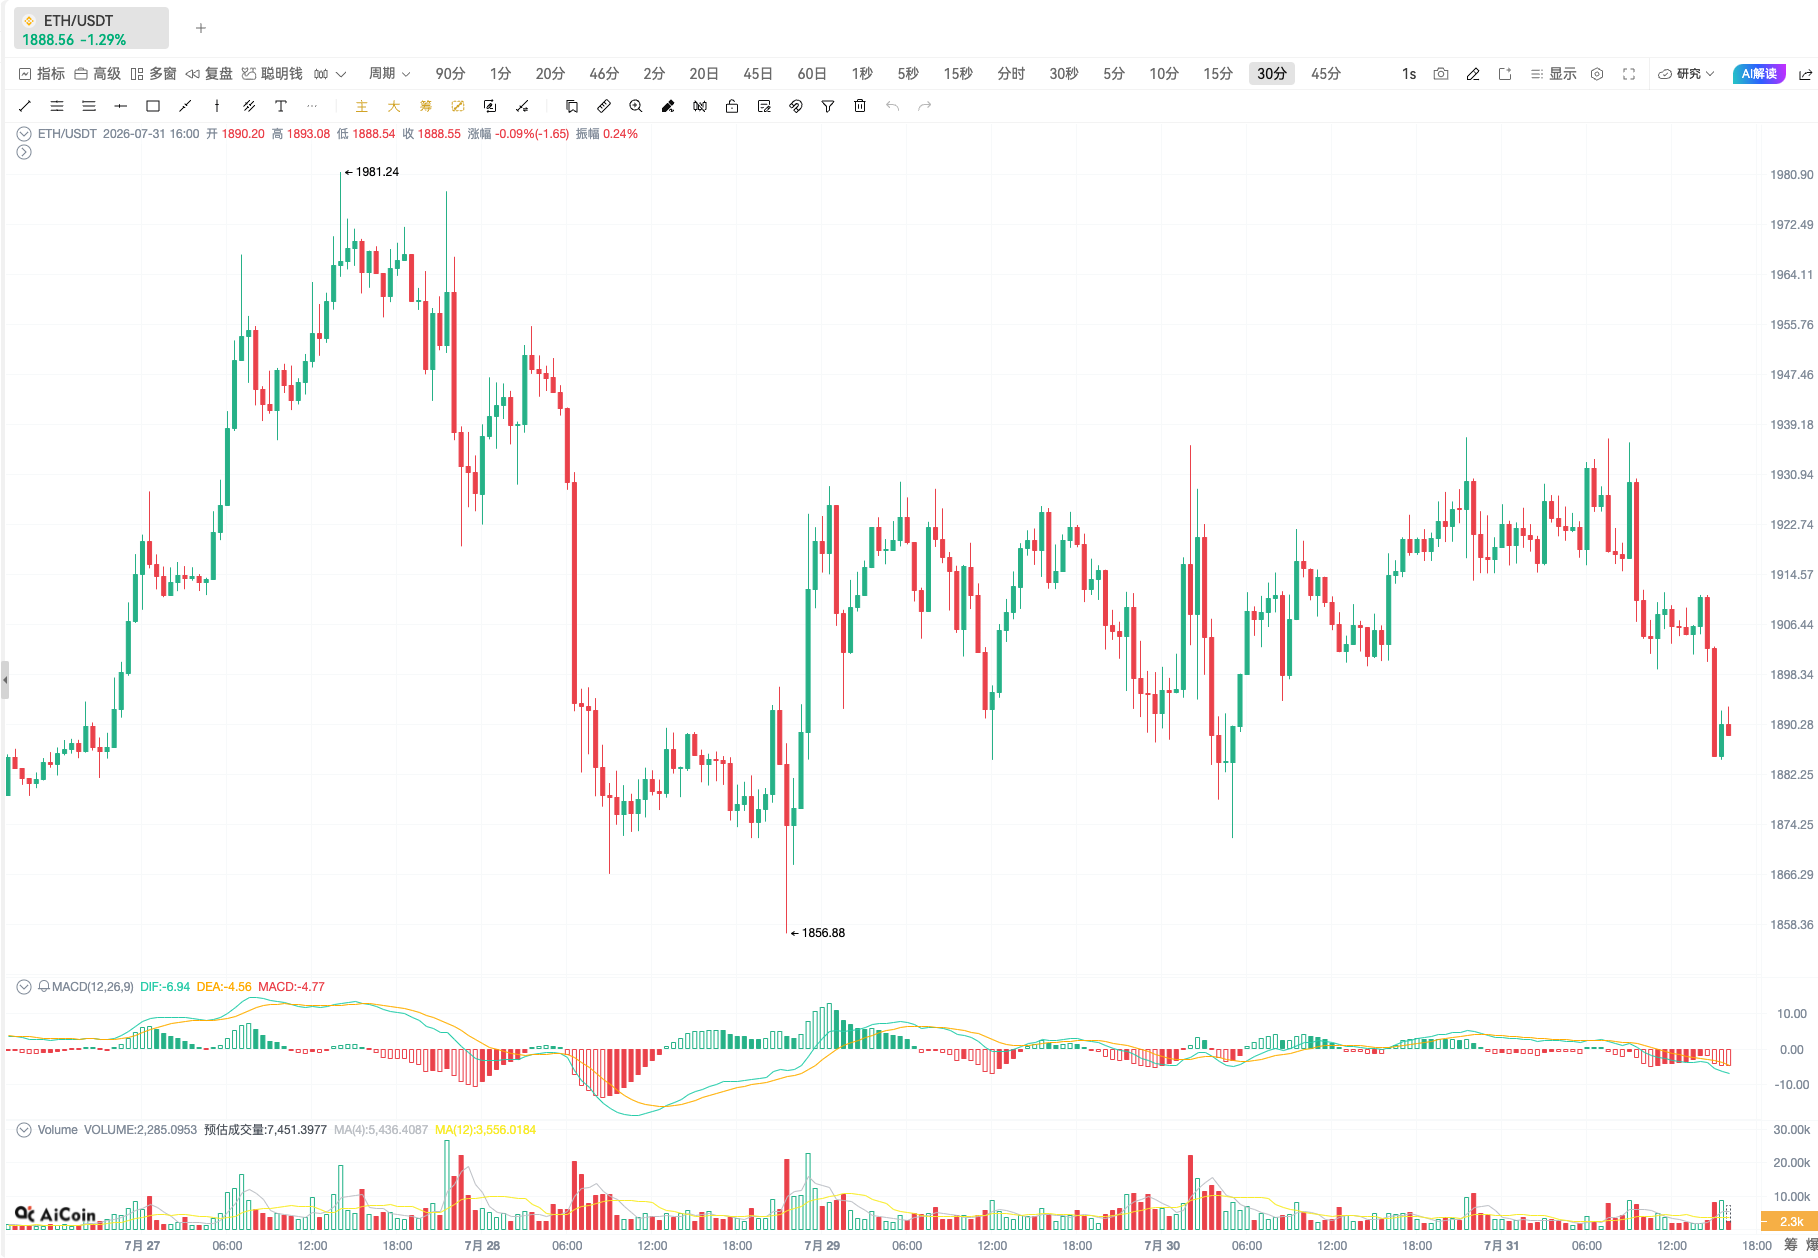
Traditional automated tools often mechanically look for historical highs and lows, while Ace Intelligent Analysis employs multi-dimensional fusion algorithms. It can scan the market in real-time, combining candlestick patterns, moving average systems, Bollinger Bands, momentum indicators (RSI/MACD), and trading volume changes to provide a report with rigorous logical support.

Can you really identify support and resistance levels?_aicoin_image1

Using a recent ETH market analysis as an example, let's see how Ace "reads" the market:

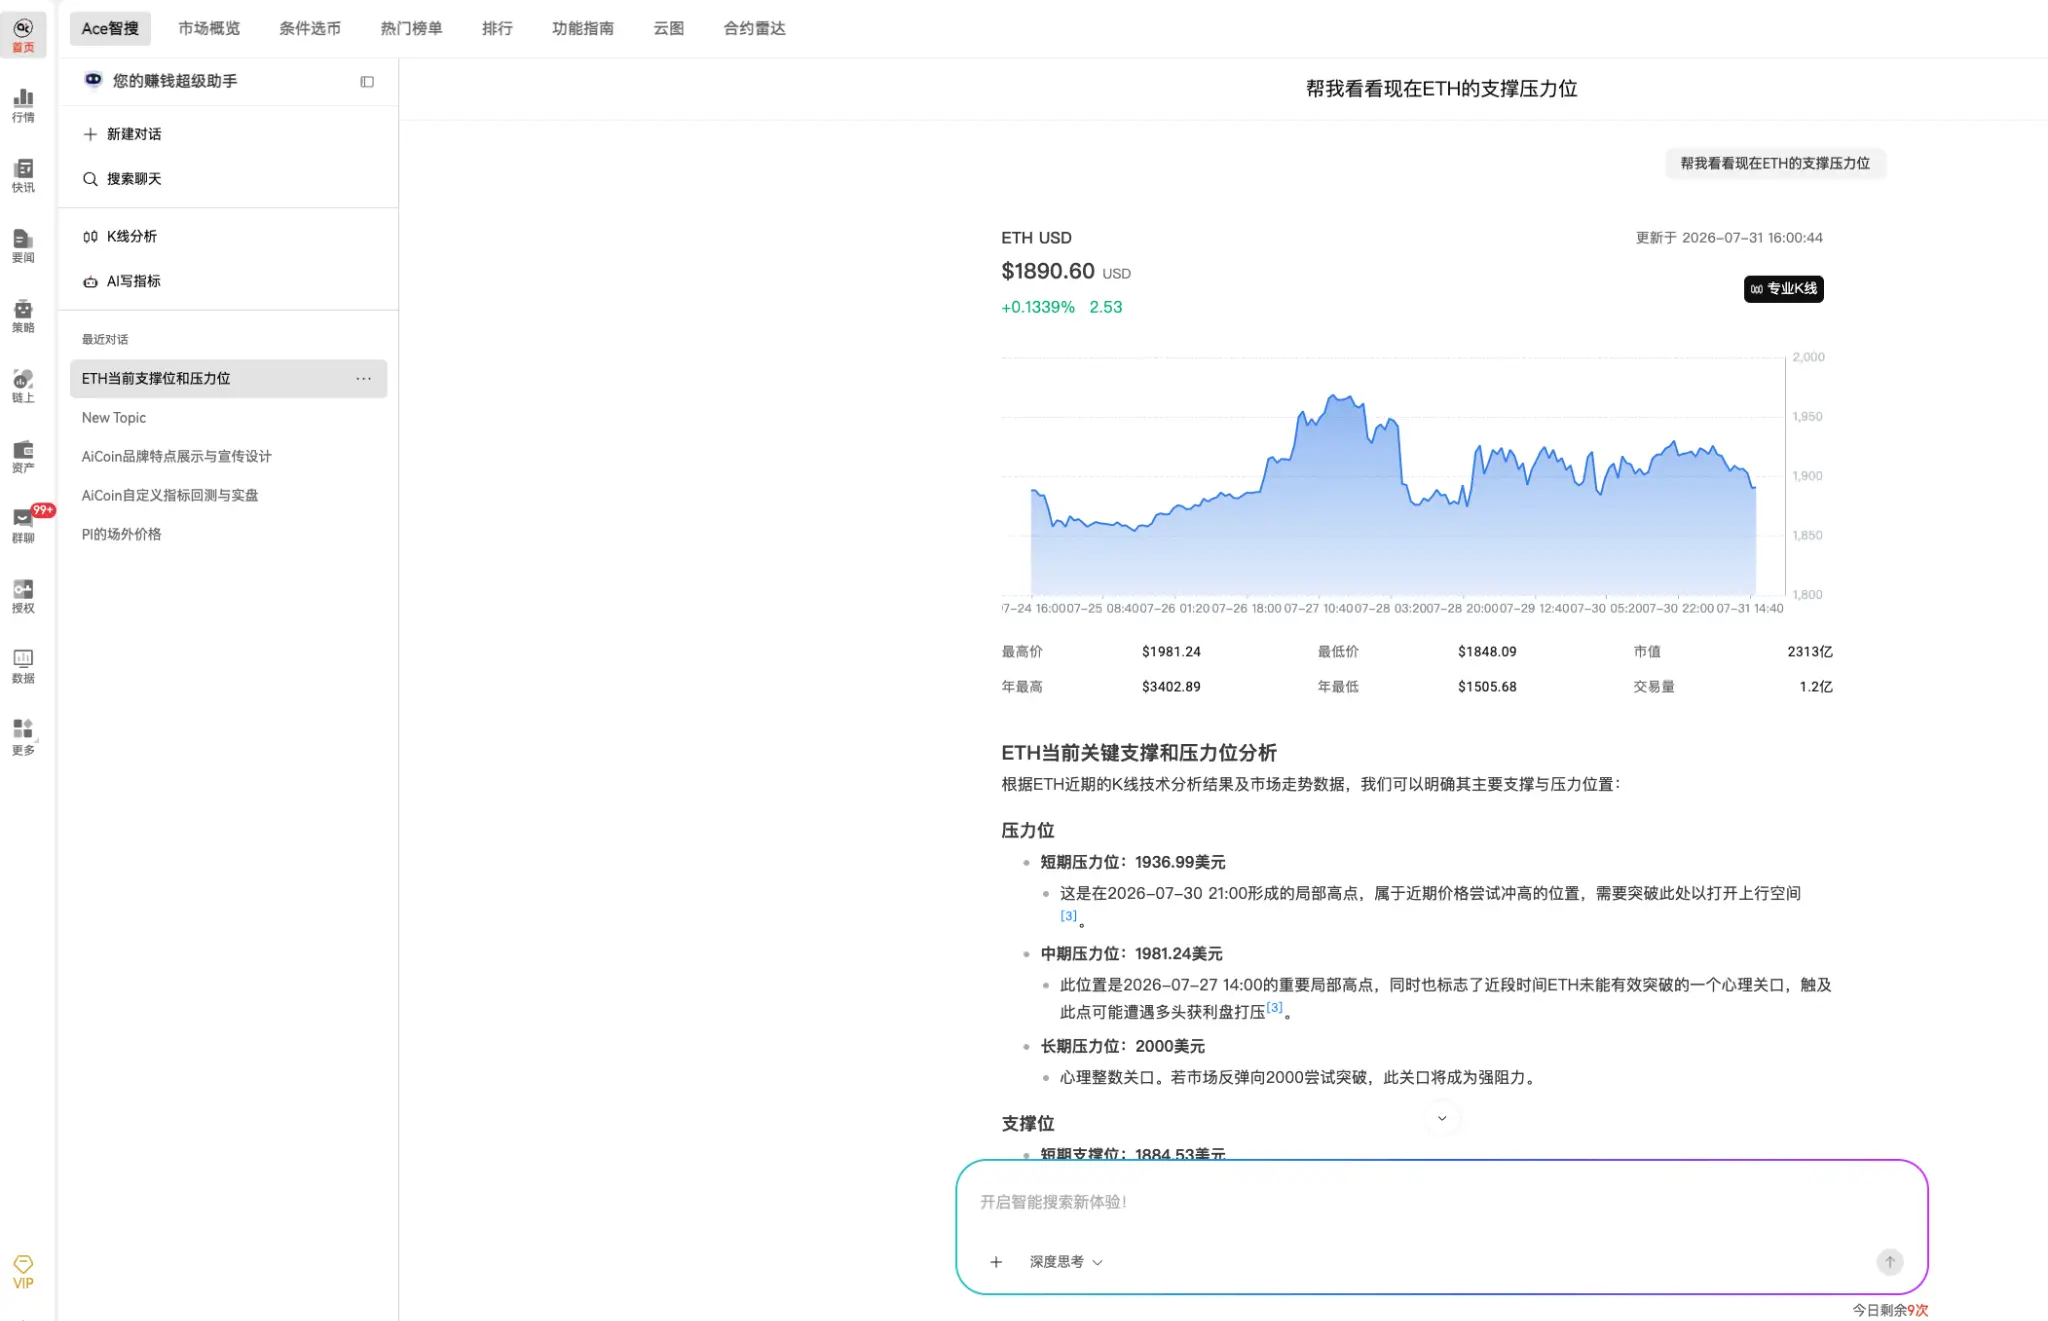
1. Clear Level Division

Ace will not give you a vague range; instead, it divides support and resistance into short-term, medium-term, and long-term dimensions based on strength.

ETH Key Resistance Level Analysis Example:

- Short-term resistance level (1936.99 USDT): Originating from a local high point, this is the primary barrier for recent highs.
- Medium-term resistance level (1981.24 USDT): A historically important high point, marking a dense area of profits for bulls.
- Long-term resistance level (2000.00 USDT): A key psychological integer barrier, a strong resistance area.

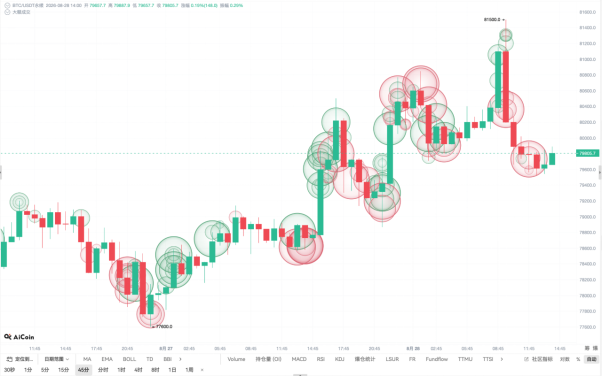
Can you really identify support and resistance levels?_aicoin_image2

Can you really identify support and resistance levels?_aicoin_image3

(Function path: PC client - Home - Ace Intelligent Search)

2. Rational and Evidence-based "Why"

This is the core value of Ace. It not only tells you "how much," but also "why."

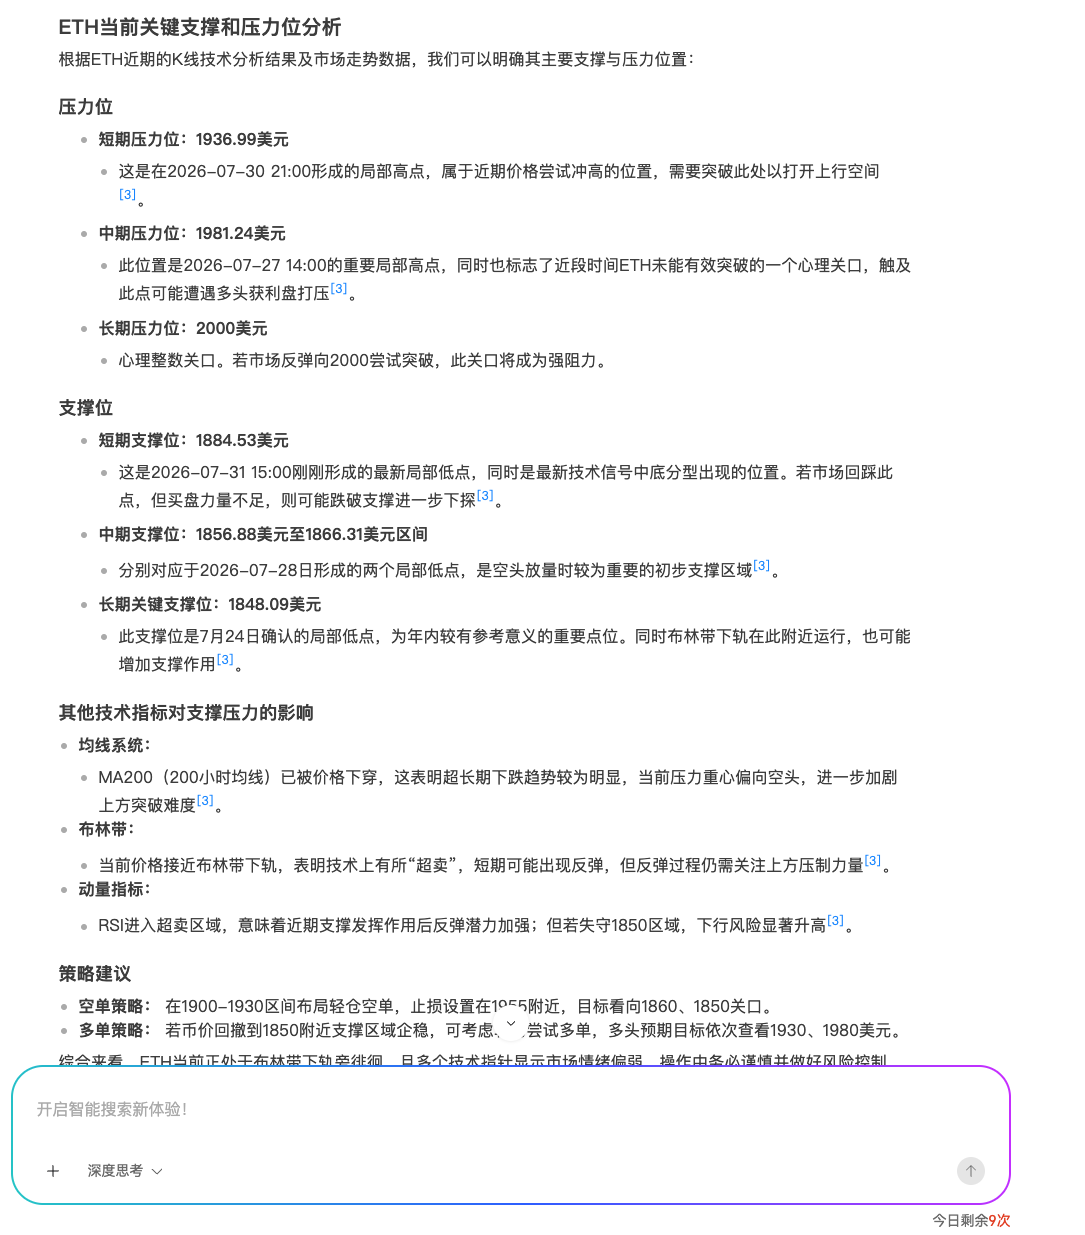
For example, when analyzing support levels, Ace will point out:

"1884.53 USDT is where the latest technical signal's bottom formation appears. If the market pulls back to this point but buying is insufficient, it may further decline."

This combination of bottom formations, lower Bollinger Bands, MA200, and other indicators makes every line "rational and evidence-based," helping traders feel more confident in their decision-making.

Can you really identify support and resistance levels?_aicoin_image4​​​​​​​

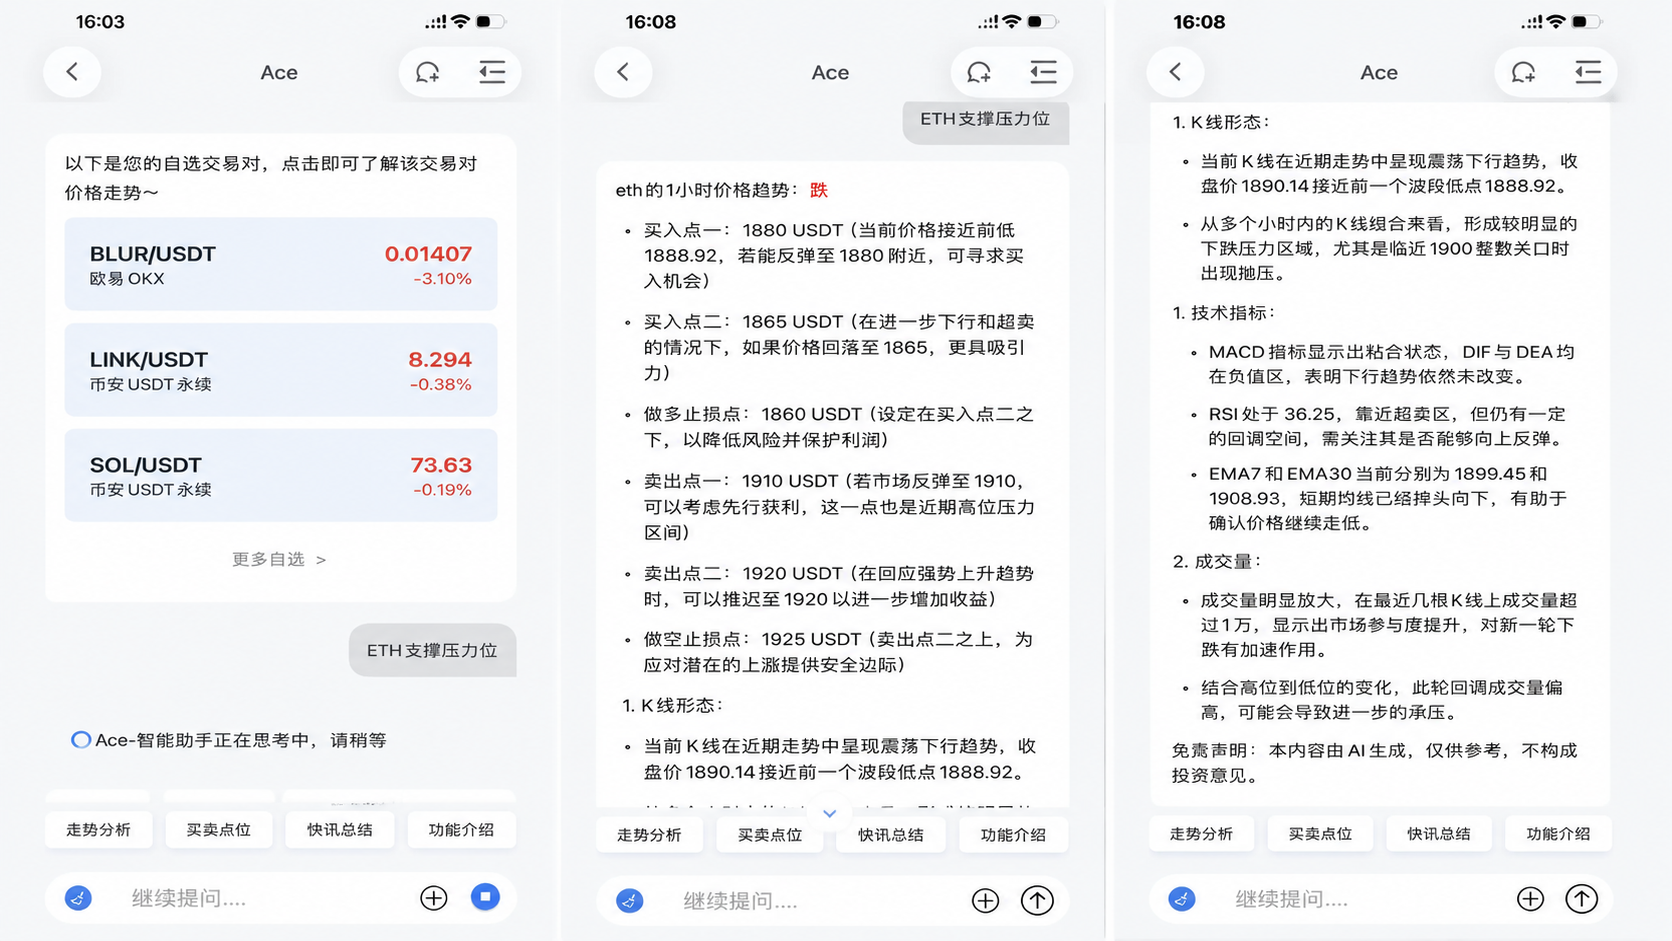
(Function path: APP client - Home - Ace Intelligent Analysis)

2. Practical Demonstration: The Closed Loop from Analysis to Strategy

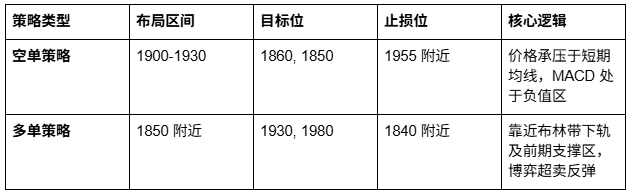
Analysis alone is not enough; trading ultimately needs to be put into practice. Ace Intelligent Analysis directly generates dual strategy suggestions for short and long positions.

Can you really identify support and resistance levels?_aicoin_image5
This "Analysis -> Level -> Strategy" one-stop service greatly shortens the decision-making path for traders, especially for users who do not have time to watch the market closely or tend to make emotional trades; Ace acts as a calm co-pilot.

3. Full Coverage on Mobile and PC: Anytime, Anywhere, AI Assistance

Whether you are used to deeply researching in front of a computer or checking the market on your phone anytime and anywhere, AiCoin provides an exceptional experience.

- PC side: Supports one-click screenshot of the current candlestick chart to send to Ace. It can recognize your personally set periods and indicators, providing the most tailored recommendations for your trading system.
- APP side: On the candlestick page, click the upper right corner "Little A" avatar to quickly summon intelligent dialogue and generate market summaries in seconds.

Conclusion

Support and resistance levels are not dead lines but battlefields where bulls and bears contend. The significance of AiCoin Ace Intelligent Analysis lies in utilizing the objectivity and efficiency of AI to help us navigate the market's fog and identify the key nodes on the battlefield.

Open AiCoin now, input the cryptocurrency you are interested in, and let Ace help you see where the current support and resistance levels are!

免责声明:本文章仅代表作者个人观点,不代表本平台的立场和观点。本文章仅供信息分享,不构成对任何人的任何投资建议。用户与作者之间的任何争议,与本平台无关。如网页中刊载的文章或图片涉及侵权,请提供相关的权利证明和身份证明发送邮件到support@aicoin.com,本平台相关工作人员将会进行核查。

Share To
APP

X

Telegram

Facebook

Reddit

CopyLink