Cryptocurrency Scholar: Ethereum (ETH) faces resistance in the rebound at 7.30, beware of a second retest of key support? Latest market analysis reference
The current price of Ethereum is 1920. Many people always think about seizing every wave of short-term profits, ignoring the fact that there is no unilateral trend in the current market. At present, ETH is stuck around 1921 with frequent back-and-forth movement, clear support below, and pressure above. Blindly chasing positions will only continue to consume the principal. In trading, it is essential to understand the cycle structure and not let short-term candlestick fluctuations disturb your judgment. In a fluctuating market, the principle is to sell high and buy low, while in a unilateral trend, you hold with the trend. Distinguishing the current market environment is key to avoiding most unnecessary losses.
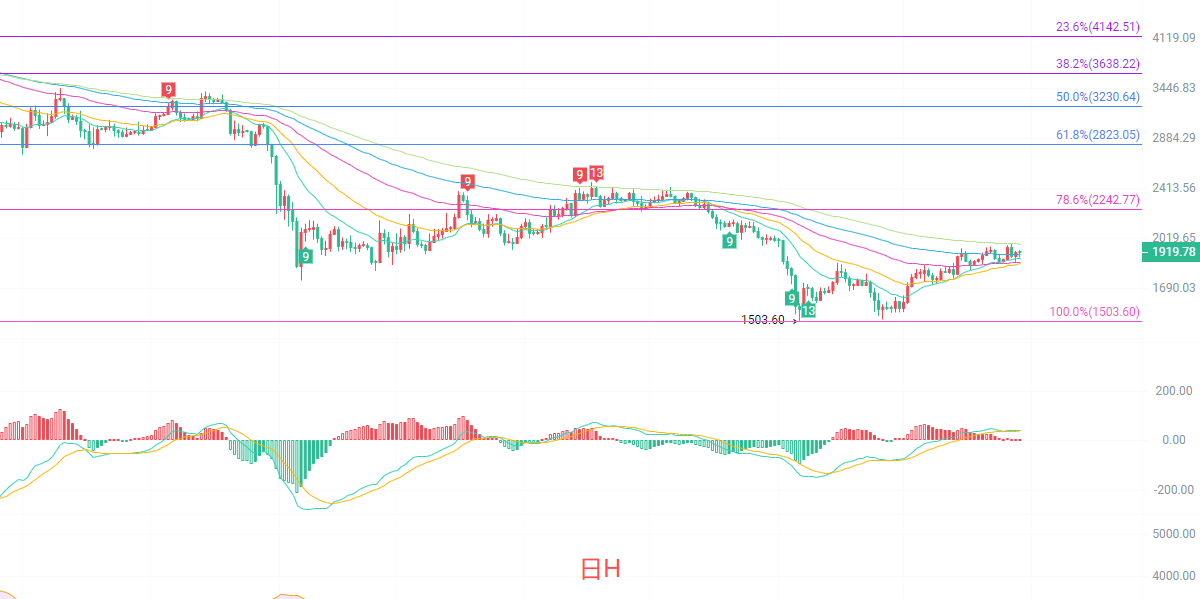
The daily candlestick is currently running above the EMA15, with short-term moving averages forming support. The Bollinger Bands are in a contracting state, with market fluctuations gradually narrowing. The MACD indicator's DIF is solidly above the zero axis, with the strength of the red bars slowing down, indicating a decrease in bullish momentum. The key resistance above is at the 1974 Bollinger upper band, with further pressure at 2242; the primary support below is at 1773 Bollinger lower band. The overall daily line belongs to the repair rebound phase after a decline, and has not shown a clear reversal into a bullish trend. The rebound height is limited, and it is highly likely to maintain a range-bound fluctuating pattern.
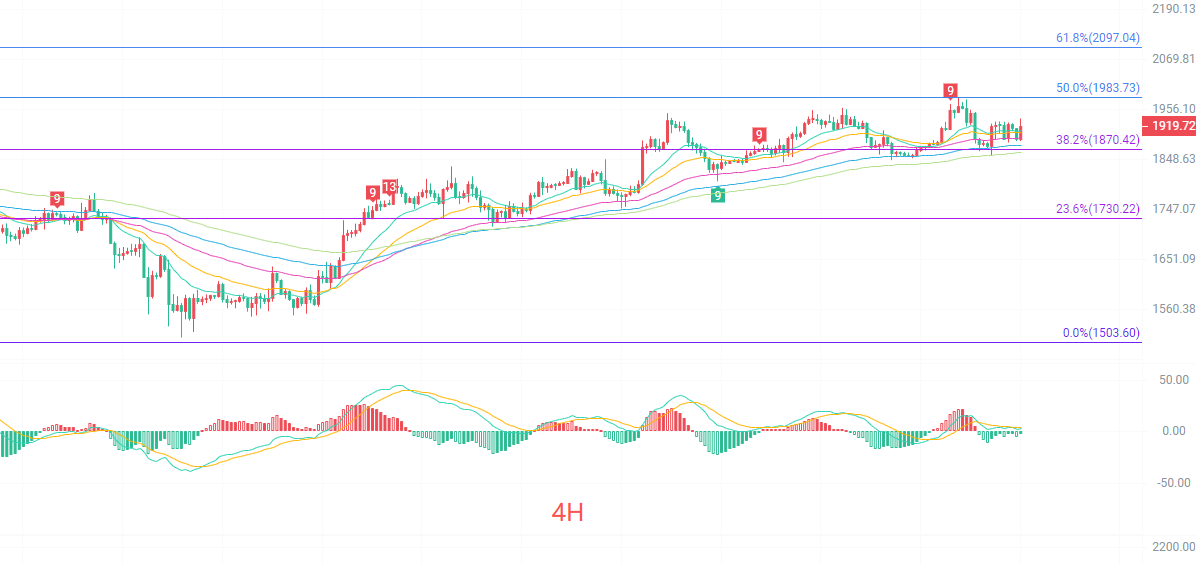
The four-hour candlestick is currently fluctuating above the Fibonacci 38.2% position at 1870. The short-term EMA moving averages are intertwined, indicating a balance between bullish and bearish forces. The 4-hour MACD has formed a death cross, with indicators slightly moving downwards, signaling a continuous weakening of bullish momentum. The Bollinger Band channel is flattening, trapping the market within the 1865-1970 range. For the short-term bulls to break through, they must stabilize above 1970; if continuously pressured, it will retest the lower edge of the range support. In the short term, the focus is primarily on range fluctuations.
Short-term reference:
If the price does not break below 1880 to 1840, aim upwards, with a stop loss at 1800, targeting 1950 to 1980.
If the price does not break below 1980 to 2020, aim downwards, with a stop loss at 2050, targeting 1930 to 1890.
Specific operations should focus on real-time market data. For more information and details, you can consult the author. The article has publication delays, and suggestions are for reference only; risk is to be borne by oneself.

Warm reminder: The above content is only created by the author on the public account. The advertisements at the end of the article and in the comments section are unrelated to the author. Please be cautious in distinguishing them. Thank you for reading.
免责声明:本文章仅代表作者个人观点,不代表本平台的立场和观点。本文章仅供信息分享,不构成对任何人的任何投资建议。用户与作者之间的任何争议,与本平台无关。如网页中刊载的文章或图片涉及侵权,请提供相关的权利证明和身份证明发送邮件到support@aicoin.com,本平台相关工作人员将会进行核查。


