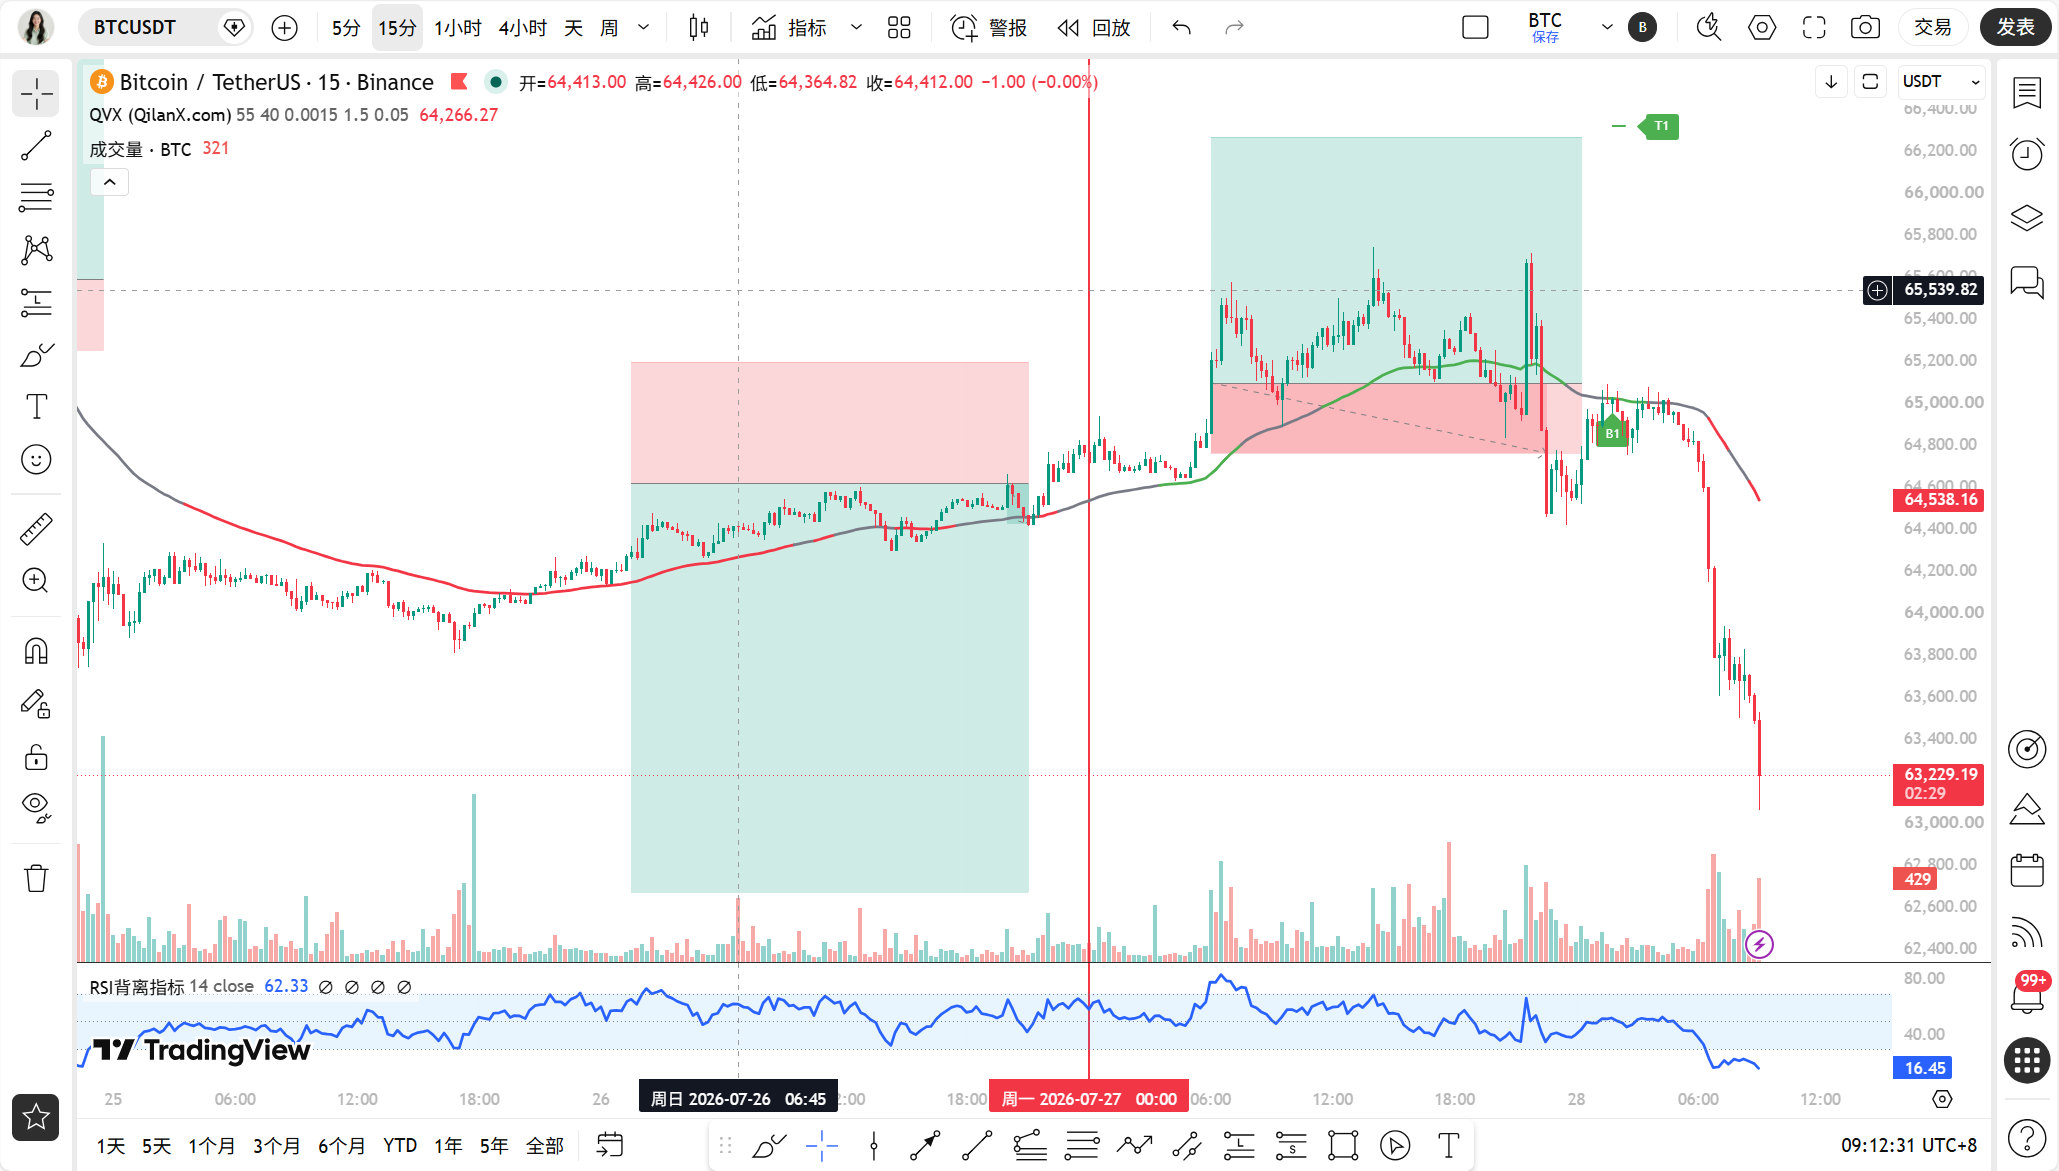
Good morning, teammates, I'm Qinglan. This morning when I opened the market, I felt a bit heavy-hearted. The Asia-Pacific market opened with a bang, with the Nikkei 225 index plunging by 4%, Kioxia down 18%, and panic spreading to the crypto market like a domino effect. At the same time, Castle Securities released news that the Federal Reserve might unexpectedly raise interest rates by 25 basis points this week, which directly suppressed the rebound potential of risk assets. With dual negative factors at play, BTC is currently under obvious pressure, having dropped to $63,225. In this environment, many people are asking if it is about to collapse? Don't worry, Qinglan will guide you to break down the data; opportunities are often hidden in panic.
Current Price and Time
The current time is July 28, 09:13, and the latest quote for BTC is 63,225 USDT. The drop in the last 24 hours is 3.05%, and the fear and greed index has fallen to 29, indicating that the market is in extreme fear. But remember, when there is fear, it is often also a time for opportunities to brew.
Multi-Cycle Status Overview
First, let's look at the daily chart. The daily MA5 is at 64,179, MA10 is at 64,864, MA30 is at 63,596, with the price at 63,225 having broken below all short-term moving averages. The MACD histogram is at -120.31, and the RSI is only at 40.92, overall indicating a bearish pattern. But note that the daily MA30 is around 63,596, which is a medium-term support level. If the price can hold this level, there is hope for a rebound.
The 4-hour level is clearer. The 4-hour MA5 is at 64,323, MA10 is at 64,698, and MA30 is at 64,664, with prices running all below these moving averages. The MACD histogram is -96.38, still expanding, and the RSI is at 37.33, indicating a weak area. There has been no significant stop-loss signal on the 4-hour chart, and the bearish momentum is still being released.
The 1-hour level is the focus for today. The 1-hour MA5 is at 63,816, MA10 is at 64,382, and MA30 is at 64,891, with the price at 63,225 far below these moving averages. The MACD histogram is -209.03, although still negative, pay attention to whether the current histogram has shortened compared to the previous one? From the data, the previous MACD histogram was -209.03, and the one before that was around -209, showing little change, thus no significant exhaustion. The RSI is at 21.42, already indicating an oversold area, but oversold does not mean an immediate rebound; waiting for signals is necessary.
The 15-minute level is more extreme. The 15-minute RSI is only 9.41, indicating extreme overselling. The MACD histogram is -84.38, still negative, but showing slight shortening compared to the previous one, which is a weak exhaustion signal. The 15-minute MA5 is at 63,541, MA10 is at 63,662, and the price of 63,225 is still distanced from the short-term moving averages, indicating that a rebound has not yet started.
TPV Signal Validation
Now let's use the Qinglan TPV system to validate. The 1-hour EMA55 is at 64,639, and the current price is 63,225, far below EMA55. According to the rules, the price is below EMA55, indicating a bearish trend area.
Short-selling conditions: First, is the price under pressure below the 1-hour EMA55, with two consecutive 1-hour candlesticks closing below EMA55? From the data, the last few candlesticks have closed between 63,200 and 63,500, far below 64,639, meeting the condition. Second, is there a resistance encounter pattern? Currently, there are no obvious long upper shadows or top divisions, but the price continues to fall, indicating an effective high point retreat. Third, is there weakness in the rebound? Is the MACD histogram shortening for two consecutive periods? As mentioned, the MACD histogram has not changed much, showing no obvious shortening, with RSI at 21.42 below 70, but there was also no process of falling back from 70. Therefore, short-selling conditions are not fully met; bearish momentum is still present, but the exhaustion signal is not clear.
Long-buying conditions: First, is the price stable above the 1-hour EMA55? Not met, the price is far below EMA55. Second, is there support stabilization? The 15-minute RSI at 9.41 shows extreme overselling, indicating potential support, but a long lower shadow or bottom division is needed for confirmation. Third, is the downside momentum exhausted? The 15-minute MACD histogram has slight shortening, but the 1-hour shows no obvious exhaustion. Therefore, long-buying conditions are also not met.
Oscillation Judgment Auxiliary Data: Among the last eight 1-hour candlesticks, the number of times the closing price was above EMA55 was four, with one crossing occurrence, and the price distance from EMA55 is 2.19%. This distance exceeds 0.3%, which does not meet the oscillation threshold; the market is currently in a unilateral trend, with the direction being bearish.
On-Chain/Funding Situation
In terms of on-chain data, the fear and greed index is at 29, indicating extreme fear. BTC's market share is 56.4%, indicating that funds are still concentrating on BTC, while altcoins are faring worse. BlackRock ETF wallets have transferred $271 million worth of BTC and ETH to Coinbase, which may indicate potential selling pressure. On the other hand, Arthur Hayes continues to buy ETH, and Brazilian listed companies are increasing their BTC holdings, indicating that long-term funds are still positioning. Short-term sentiment and long-term funds are in a tug of war, with significant market divergence.
Key Offensive and Defensive Levels
The first resistance level above is at the 1-hour EMA55 of 64,639, which is a dividing line between bulls and bears. If the price can rebound to this level and stabilize, the bearish trend may reverse. The second resistance level is at the 1-hour MA30 of 64,891, which is a stronger resistance.
The first support level below is at the daily MA30 of 63,596, which is a medium-term support. If broken, the next support would be at the 62,000 integer level, a previous low point area. Further down is the psychological barrier of 60,000.
Trading Thoughts
The current market is in a bearish trend, but the 15-minute RSI is extremely oversold, indicating a short-term rebound demand. Qinglan recommends not to chase short positions but to look for short-sell opportunities after a rebound.
Direction: Focus on short selling, but wait for a rebound.
Entry Conditions: Wait for the price to rebound to near 1-hour EMA55 of 64,639, and then observe for a long upper shadow or top division, while the MACD histogram shortens from a high position and RSI falls back from above 70, before entering after meeting short-selling conditions.
Stop Loss: Set above 65,000, if the price breaks above the 1-hour MA30 of 64,891 and stabilizes, it indicates strong rebound momentum, and short positions need to stop loss.
Target Levels: First target 63,500, second target 62,000, and if it breaks below 62,000, you can look at 60,000.
If the price directly breaks below the 63,596 daily MA30 support, you can lightly short, but must set up stop loss to prevent false breaks.
Risk Warning
The current market is highly volatile, with concentrated negative news; any rebound may be interrupted by sudden news, so be sure to control positions and set strict stop losses.
Follow Qinglan's crypto class to seize more trading opportunities! Welcome to visit the official website www.qinglan.org
📊 Qinglan TPV Trading Strategy Backtest Reference
🕒 Last Backtest Time 07-28 07:00:01
Total Analysis: 3258 Backtests: 2468 Accuracy Rate: 77.7% (1917/2468)
免责声明:本文章仅代表作者个人观点,不代表本平台的立场和观点。本文章仅供信息分享,不构成对任何人的任何投资建议。用户与作者之间的任何争议,与本平台无关。如网页中刊载的文章或图片涉及侵权,请提供相关的权利证明和身份证明发送邮件到support@aicoin.com,本平台相关工作人员将会进行核查。


