Core Conclusions
June was a public dismantling of faith as well as a textbook-level rehearsal of bottom building. In May, we recorded "failure of liquidity transmission," and in June the market answered the next question: what comes after the failure of transmission—internal clearing fell from "distribution" into "surrender," the strongest narrative of the cycle ("never selling" corporate treasury) completed its self-denial, and the macro environment deteriorated from "good news not rising" to "substantial tightening" landing; yet at the same time, it was a month where long-term holders returned to net buying after several months, and strong players silently accumulated in the depths of panic.
In terms of price, BTC reported $73,764 at the beginning of the month and closed around $59,624 at the end, falling about 19.2% over the month; the two key lows during the month—$59,130 on June 5 and $58,201 at the end of the month—retraced from the cycle high of $126,000 on October 12, 2025 to -54%, formally "halved." ETH dropped from $2,007 to $1,572, falling about 22% throughout the month, with a low of $1,505.
Three main lines defined June:
First, the public rupture of the institutional buying paradigm. Strategy broke the "never selling" commitment at the beginning of the month with its first reduction of 32 BTC, mid-month mNAV fell to 1.02, the equity and credit financing dual channels shut down, and at the end of the month officially announced the "Digital Credit Capital Framework," with the board authorizing up to $1.25 billion in BTC monetization—"selling coins to pay interest" turned from tail risk into a systematic reality. The largest price insensitive buyer over the past two years may not only not return in the future but could also reverse supply of about 20,000 BTC.
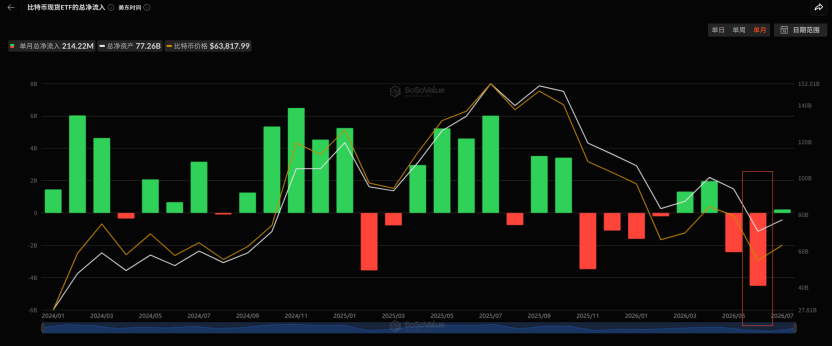
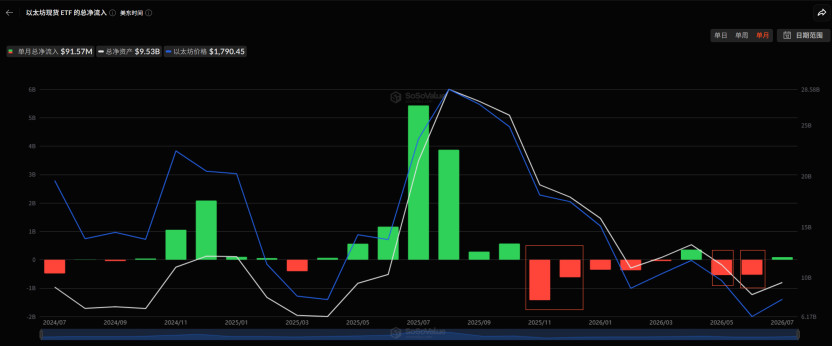
Second, the most brutal single-month outflow in ETF history. BTC spot ETFs saw a net outflow of about $4.51 billion over the month, creating the largest single-month outflow since the product's inception, with continuous outflow for 10 days and a single-day 696 million panic-level redemption; ETH spot ETFs saw a simultaneous outflow of about $529 million. Redemptions showed characteristics of risk aversion across the entire spectrum, compounded by Coinbase's continuous negative premium, with marginal selling pressure in U.S. channels dominating the entire month.
Third, the complete micro-structural evolution from surrender to accumulation. The break on June 24 was a "clean" surrender dominated by spot—selling pressure came from holders, while leverage merely passively amplified; the new monthly low of 57.8K on June 30 was a short trap—spot selling pressure had exhausted, and the final leg down was purely driven by derivatives shorts. This distinction is crucial: surrender-type declines need time to repair sentiment, while trap-type declines only require shorts to recognize their mistakes.
Our qualitative assessment of the entire month: the deep bear market moved from the "mid-stage of clearing" into the "deep water zone of clearing," and at the end of the month completed a preliminary confirmation of "seller exhaustion." Evidence includes three points: panic has been fully released (Ahr999 dropped to the historical "ghost zone" of 0.283, with the total network loss tokens first exceeding profit tokens); strong players returned to net buying (LTH returned to net buying, supply ratio rose to 88.1%, a new high in many years, accumulation showed a broad cross-group characteristic); structural qualitative change at the end of the month (MSTR's negative news landed on the day BTC refused new lows, market makers switched to long gamma between 60-64K).
However, the other side of the calmness is—none of the reversal three axes were established by the end of the month: ETF did not stop bleeding, the dollar did not retreat, and the price did not recover key resistance levels; STH-SOPR is still 0.14 standard deviations away from the severe surrender threshold, and the last volatility spike commonly accompanying historical cycle lows has not yet occurred.
Extreme undervaluation and signs of accumulation define the bottom area, not the specific bottom timing. June completed a preliminary confirmation of seller exhaustion, not a final confirmation; the short trap can explain a tactical rebound, but cannot define a cyclical bottom.
1. Macro: From "When will the interest rate cut come" to "Interest rate hikes priced in"
In May, the market was still debating whether easing expectations could repair the situation; in June, the macro environment directly delivered a negative triple strike.
The first strike, data thoroughly debunking interest rate cuts. On June 2, JOLTS job vacancies hit 7.62 million, a nearly two-year high, exceeding expectations by 750,000, and the 10-year U.S. Treasury yield returned above 4.45%; on June 6, the non-farm data for May reported a "strong performance," immediately extinguishing hopes for rate cuts, with the market immediately factoring in a 25bp hike before December and a 60% probability of a hike in October, triggering a meltdown in U.S. stocks that day (NASDAQ -4.18%, semi-conductor index intraday -10%). On June 11, the May CPI year-on-year was 4.2%, the highest since April 2023. On June 25, core PCE was 3.4%, the highest since October 2023, overall PCE broke above 4% for the first time in three years—sticky inflation was repeatedly pinned down by four heavy data releases.
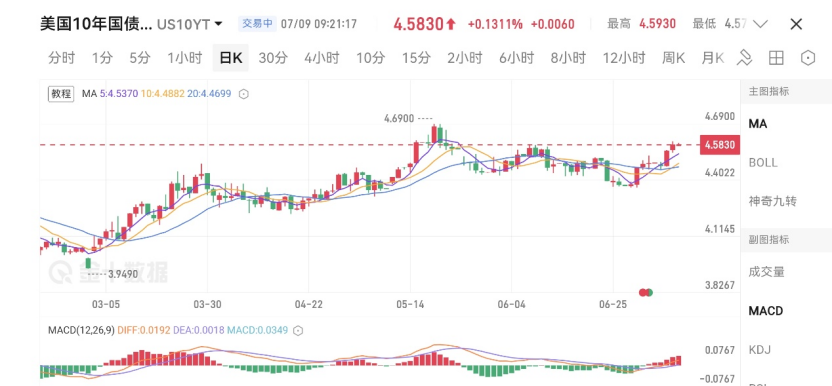
The second strike, FOMC's hawkish dot plot hit hard. On June 18, the Federal Reserve held steady for the fourth consecutive time (3.5%–3.75%), but the SEP completed a systematic revision toward stagflation: the median interest rate for 2026 was raised from 3.4% to 3.8%, PCE forecast was raised to 3.6%, GDP was lowered to 2.2%. New Chair Wash's first press conference established the stance that "persistently high prices are a burden on the public." Market institutions have shifted from rate cut expectations to rate hike expectations.
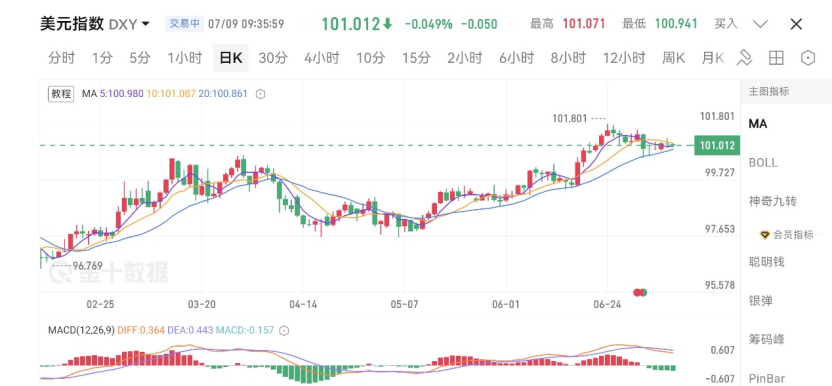
The third strike, the dollar regained dominance. DXY regained the 200-day moving average (101.80 vs 98.72) in late June, marking the first time since the "liberation day" in April. The negative correlation of "strong dollar suppressing crypto" was reestablished after a period of decoupling: the S&P 500 recovered its year-to-date decline and rose above the 200-day moving average, while BTC closed the month at an 18% discount compared to its 200-day moving average ($76,466). The macro recovery is a purely stock story, and BTC did not get a ticket to the party. The Bank of Japan raised rates by 25bp to 1.00% on June 16 (the highest since 1995), but the yen depreciated instead of appreciating, breaking below 162 at the end of the month, marking nearly a 40-year low and laying the groundwork for intervention in global risk assets.
The equity market experienced an extreme roller coaster: at the beginning of the month, the NASDAQ broke 27,000 for the first time, the Nikkei pushed to 70,000, and the KOSPI repeatedly hit new highs with multiple two-way circuit breakers in a single month; on June 6, non-farm data triggered a global chain collapse (KOSPI -8.4% in a single day); by the end of the month, the AI capital expenditure bubble was systematically priced for the first time—on June 23, the semi-conductor index fell 7.87% in a single day, Apple raised prices due to "AI infrastructure costs being passed on to the end" and plunged 6.1% in a single day, and Micron's disastrous earnings report coupled with Korea's trillion-won semiconductor national team investment narrative once again saved the situation. The brutal fact for crypto throughout the month is: there was no spillover during the AI jubilation, but full resonance during the AI crash.
2. Geopolitics: Four-wheel roller coaster, crypto only reacts to bad news
June in the Middle East fully unfolded the cycle of "rupture—combat—signing—fire again—ceasefire again."
In the early days, the negotiations quickly slid to real military engagement: on June 2-3, the U.S. and Iran carried out mutual military strikes; on June 10-11, the U.S. military carried out multiple airstrikes on Iranian territory, while Iran announced the closure of the Strait of Hormuz, leading to over 160 oil tankers being stranded, with the IMO for the first time advising commercial ships to refrain from transit—market pricing shifted from "geopolitical premium" to "war-time discount rate," sending WTI soaring to $96.
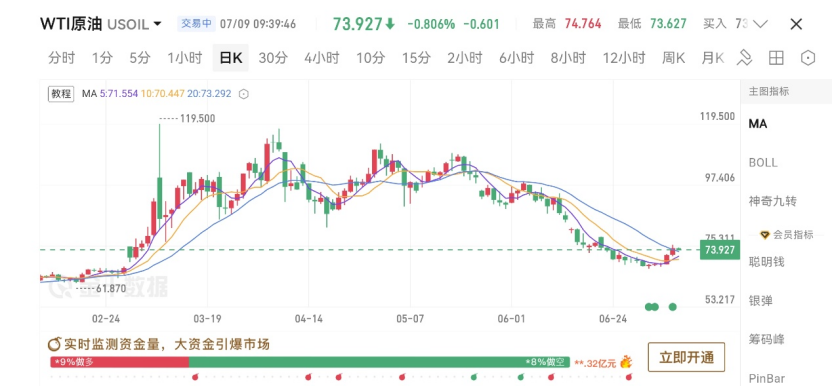
In the middle of the month, the plot reversed 180 degrees: on June 14, Trump announced the "birthday gift" agreement and the full opening of the strait, and on June 17, the MoU was signed remotely and took immediate effect. Crude oil collapsed from $86 to $76, gold saw its safe-haven premium drained, and BTC merely recovered to the corridor of $65-66K—oil is being repriced for real demand prospects, while BTC is merely repricing for the disappearance of headwinds.
In the latter part of the month, "first sign the agreement, then shoot": on June 25, a cargo ship was attacked by drones, on June 26 the U.S. military carried out airstrikes again, and Iran retaliated against U.S. bases; on June 28, there was another ceasefire and an agreement for Doha negotiations, which Iran immediately denied, with Israel openly threatening "independent action."
Gold fell from $4,483 at the beginning of the month to below the $4,000 mark at the end of the month, falling about 10% throughout the month. Each injection and withdrawal of the geopolitical premium saw precious metals complete their pricing, while BTC rejected every easing and fully declined with every escalation—the "digital gold" narrative was thoroughly debunked in June, with BTC traded purely as a high-beta risk asset.
3. Fund Flows: The largest single-month ETF outflow ever, buying side shrinks
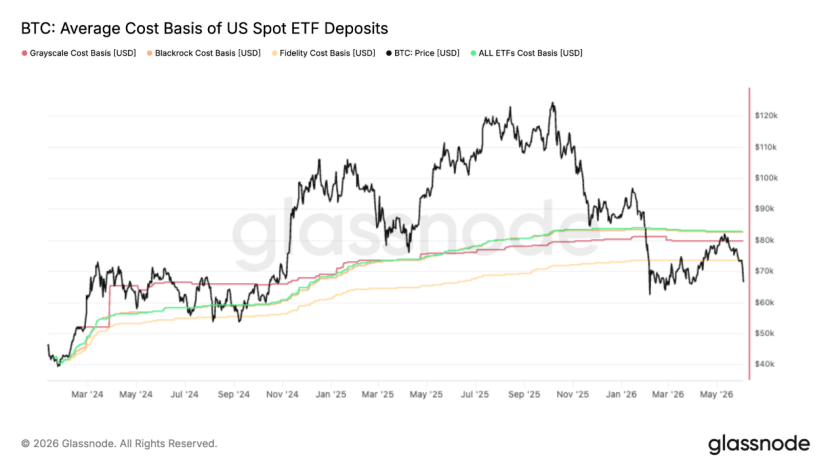
First, BTC spot ETF saw record bloodletting, with a total outflow of about -$4.51 billion over the month, following a "three-wave amplification" pattern: in the early days of the collapse, it saw a cumulative -$3.45 billion over 11 consecutive days, with a single-day peak of -$520 million; in the mid-month geopolitical easing, there were only two or three days with weak inflows of around ten million, with the longest continuous outflow days since inception; in the latter part of the month, under the backdrop of apparent geopolitical easing, conditions worsened with a single-day outflow of -$696 million on June 25, marking a new high for the stage. This round of redemption was "orderly but ongoing," primarily rational realization by institutions built on far lower prices, rather than panic—yet this does not change the conclusion: "Good news does not flow back, bad news accelerates flight," the most important incremental channels remained in a draining state throughout the month. The 82.8K rebound in mid-May was precisely rejected at the ETF aggregation cost of 83K—average ETF investors were pressed into floating losses throughout the month, with "the trapped using rebounds to reduce positions" forming structural top supply.
Second, ETH spot ETF saw a net outflow of about $550 million throughout the month. The only hedging force came from the DAT end: Bitmine went against the trend to increase holdings by about 280,000 ETH over the month, with total holdings at 5.7 million, and Sharplink restarted net buying after eight months—but the total industry DAT AuM shrank from $220 billion to $140 billion, with financing halting for almost all except the top two or three firms. Net inflows from company treasuries plummeted from peak levels of over 500M+/day in April-May to near zero levels in June—another marginal buying pressure extinguished.
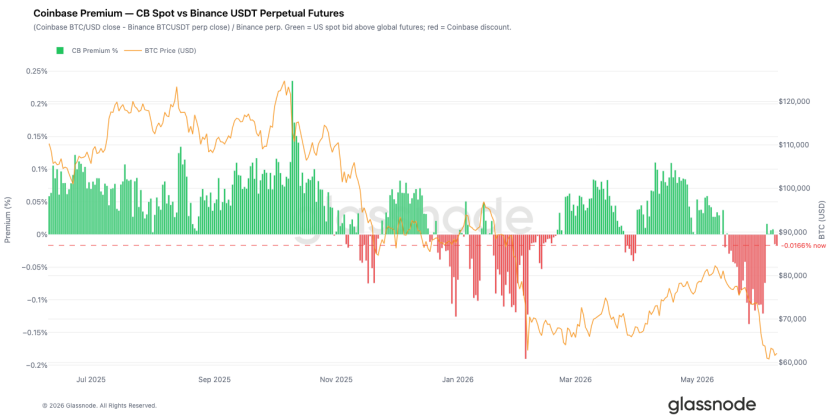
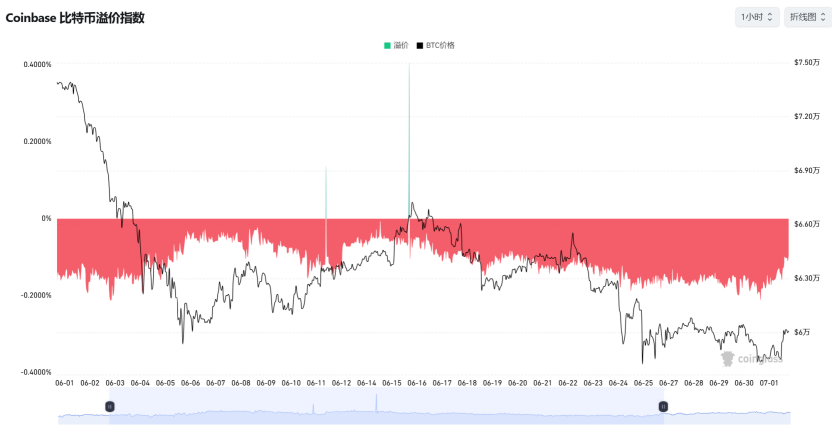
Third, Coinbase premium was deeply negative throughout the month, but a significant marginal change appeared in the latter part of the month: after BTC fell below 62K, Coinbase Spot CVD Bias turned positive first, while Binance remained negative—U.S. institutions began to accumulate on the spot side, while offshore speculative positions remained defensive. With the depth imbalance of the Binance order book switching to the strongest buy-side dominance in months, under the "sell ETF + buy spot" hedge structure, real U.S. buying actually reappeared at lower levels.
Third, Coinbase premium was deeply negative throughout the month, but a significant marginal change appeared in the latter part of the month: after BTC fell below 62K, Coinbase Spot CVD Bias turned positive first, while Binance remained negative—U.S. institutions began to accumulate on the spot side, while offshore speculative positions remained defensive. With the depth imbalance of the Binance order book switching to the strongest buy-side dominance in months, under the "sell ETF + buy spot" hedge structure, real U.S. buying actually reappeared at lower levels.
Third, Coinbase premium was deeply negative throughout the month, but a significant marginal change appeared in the latter part of the month: after BTC fell below 62K, Coinbase Spot CVD Bias turned positive first, while Binance remained negative—U.S. institutions began to accumulate on the spot side, while offshore speculative positions remained defensive. With the depth imbalance of the Binance order book switching to the strongest buy-side dominance in months, under the "sell ETF + buy spot" hedge structure, real U.S. buying actually reappeared at lower levels.
4. On-chain: Structural switching from debunking rebounds to signs of accumulation
June presented the most contradictory and information-rich segment of on-chain visuals, overall evolution showing a clear "debunk—surrender—repair—accumulation" chain.
The core signal at the beginning of the month was the debunking of rebounds. The realized profit-loss ratio 7-day moving average fell off a cliff from 3.16 to 0.29, and the 90-day moving average failed to reach the 2.0 threshold throughout, confirming the 82K rebound as a bear market retracement rather than a structural switch. The cost basis for short-term holders dropped below the actual market mean for the first time since January 2022, formalizing the "late bear market" structure; single-day realized losses expanded to $1.35 billion, with $770 million stemming from liquidation of top buyers at cycle peaks, while the high-position trapped began to realize material losses.
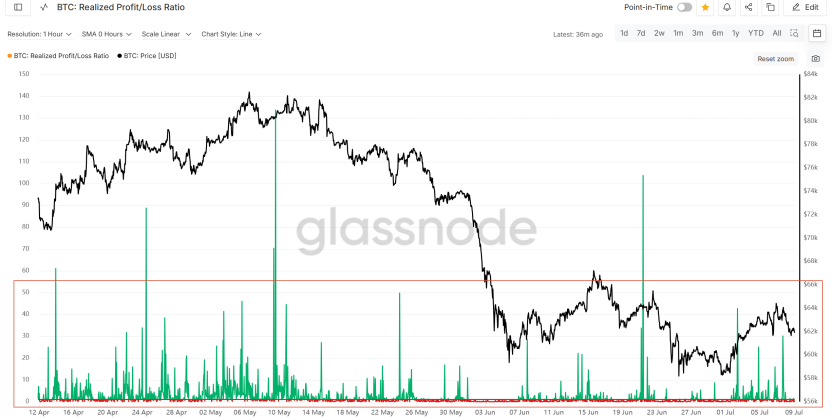
Subsequently, surrender further deepened, yet has not reached historical extremes. The AVIV z-score hit a low of -1.09, penetrating deep into the historically extreme discount zone; short-term holders' profit supply percentage fell to as low as 0.6% (four-year average 55%), meaning over 95% of new buyers were simultaneously at floating losses; the STH-SOPR z-score hit a low of -1.86, only 0.14 standard deviations away from the -2 threshold of "severe surrender." The market was in a classic uncomfortable intermediate state—realizing losses was enough to confirm a deep bear, but had not yet reached the final intensity to trigger a lasting rebound.
Entering the second half of the month, signs of repair began to emerge. The cost basis for short-term holders fell to 71.4K, with new buyers systematically building positions below the cycle average for the first time, a key early step in forming the bottom structure; Net Realized P/L 90-day moving average maintained at -$205 million/day, with market focus continuing to tilt towards Realized Price (53.4K); the short supply cluster around 66.8K–70.7K was clearly marked as the most direct overhead resistance zone.
The most important change at the end of the month was the emergence of accumulation, which for the first time displayed a broad cross-group characteristic. Long-term holders' Net Position Change returned to positive territory, ending the long-term distribution; Accumulation Trend Score significantly rose, with the 1 BTC and 100–1,000 BTC groups nearing full-score accumulation, while 1k–10k large holders simultaneously turned to net buying; LTH supply ratio rose to a multi-year high of 88.1%. Meanwhile, a cycle-level milestone emerged—the total network loss tokens (10.83 million) first exceeded profit tokens (9.22 million), a historical collapse of this profit structure is precisely a hotbed for large-scale migration of tokens from weak hands to strong hands.
Extreme signal dimensions of valuation are also worth noting. Ahr999 ended the month at 0.283, a reading that has historically only appeared at very few moments such as the end of 2011, bear bottom of 2018, March 2020 flash crash, and 2022 FTX collapse; the supply proportion holding more than 3X gains on the ETH side fell to 11%, the lowest since February 2017—extreme valuation compression also means that the overhead trapped positions on future rebound paths are significantly lighter than in the previous two cycles.
Overall, June saw price levels reflecting a debunking of rebounds, but on-chain layers achieved a deep restructuring of token dynamics: short-term speculative positions were systematically washed out, while long-term holders and mid to small retail players, as well as medium to large holders, synchronously began accumulating, entering a historically significant discounted valuation zone. Confirmation signals for reversal have not yet been delivered, but the foundation for bottom engineering has already been laid.
5. Derivatives: Spot surrender opening, short trap closing—month-end repricing in the derivatives market
The deleveraging in June completed in four stages: on June 1, the entire network saw liquidations of $743 million; on June 3, the peak single-day volume reached $1.78 billion, involving 278,100 people (nearly 90% were long); on June 6, the non-farm report collapse involved 348,000 people; in the latter part of the month, amidst repeated geopolitical tensions, continuous daily corrections of $400-1,000 million occurred. Throughout the month, open interest fell by over $2.3 billion, with funding rates oscillating around zero.
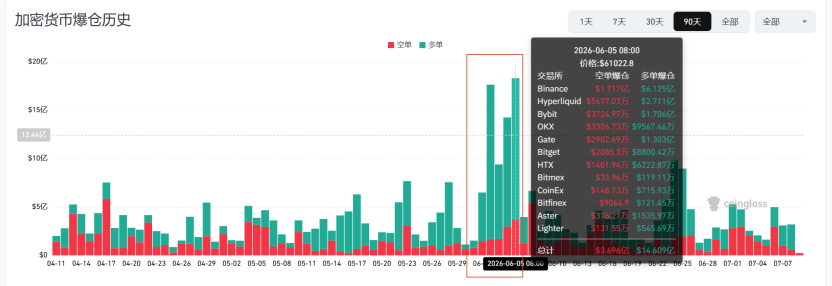
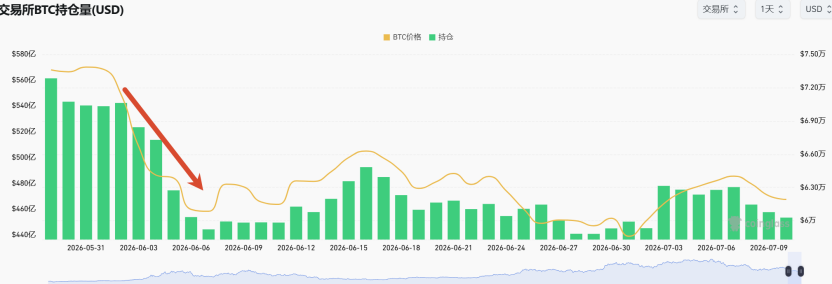
However, what truly defined the month-end structure was the difference in the nature of the two OIs. June 24 was spot-dominated: Spot CVD sharply declined driving a break to 58.1K, and the subsequent OI spike was cleared within days. OI (June 30) was short-dominated: Spot selling pressure had clearly exhausted (Spot CVD level), with funding rates briefly probing down revealing short-driven characteristics, with shorts chasing down at the low of 57.8K twice.
The options market throughout the month completed a transition in attitude from "panic" to "betting on ranges." IV rode a roller coaster from 65% to 35% and back to 45%; the 25 Delta Skew mostly maintained deep Put premiums, and on the fourteenth, the Put/Call transaction ratio surged above 1.0, setting a new high for the year—hedging rather than speculation remained dominant. However, at the end of the month, a key change in the Gamma structure emerged: the negative Gamma concentration zone moved down from 75K, as market makers shifted to long Gamma between the two positive Gamma clusters at 60K and 64K—the hedging flow switched from "amplifying volatility" to "suppressing volatility," and the options market had essentially stopped pricing for downward acceleration, shifting to mid-range pricing between 60-64K. DVOL moderately recovered from historical lows but was far from panic extremes—this resembled the early stages of bottom building rather than an endpoint; historical cycle lows often coincide with the last volatility spike of a surrender type. ETH side needs to continue monitoring the on-chain clearing concentration line at $1,472.
6. Industry Narrative: MSTR's Complete Narrative Arc and Two Overlooked Long-term Variables
The most important event in the industry in June was only one: Strategy completed the full arc of "faith rupture" in 30 days. On June 1, they first reduced their holdings by 32 BTC; mid-month, mNAV converged to 1.02, STRC discounted over 24%, with an implied yield of 15.19%—both equity issuance and preferred stock refinancing channels simultaneously closed, while this year's $2 billion dividends remained intact; in the latter part of the month, they completed a $1.5 billion OTC transaction with BSTR to exchange for dollar reserves; on June 29, they officially announced the "Digital Credit Capital Framework"—raising STRC dividends to 12%, with each track repurchasing up to $1 billion, and the board formally authorized monetization of up to $1.25 billion in BTC. Objectively speaking, this framework extends the coverage period to approximately 26 months, serving as a safety net for the preferred stock, indicating responsible capital management; however, for BTC, the conclusion is cold: the only price insensitive major buyer in recent months has transformed from "eternal absorber" to a potential structural seller. The only consolation came from the market itself at the end of the month—on the day of the bad news announcement, BTC refused new lows, suggesting the market pricing of this thunder may already be quite sufficient.
免责声明:本文章仅代表作者个人观点,不代表本平台的立场和观点。本文章仅供信息分享,不构成对任何人的任何投资建议。用户与作者之间的任何争议,与本平台无关。如网页中刊载的文章或图片涉及侵权,请提供相关的权利证明和身份证明发送邮件到support@aicoin.com,本平台相关工作人员将会进行核查。


