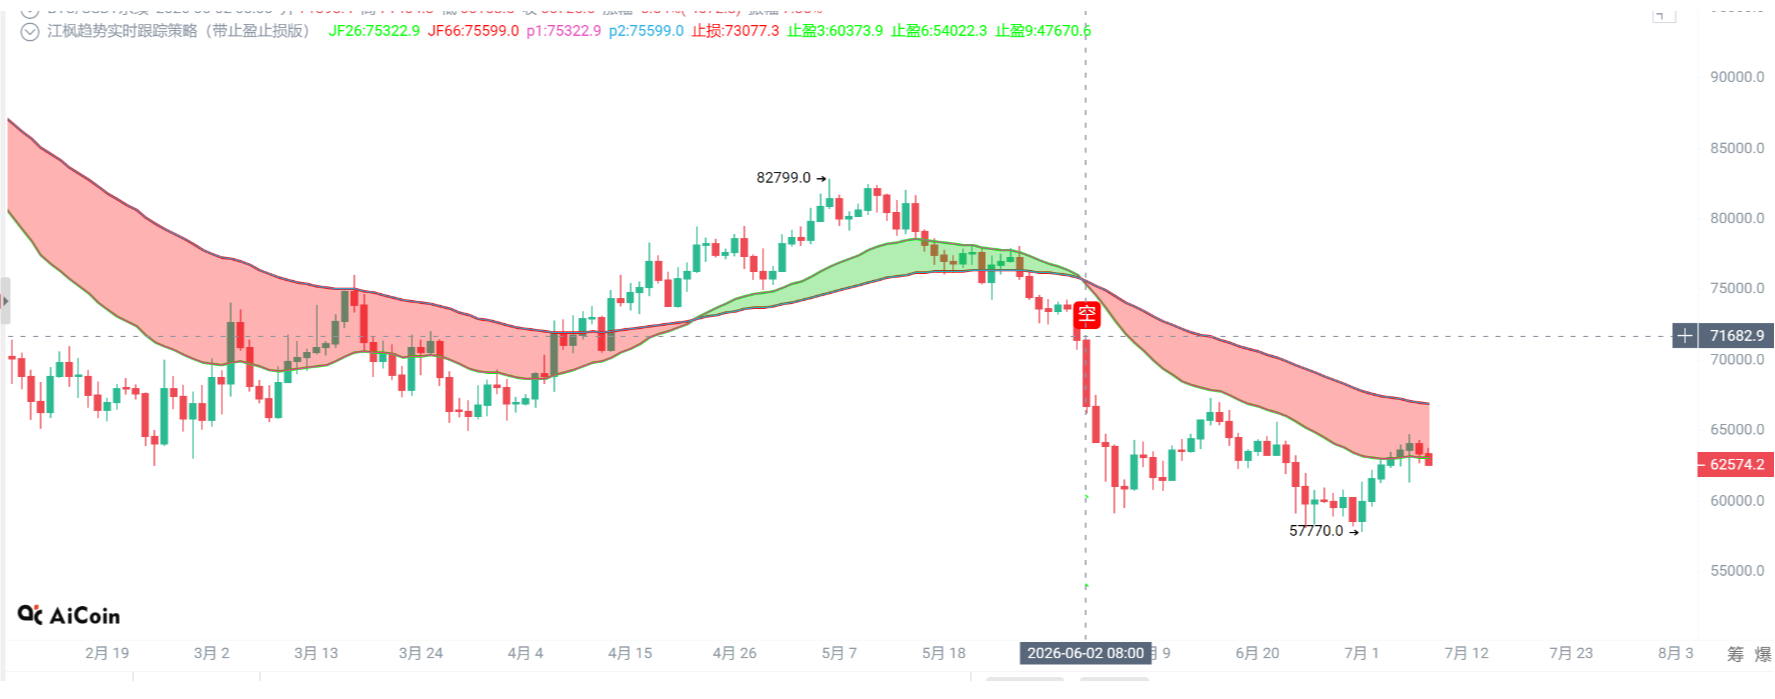
On July 7, 2026, Eastern Time, two sets of data in traditional finance and on-chain showed directions that were not completely consistent within the same day: According to SoSoValue data, the total net inflow of Ethereum spot ETFs on that day was $26.9252 million, marking a continuous net inflow for four trading days, with all the net purchases contributed by BlackRock's ETHA. The product's historical total net inflow is about $11.175 billion, continuing the mid-term trend of institutional funds favoring Ethereum allocation; meanwhile, according to CryptoQuant monitoring, Tether burned about 2.5 billion USDT on the Ethereum network, amounting to about $2.5 billion, which is the largest single burn since February this year, second only to approximately 3.5 billion burned on February 10 and significantly higher than the approximately 2 billion burned on May 8. The specific reasons for this have not been disclosed in public materials, and whether it is due to passive redemptions, active balance sheet reductions, or other operational paths remains to be confirmed. Against the background of ETFs continuously absorbing Ethereum exposure, the on-chain dollar-denominated positions shrank through a one-time large-scale burn. This apparent mismatch of bullish and bearish signals raises the core question in this observation: does it represent a normal rebalancing of fund structures or an early indication of potential risks and opportunities?
ETF Raises Funds for Four Consecutive Days: BlackRock's ETHA Leads
In terms of pace, July 7 Eastern Time marks the fourth consecutive trading day for the Ethereum spot ETF to record a net inflow, with a total net inflow of $26.9252 million. According to SoSoValue data, the net inflow on that day was entirely contributed by BlackRock's ETHA, and the single-day subscription and redemption situation of other products has not been disclosed. This means that in the currently visible sample, the leading product has almost single-handedly shouldered the incremental funds of the entire product line. Compared to ETHA's historical total net inflow of approximately $11.175 billion, this single-day scale of $26.9252 million seems more like "continuously increasing positions" above the already large exposure rather than a substantial structural shift.
From the signal boundary perspective, the day's "total" net inflow for ETHA resonates with its long-term fund size advantage, which can reflect institutional preference for leading products with better liquidity to some extent, and also indicates that the Ethereum exposure has not been significantly reduced due to short-term external disturbances. However, in the absence of data from other ETF products, the current materials cannot determine whether funds have also flowed into more secondary products, nor can they distinguish whether it is new funds entering or existing accounts rebalancing internally among different products. Therefore, what can be confirmed at this stage is that the leading Ethereum spot ETF product is still receiving net buying support, but this information is not sufficient to extrapolate a conclusion of "the entire market of institutions has collectively turned bullish."
The Background of 2.5 Billion USDT Burned on Ethereum
In contrast to the leading ETF products still receiving net buying, on July 7, 2026, Eastern Time, Tether burned about 2.5 billion USDT on the Ethereum network, valued at approximately $2.5 billion on that day. According to CryptoQuant data, this single burn scale is surpassed only by the approximately 3.5 billion USDT burned on February 10 this year, and its size is significantly higher than the approximately 2 billion burned on May 8, thus being positioned as the "largest" USDT burn event on Ethereum since February this year. In other words, on the same day that the Ethereum spot ETF recorded continuous net inflows for four days, one of the core dollar-denominated assets on-chain saw the second largest concentrated burn of the year; the signals from the secondary market and on-chain supply are highly overlapping in timing, but whether there is a direct linkage between the two has not been evidenced in current materials.
Mechanism-wise, the burning of USDT usually signifies that the issuer retracts the corresponding amount from supply on-chain, which often relates to user redemptions, issuer's own account adjustments, or changes in the demand for USDT on the Ethereum network. However, CryptoQuant merely provides the scale and timing. The specific trigger for this burn of about 2.5 billion USDT—whether it was due to concentrated redemptions, internal account adjustments by institutions, or other operational considerations—has not been explained in public materials, so any interpretation of it as a clear unilateral bullish or bearish signal remains uncertain. At this stage, this event is more suited to serve as an important on-chain fact for observing changes in the supply of dollar-denominated assets in the Ethereum ecosystem rather than being directly summarized as a conclusion that market sentiment or direction has undergone a decisive turn.
Institutional Buying and USDT Contraction: The Double Nature of Ethereum Funds
Within the same time window, the two expressions of funds on Ethereum are almost opposite: according to SoSoValue data, on July 7, the total net inflow of the Ethereum spot ETF was $26.9252 million, and the representative product BlackRock's ETHA has accumulated a historical total net inflow of about $11.175 billion, reflecting the continued allocation willingness of traditional financial channels toward Ethereum assets; while according to CryptoQuant data, Tether burned about 2.5 billion USDT on the Ethereum network that day, marking the largest single scale since February this year, indicating that the supply of dollar-denominated assets on-chain has shown a significant contraction at this moment.
Looking at the structure of participants and risk preferences, the incremental funds on the ETF side correspond more to compliant funding and institutional investors' allocation behavior as they take on Ethereum exposure through regulated spot ETFs, tending to manage risks from a mid-to-long-term asset allocation perspective; the contraction of on-chain USDT reflects that the dollar positions in the Ethereum ecosystem are being compressed or reconstructed. However, because the specific causes of this burn have not been disclosed, whether it is due to concentrated redemptions, internal account adjustments, or other operations remains uncertain. More critically, current materials do not provide the price trends of Ethereum on July 7, trading activity, or specific on-chain data at the protocol level, thus we cannot directly map the continuous net inflow of ETF with the large-scale burn of USDT as a short-term bullish-bearish power comparison, and must view this set of "double signals" as a sign of subtle adjustments in the fund structure rather than providing a clear directional conclusion.
Price and DeFi Impact: Currently, We Can Only Ask Questions
From existing materials, the most apparent gap is the lack of instantaneous data on Ethereum's price, major DeFi protocol positions and trading volume, and on-chain activity on July 7, which directly limits our causal inferences regarding the ETF's four-day net inflow and the burn of approximately 2.5 billion USDT, making it stay at the level of hypothesis rather than conclusion. Meanwhile, apart from BlackRock's ETHA, specific funding data for other Ethereum spot ETF products has not been disclosed; whether the burn of USDT was due to user redemptions, internal account adjustments, or other factors remains unconfirmed, and the specific distribution of the 2.5 billion USDT in major DeFi protocols is entirely blank. Under such an information set, any judgment of "the price will definitely react in a certain way" lacks a foundation.
Mechanistically, we can only pose questions rather than provide answers: Will the reduction in USDT supply weaken the available collateral for certain protocols, thereby impacting leveraged positions and borrowing demand? Does the continuous net inflow of ETFs signify that more spot remains locked in traditional financial vehicles, consequently changing the reliance of on-chain trading pairs on Ethereum spot? If in the future USDT sees another large issuance or burn, will there be a certain synchronous or hedging relationship with the changes in ETF funding? Regarding these questions, key observational variables that need to be tracked in the future include: whether the Ethereum spot ETF can maintain net inflows for a longer period instead of evolving into short-term pulses, whether the issuance or burn rhythm of USDT on the Ethereum network presents structural changes, and whether core fundamental indicators on the Ethereum chain, such as active address counts, DEX trading volumes, and collateral structures of leading lending protocols, undergo directional adjustments accordingly.
Dual Signals Out of Sync, Ethereum Is Still in Play
In summary, on July 7, Eastern Time, the Ethereum spot ETF recorded a net inflow for the fourth consecutive day, totaling $26.9252 million and coming entirely from BlackRock's ETHA. According to SoSoValue statistics, this product's historical total net inflow has reached approximately $11.175 billion, reflecting a path of continued accumulation of traditional institutional funds in the secondary market; on the same day, approximately 2.5 billion USDT were burned on the Ethereum network, the largest single scale since February this year. According to CryptoQuant data, the earlier burn of about 3.5 billion USDT on February 10 was accompanied by short-term volatility in Ethereum's price, indicating a possible correlation between large burns and market sentiment, but not sufficient to constitute a stable causal model. Currently, on one side, there is a continued inflow of ETF funds, and on the other side, there is a phase contraction in USDT supply, with the two signals not fully aligned in direction. Lacking details of other ETF products and more comprehensive on-chain indicators, it is still inappropriate to interpret this directly as a clear bullish-bearish guide; a more reasonable positioning is to observe it as a mid-term anchor for changes in Ethereum's fund structure and network usage. In the future, it needs to be continuously tracked whether the Ethereum spot ETF can maintain net inflows for a longer time without turning into short-term pulses, whether USDT issuance and burning rhythms on Ethereum present new cyclical characteristics, and whether the fundamentals on the Ethereum chain adjust directionally in response to the aforementioned changes. Until these dimensions are clarified, investors should avoid overly trading interpretations of single-day data or individual large on-chain actions, perceiving uncertainty as part of decision-making rather than dismissing it as noise.
Join our community to discuss and grow stronger together!
AiCoin's exclusive Hyperliquid benefits: https://app.hyperliquid.xyz/join/AICOIN88
AiCoin's exclusive Aster benefits: https://www.asterdex.com/zh-CN/referral/9C50e2
On-chain Telegram community: https://t.me/AiCoinWhaleData
On-chain community: https://www.aicoin.com/link/chat?cid=N6OVMor5g
AiCoin's on-chain Twitter: https://x.com/aicoinwhaledata
免责声明:本文章仅代表作者个人观点,不代表本平台的立场和观点。本文章仅供信息分享,不构成对任何人的任何投资建议。用户与作者之间的任何争议,与本平台无关。如网页中刊载的文章或图片涉及侵权,请提供相关的权利证明和身份证明发送邮件到support@aicoin.com,本平台相关工作人员将会进行核查。