Dear friends, I am Sister Qinglan. This morning, July 8th, the market sentiment is quite complex. On one hand, the geopolitical risks in the Middle East have suddenly escalated, Trump approved strikes against Iran, oil prices have skyrocketed, and risk aversion sentiment has intensified, which poses a short-term bearish impact on risk assets like BTC. On the other hand, BitMine reportedly increased its holdings by 40,000 ETH, valued at over $70 million, indicating that institutional investors are still accumulating against the trend, injecting a shot of confidence into the market. In this intertwining of bullish and bearish forces, BTC is currently quoted at 62872 USDT, and we need to seek the true direction from the data.
Current price and time
The current time is 10:03 on July 8th, and the BTC price is reported at 62872 USDT. The 24-hour decline is 1.36%, and the fear and greed index has dropped to 20, which is in the extreme fear range. At this position, retail investors are panicking, while institutions are quietly accumulating, which is a test of traders' composure.
Multi-period state overview
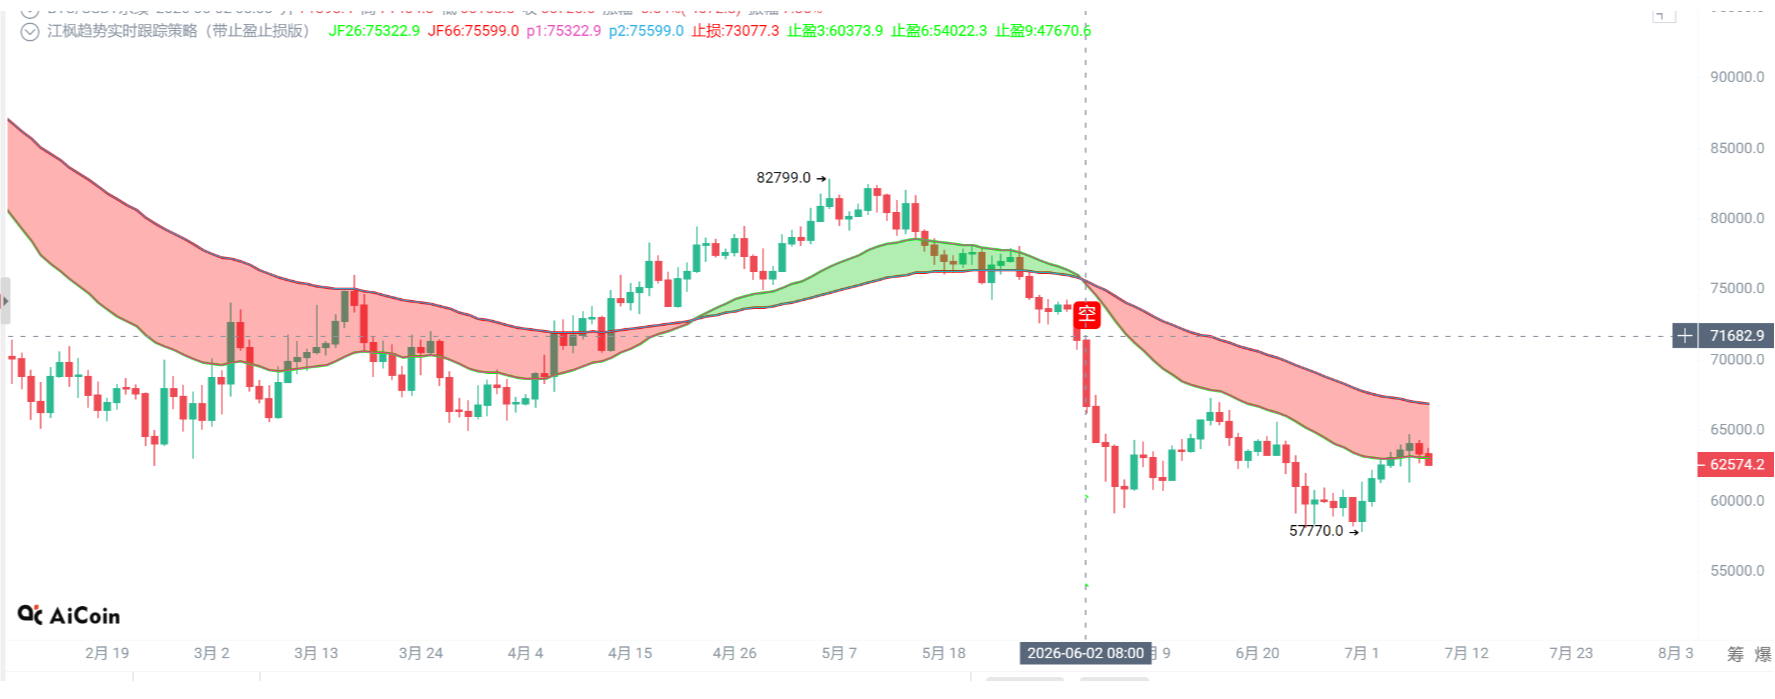
Let’s first look at the daily level. The daily MA5 is at 63414, MA10 at 62012, MA30 at 62624, with the price currently between the moving averages. The short-term averages are slightly above the long-term averages, but no clear bullish arrangement has formed. The MACD DIF is -702.35, DEA is -1354.82, with a histogram value of +652.46, indicating that although the DIF remains below the zero axis, the histogram has been positive continuously, and bearish momentum is waning. The RSI is at 58.14, in a neutral to strong area, showing that the daily overall structure presents a consolidation bottoming formation.
At the 4-hour level, MA5 is at 63478, MA10 at 63499, MA30 at 62967, with prices hovering near the MA30. The MACD DIF is 394.78, DEA is 504.26, and the histogram value is -109.48, indicating weak short-term momentum, with the DIF running below the DEA under bearish crossover pressure. The RSI is at 50.80, just near the neutral line, with no clear direction.
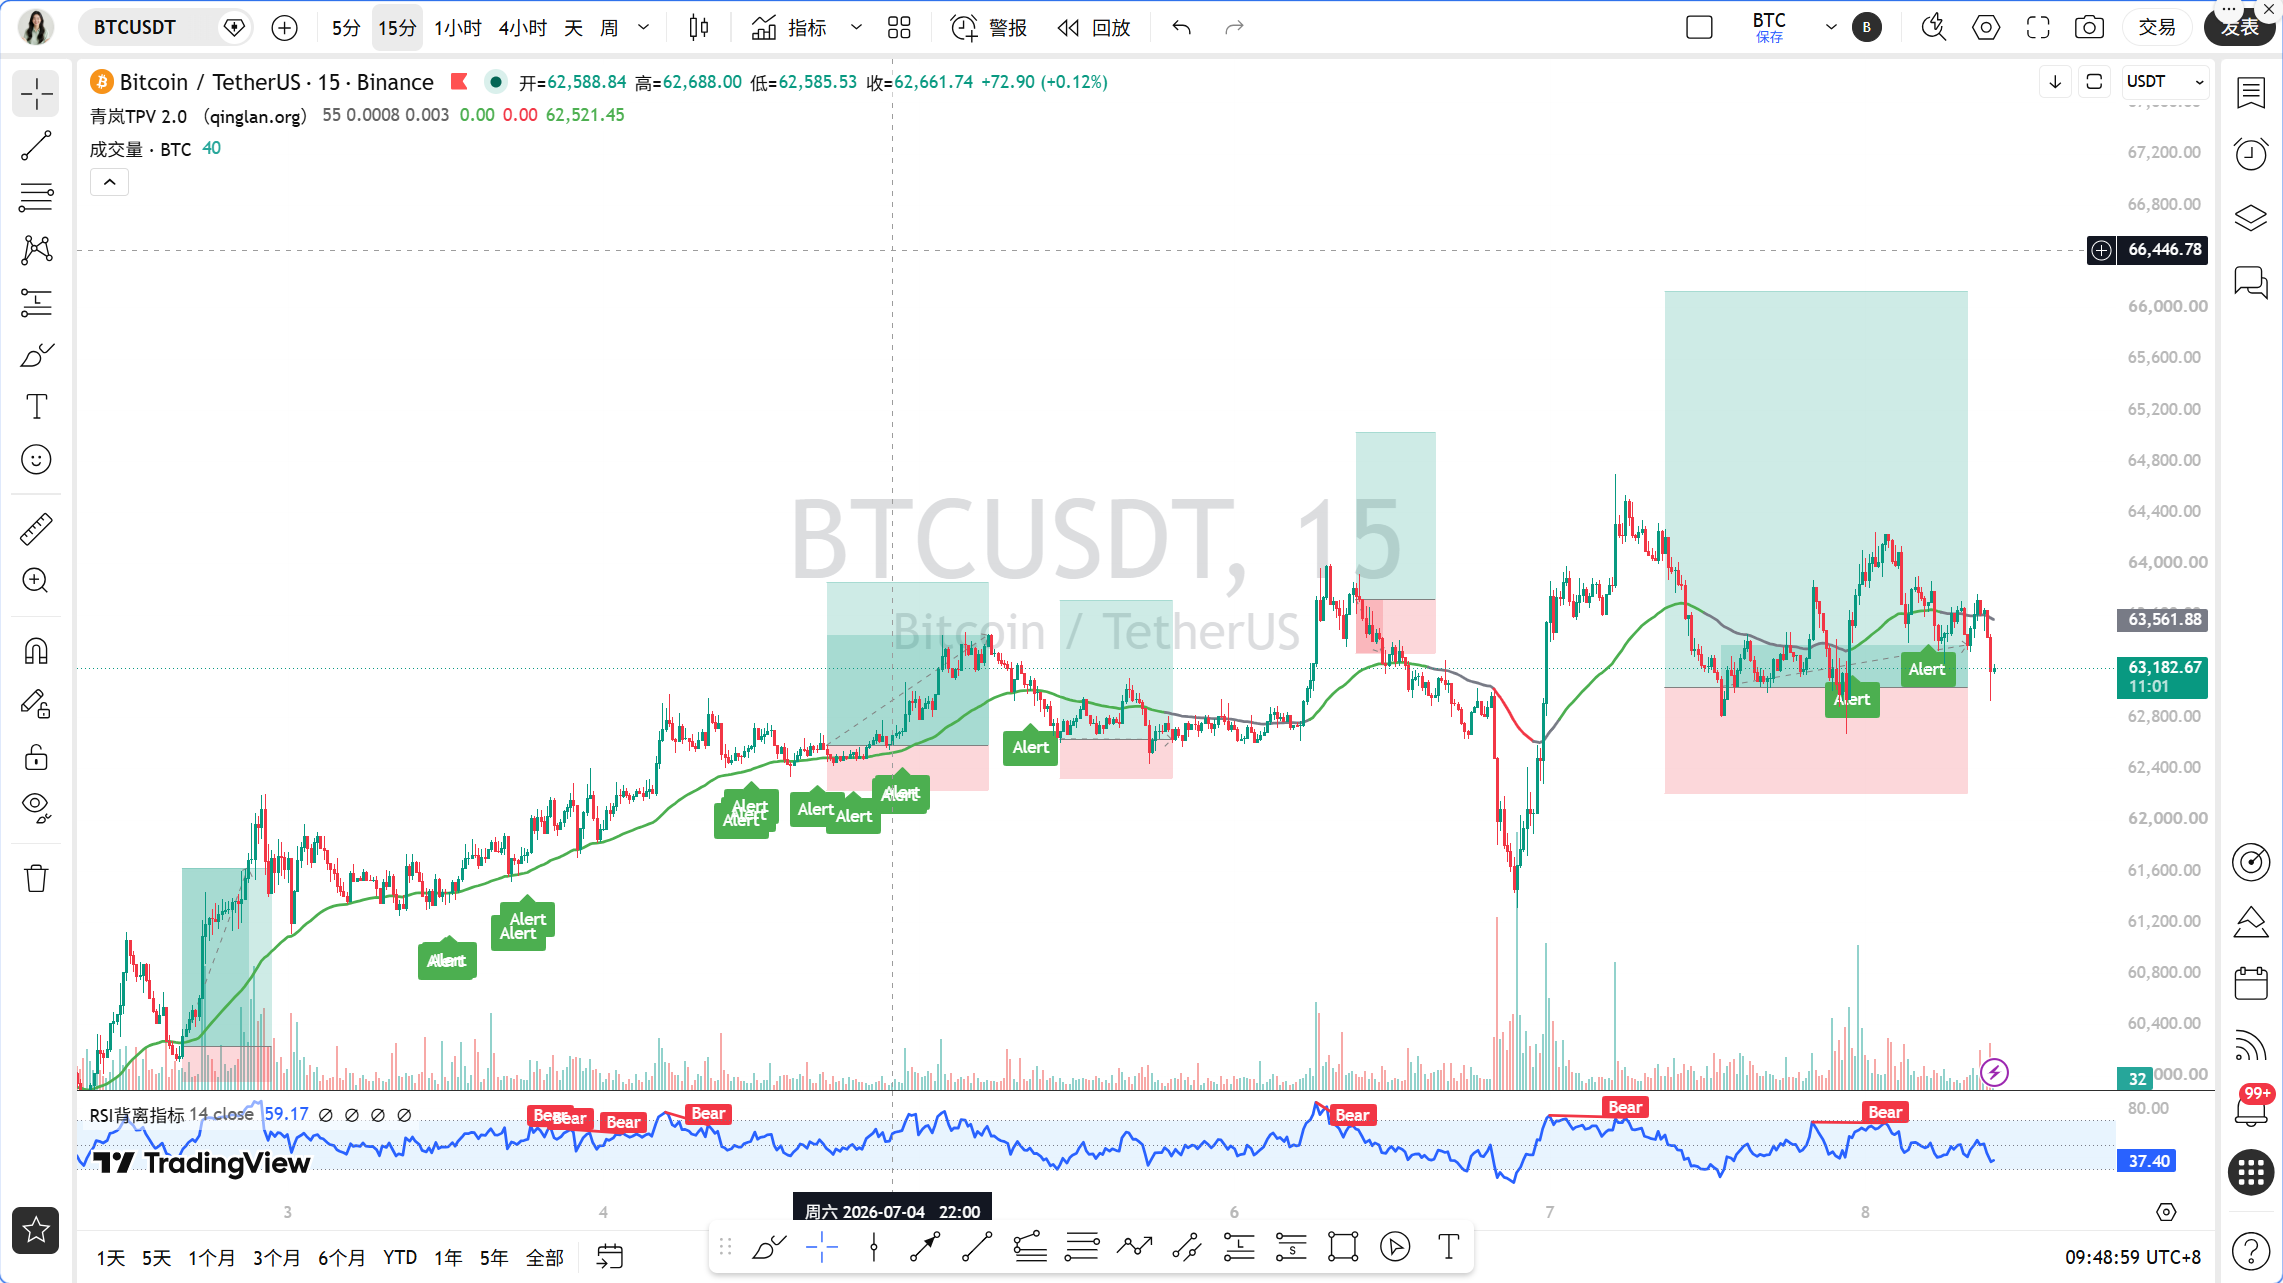
At the 1-hour level, MA5 is at 63287, MA10 at 63524, MA30 at 63543, with prices breaking below all short-term moving averages. The MACD DIF is -37.68, DEA is 50.31, and the histogram value is -87.99, with the DIF crossing below the DEA forming a bearish crossover, releasing bearish momentum. The RSI is at 42.18, in a weak area. The EMA55 is at 63367.52, with the current price of 62872 below the EMA55, indicating a bearish advantage.
At the 15-minute level, MA5 is at 63225, MA10 at 63391, MA30 at 63539, with prices also below all moving averages. The MACD DIF is -133.07, DEA is -68.38, and the histogram value is -64.69, with bearish momentum continuing after the crossover. The RSI is at 27.89, having entered the oversold area, indicating a short-term demand for a rebound, but the trend remains weak.
TPV signal verification
According to the Qinglan TPV system, we use the 1-hour EMA55 as the boundary for bullish and bearish judgment. The current price is 62872, below the EMA55 of 63367.52, indicating a bearish trend area. Let's verify if the short-selling conditions are met.
First, the price is under pressure below the 1-hour EMA55. In the past 8 1-hour candles, the closing price was above the EMA55 5 times and crossed it 3 times; the current price is at an absolute distance of 0.78% from the EMA55. Although the number of crossings is high, both of the last two candles closed below the EMA55, and the price has been declining, satisfying the condition of having two consecutive candle closes below the EMA55.
Second, the pressure meets resistance. From a structural perspective, the price has repeatedly faced resistance near 64000, forming a clear topping structure, with long upper shadows occurring frequently, indicating heavy selling pressure from above.
Third, the rebound is weak. The MACD histogram value has shortened for two consecutive periods, but note that this is a shortening after the release of bearish momentum, not an increase in rebound momentum. The RSI continued to fall from around 42 to 27.89, showing that the rebound strength is extremely weak, and the bears continue to dominate.
In summary, the current conditions meet the requirements for short selling, but it should be noted that the 15-minute RSI has entered the oversold zone, indicating a short-term technical rebound risk. It is not advisable to chase short positions; one should wait for a rebound to the key resistance point before entering.
On-chain/Funding situation
On-chain data shows a fear and greed index of 20, indicating extreme fear, which historically tends to represent a stage bottom area. BTC’s market share is at 56.06%, maintaining a high level, indicating that funds are still flocking to BTC for safety, while altcoins have poor liquidity. The news of large-scale ETH accumulation is worth noting; BitMine's addition of 40,000 ETH shows that institutions are optimistic about Ethereum in the long run, which may drive ETH's relative strength, but the short-term boost for BTC is limited. US tech stocks have plunged, with the Philadelphia Semiconductor Index falling by 4.65%, demonstrating strong correlation among risk assets, thereby placing short-term pressure on the cryptocurrency market.
Key defensive positions
The first resistance level above is near the 1-hour EMA55, at 63367. If the price rebounds to this point, it will face bearish pressure. The second resistance level is at the 64000 integer level, which is a previous high tested multiple times and also a key position for large investors to sell call options. The first support level below is around 62000, which is a confluence area of the daily MA10 and previous low points. If it breaks below 62000, the next support level is at the 60000 integer level, which represents a dual psychological and technical support.
Trading thoughts
Direction: Bearish dominant, but wait for a rebound to enter, do not chase short.
Entry conditions: If the price rebounds to the 63200-63300 area, and a long upper shadow or topping pattern appears in 15 minutes, and the MACD histogram value expands again, one can short with a small position. If the price directly breaks below 62000, then wait for a pullback confirmation before entering.
Stop-loss position: Set above 63550; if it breaks above the 1-hour EMA55 and stabilizes, the bearish logic is invalidated.
Target position: First target at 62000, second target at 61000. If market panic intensifies, it can be watched down to 60000.
Risk warning
Geopolitical risks may trigger severe short-term volatility; be sure to control your position and strictly enforce stop-losses.
Follow Qinglan Crypto Classroom to seize more trading opportunities! Visit our official website at www.qinglan.org
📊 Qinglan TPV trading strategy backtest reference
🕒 Last backtest time 07-08 07:00:01
Total analysis: 2792 Backtest: 2169 Accuracy: 74.9% (1624/2169)
免责声明:本文章仅代表作者个人观点,不代表本平台的立场和观点。本文章仅供信息分享,不构成对任何人的任何投资建议。用户与作者之间的任何争议,与本平台无关。如网页中刊载的文章或图片涉及侵权,请提供相关的权利证明和身份证明发送邮件到support@aicoin.com,本平台相关工作人员将会进行核查。