Cryptocurrency Circle Academician: The 7.3 Bitcoin (BTC) indicator resonance appears, the main force is preparing to reveal the cards; will you follow or not? Latest market analysis and operation suggestion interpretation
The current price of Bitcoin is 61600. To be honest, this rebound looks lively, but it is still a repair in the downward trend. Don’t shout that a bull market is coming just because the price rises. What the cryptocurrency world lacks the least is people who chase high and sell low. Just yesterday, a friend sold at 58000, and today another friend is chasing high at 61000, getting washed back and forth. Remember, no matter how attractive the rebound looks, don’t go all in before breaking through the key pressure level. Position control is more important than anything else; protecting your principal gives you the opportunity to wait for the real trend to arrive.
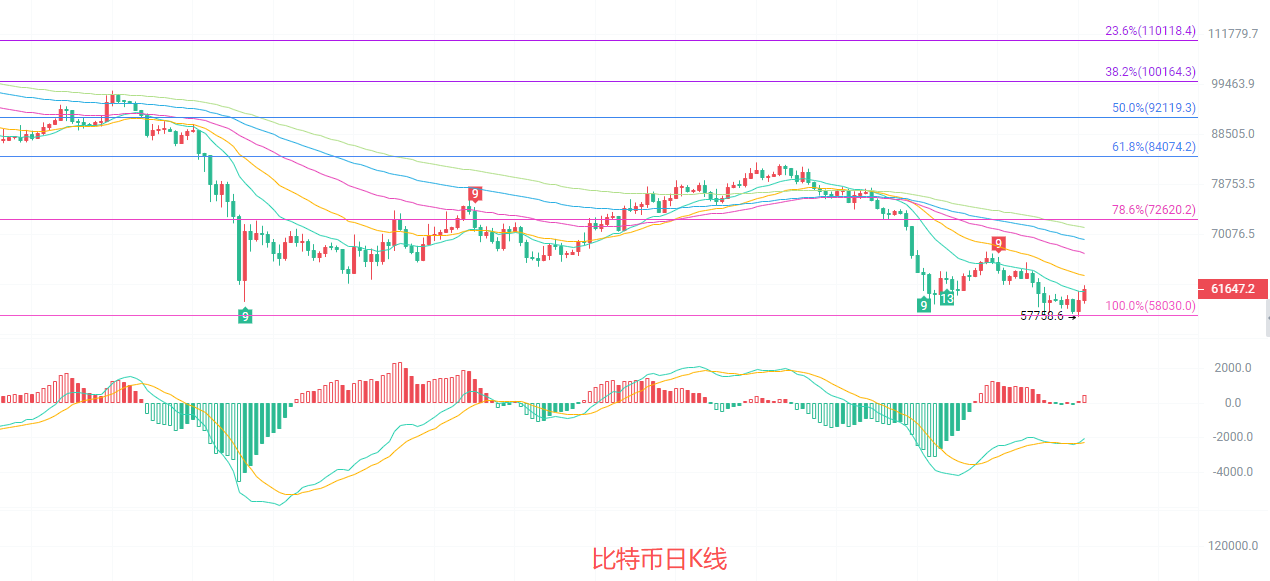
The daily K-line is just near the EMA15, the short-term moving averages are flat, indicating a stalemate between up and down at the current position. The MACD indicator has initial red bars appearing, the DIF is turning upwards, and the green bars are obviously shrinking, indicating a decline in downward momentum. The middle track of the Bollinger Bands at 62392 has obvious resistance, while the lower track at 57760 has strong support; the current price is rebounding from near the lower track, with moderate volume increasing. The key resistance level above is around 72620, which is the Fibonacci 78.6% retracement level; this area is a key accumulation area from the previous decline, making it difficult to break through. The short-term rebound is still in the repair stage of the downward trend.
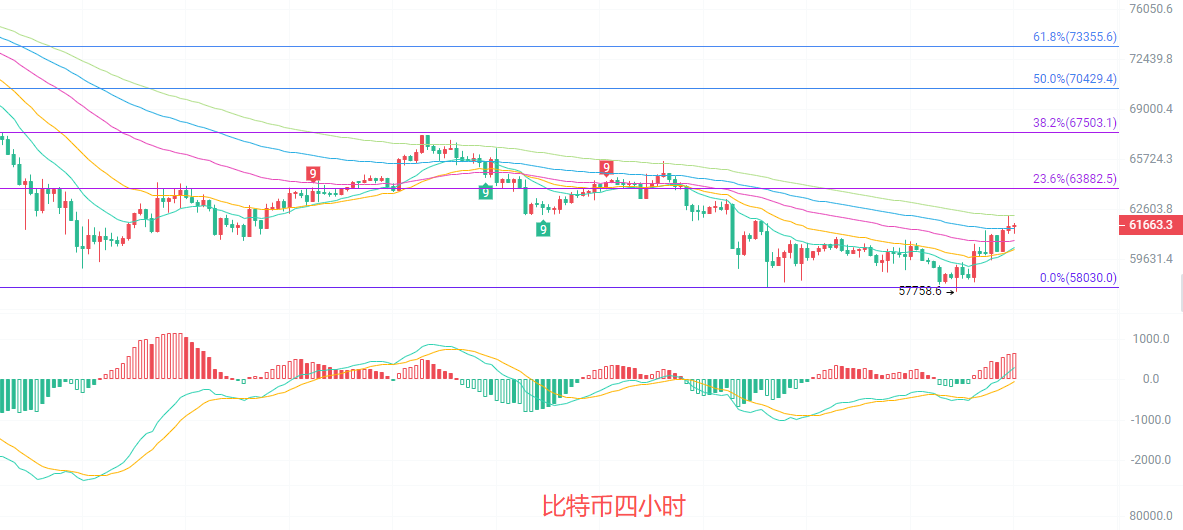
The four-hour K-line rebounded after hitting a low at 57758; the current price is above the EMA15/30 moving averages, and the short-term moving averages are turning upwards, forming initial support. The MACD red bars continue to increase; the DIF and DEA are above the zero axis and continue to rise after a golden cross, with upward momentum prevailing. The Bollinger Bands are narrowing, and the price is moving along the upper track, with short-term resistance around 61740 on the upper track, while support at 57910 on the lower track is solid. The Fibonacci 23.6% position at 63882 is the first hurdle for the rebound; if it cannot break through with increased volume, it will likely retest the moving average support, currently in a repair market for an oversold rebound, without a clear reversal signal yet.
Short-term reference:
If the price doesn't break 60500 to 60000, it may go up; stop loss at 59500, target 61500 to 62500.
If the price doesn't break 62500 to 63000, it may go down; stop loss at 63500, target 62000 to 61500.
Specific operations should be mainly based on real-time market data. For more news details, you can consult the author. The publication of the article is delayed, and suggestions are for reference only, with risks borne by oneself.

Warm reminder: The above content is solely created by the author of the public account. The advertisements at the end of the article and in the comment area have nothing to do with the author, please identify carefully, thank you for reading.
免责声明:本文章仅代表作者个人观点,不代表本平台的立场和观点。本文章仅供信息分享,不构成对任何人的任何投资建议。用户与作者之间的任何争议,与本平台无关。如网页中刊载的文章或图片涉及侵权,请提供相关的权利证明和身份证明发送邮件到support@aicoin.com,本平台相关工作人员将会进行核查。