This week, the market enters a critical game phase.
At the macro level, marginal changes in Federal Reserve policy expectations continue to dominate the pricing rhythm of risk assets; the cryptocurrency market, after experiencing previous fluctuations and consolidations, is seeing the divergence between long and short positions concentrate at critical price levels.
This weekly review continues the consistent framework: based on multi-cycle trend structure analysis and combined with quantitative model signals, it evaluates the market trends of BTC and HYPE for this week and formulates specific medium- and short-term operational plans.
It should be especially noted that all content in this article is a personal technical analysis record, serving only as a reference framework and basis for personal trading decisions, and does not constitute any form of investment advice. The market is always more complex than predictions; strict adherence to risk control and stop-loss discipline is always the top priority.
Summary of core trading viewpoints for this week:
- BTC hourly level trend structure analysis (detailed explanation in the first section)
- BTC market outlook and medium- and short-term operational strategies for this week (detailed explanation in the second section)
- HYPE hourly level trend structure analysis (detailed explanation in the third section)
- HYPE market outlook and short-term operational strategies for this week (detailed explanation in the fourth section)
Market validation of last week's trading strategies and core viewpoints:
- BTC market outlook validation: Last week we strictly followed trading discipline, and when the market presented entry opportunities, we decisively established about 20% of short positions. The medium-term trading plan outlined in the weekly review article was executed.
1. In-depth analysis of Bitcoin’s hourly level trend structure
Bitcoin _4-hour candlestick chart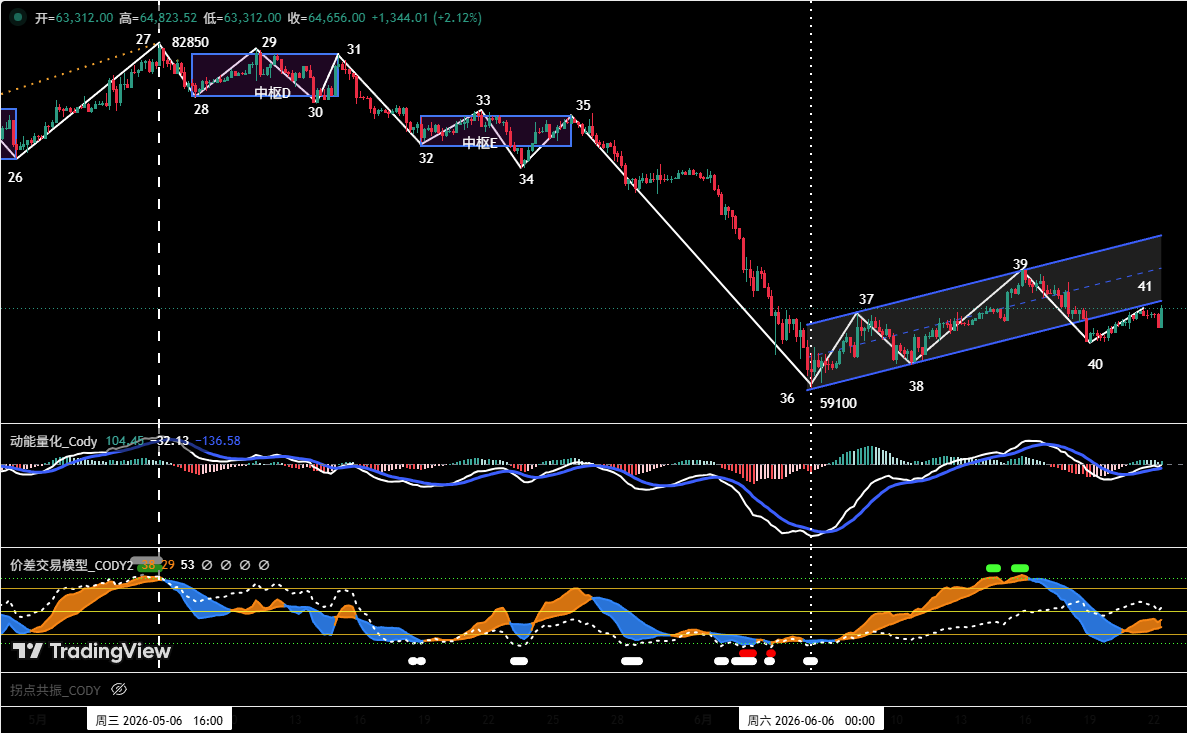
Figure One
① As shown in (Figure One): From the 4-hour trend structure, the price of the coin has started to rebound from the low of $59,100 on June 5, and can be subdivided into a five-segment structure, corresponding to 36-37, 37-38, 38-39, 39-40, 40-41.
② The overall trend presents a short-term upward channel shape (blue channel in the figure): its upper boundary is formed by connecting the two rebound highs (endpoint 37) and (endpoint 39), while the lower boundary is established by connecting the two adjustment lows (endpoint 36) and (endpoint 38). The figure shows that the price has already broken below the channel's lower boundary at (endpoint 40). The current (40-41) rebound segment can be seen as a confirmation phase of the pullback after breaking below the channel's lower boundary. If (endpoint 41) cannot regain a stable position above the channel's lower boundary, the probability of the price testing the previous low $59,100 support again will significantly increase.
2. Bitcoin market outlook and operational strategies for this week
1. BTC market trend outlook for this week:
This week's core viewpoint: Focus on the results of the price's pullback confirmation against the lower boundary of the short-term channel.
- If it holds effectively, the price will continue to rebound along the short-term upward channel and may challenge the core pressure area of $69,500 to $70,500.
- If it breaks effectively, the market may further test the core support zone of $59,000 to $60,000.
2. Core resistance levels:
- First resistance zone: $64,500 to $65,000 area (near the lower boundary of the short-term upward channel)
- Second resistance zone: $69,500 to $70,500 area (previously dense transaction area)
3. Core support levels:
- First support level: $59,000 to $60,000 area (previously important support level)
- Second support level: Near $55,000 (previously important support level)
4. Operational strategies for this week (excluding sudden news impacts)
① Medium-term strategy:
Bitcoin _ Daily candlestick chart (position monitoring model)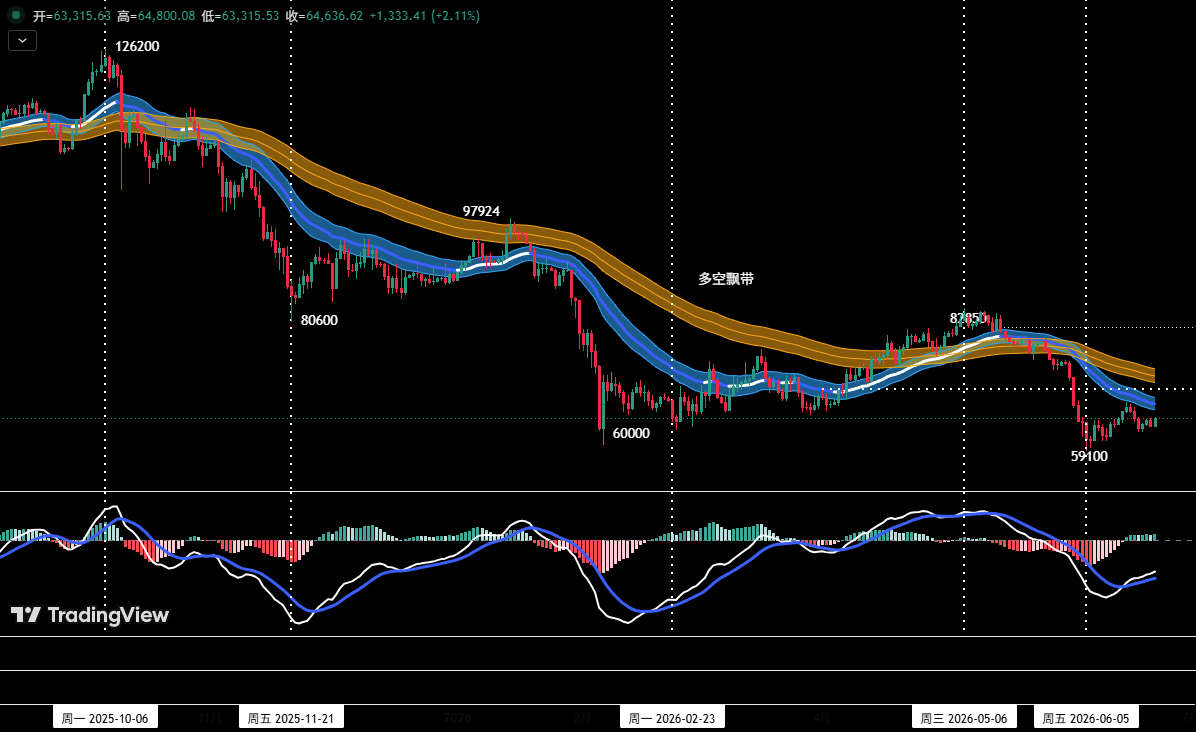
Figure Two
Position monitoring model: As shown in (Figure Two), the current price has effectively broken below the "long-short channel," and the market structure confirms a shift to a bearish dominant pattern. Last week, according to the formulated plan, we entered a short position near $64,500, with initial medium-term positions controlled at about 20% of total capital. We will follow the stop-loss discipline and wait for the next opportunity to increase positions.
② Short-term strategy: Using 30% of the position, set a stop-loss point, based on support and resistance levels, looking for "arbitrage" opportunities (with 30 minutes/60 minutes as the operational cycle).
③ In short-term operations, to dynamically respond to the complex evolution of the market, we have preliminarily developed three specific operational plans: A/B/C.
Plan A: Tentative layout in resistance zone
- Open position: If the coin price rebounds to the $64,500 to $65,000 area and shows signs of stagnation, combined with the top signal from the quantitative model, an initial short position of about 15% can be established.
- Risk control: Set an initial stop-loss level.
- Close position: When adjusting near important support levels and combined with model signals, positions can be gradually closed for profit-taking.
Plan B: Increasing position in strong resistance zone
- Increased position: If the coin price breaks through $65,000 resistance and continues to rebound to the $69,500 to $70,500 area showing pressure signals, combined with the top signal from the quantitative model, short positions can be increased to within 30%.
- Risk control: Set an initial stop-loss level.
- Close position: When adjusting near important support levels and combined with model signals, positions can be gradually closed for profit-taking.
Plan C: Effective breakdown below support, adding to shorts
- Increased position: If the coin price effectively breaks below the $65,000 support and continues to adjust and loses the $59,000 to $60,000 support area, consideration can be given to adding to short positions to within 30% when a weakening signal appears during price pullbacks for confirmation.
- Risk control: Set an initial stop-loss level.
- Close position: When falling to important support levels and combined with model signals, positions can be gradually closed for profit-taking.
3. HYPE hourly level trend structure analysis
HYPE_4-hour candlestick chart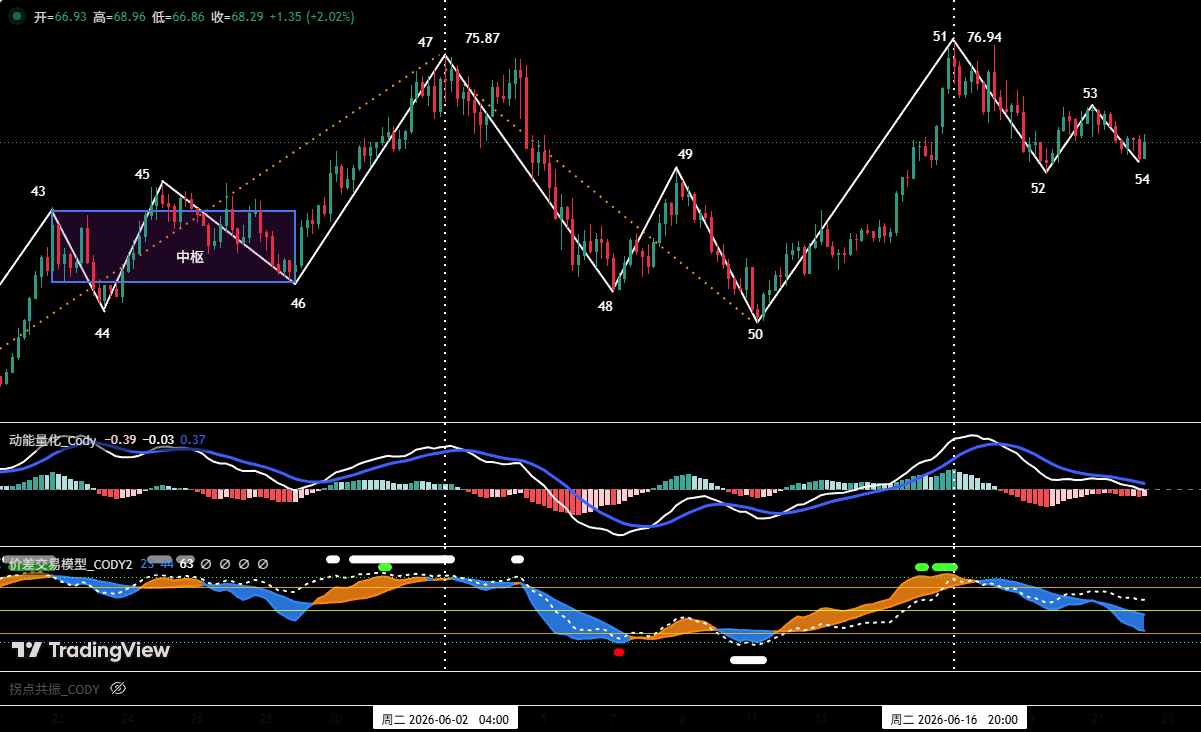
Figure Three
① As shown in (Figure Three), in the 4-hour cycle, HYPE began to adjust from the high of $75.87 on June 2 (endpoint 47), stabilizing near $52.62 (endpoint 50) on June 10, with the adjustment lasting about 9 trading days. As the market entered a strong upward phase (50-51 segment), it broke through the previous high within 6 trading days, reaching a new high of $76.94 since the rise in January, indicating that bullish momentum remains strong.
② The subsequent pullback from the new high presents a clear three-segment adjustment structure (51-52, 52-53, 53-54). Currently, the price has retraced again to the critical support area of $64 to $66.
- Bullish scenario: If the price receives effective support in this area, the uptrend since (endpoint 50) is expected to continue, with prices likely to challenge new highs.
- Bearish scenario: If this position is lost, the adjustment time will extend, and the price may test the core support zone of $52 to $54 again, which is the starting point of the previous uptrend.
4. HYPE market outlook and short-term operational strategy for this week
1. HYPE market trend outlook for this week:
① Core resistance levels:
- First resistance level: Near $77
- Second resistance level: $80 to $82 area
② Core support levels:
- First support level: $64 to $66 area
- Second support level: $52 to $54 area
This week's core viewpoint on HYPE:
- Observe the outcome of the tug-of-war between bulls and bears over the $64 to $66 area.
2. HYPE short-term operational strategy for this week (support-driven long positions)
This week, short-term trading in HYPE should follow the strategy of "building positions on dips, avoiding chasing highs."
Short-term strategy: Stabilizing at support area to test longs
When the price of HYPE retraces to the $64 to $66 area or deeper to the $52 to $54 key support area, if a stop decline and stabilization signal occurs, and combined with the bottom signals triggered by the two major models, consideration can be given to lightly testing longs, with positions strictly controlled to below 30%, and adhering to stop-loss discipline.
5. Special reminders:
- When opening positions: Immediately set an initial stop-loss level.
- When profit reaches 1%: Move the stop-loss level to the breakeven point (cost price) to ensure capital safety.
- When profit reaches 2%: Move the stop-loss level to the position of 1% profit.
- Continuous tracking: After that, for every 1% profit gained, move the stop-loss level 1% correspondingly to dynamically protect and lock in profits.
The financial market is ever-changing, and all market analyses and trading strategies must be dynamically adjusted. All viewpoints, analytical models, and operational strategies mentioned in this article originate from personal technical analysis, are for personal trading log use only, and do not constitute any investment advice or operational basis. The market has risks; investors should proceed with caution and not make decisions based on this.
免责声明:本文章仅代表作者个人观点,不代表本平台的立场和观点。本文章仅供信息分享,不构成对任何人的任何投资建议。用户与作者之间的任何争议,与本平台无关。如网页中刊载的文章或图片涉及侵权,请提供相关的权利证明和身份证明发送邮件到support@aicoin.com,本平台相关工作人员将会进行核查。


