Crypto Circle Academician: After the sharp drop in Bitcoin on June 12, it is in a recovery phase; do not mistake the rebound for a reversal buy-in! Latest market analysis and trading advice
The current price of Bitcoin is 63400. After every large-scale liquidation, there is a lengthy recovery period. We are currently in the early stage transitioning to the mid-stage; a later stage is still ahead. When trading, always prioritize following the trend. As long as the daily line is moving south, the focus is mainly on short positions. For short-term long positions, only capture small rebound profits and take them when available. Many people lose substantial amounts of money because they hold positions without a stop-loss, thinking that once it drops, it will always come back up. It is very normal to be deeply trapped for months during bear markets. Position management should always come first; do not go all-in, leave enough reserve to cope with fluctuating spikes, and patiently wait for high-certainty points to act. An impatient mindset is the biggest enemy of trading.
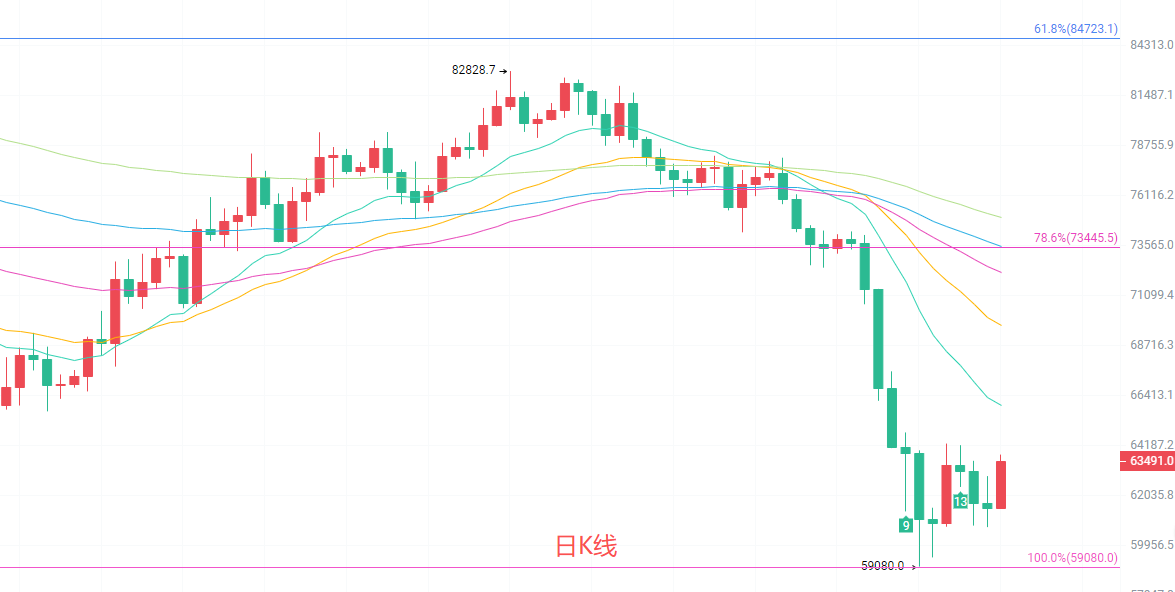
The daily K-line shows a slight rebound of 3.14%, with the lowest point at 59080 being a key bottom in this downward trend. The overall moving average downward suppression structure is solid, with multiple EMA moving averages continuously suppressing prices. 73445 is the first major resistance level in the mid-term. The MACD is consistently in the green area of downward movement, with no reversal signals from the dual lines; the Bollinger Bands are opening downward, with the overall market running in a weak lower track area. Yesterday's rebound was a technical recovery after the oversold condition, with weak upward momentum unable to break through short-term moving average pressures. The large downward trend on the daily line has not changed at all, and the rebound space is limited. Any rise provides an opportunity for short positions, while a significant reversal upward must firmly hold above the 73000 mark to qualify.
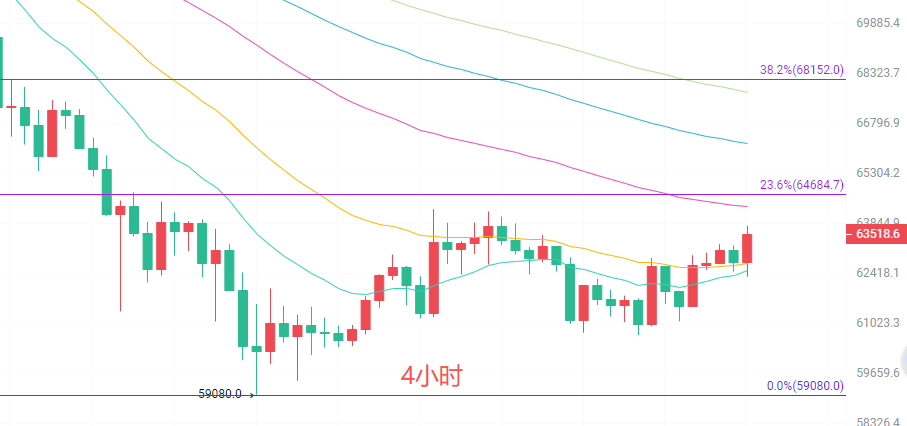
The four-hour K-line started a recovery rebound from the 59080 low, with prices slightly above the 15-period short moving average, but all medium- and long-term moving averages are forming a resistance above. Fibonacci resistance levels at 64684 and 68152 block upward space layer by layer; the MACD green bars are clearly shrinking, with the dual lines about to merge for a golden cross, indicating short-term potential for continued slight rebound momentum. The Bollinger Band range is narrowing, reducing volatility, with prices weakened just below the middle track. The 4-hour chart is merely a rebound and adjustment during the downward trend, not a trend reversal. The rebound height is limited; once the indicators are repaired, the downward force will be released again. Do not mistake the rebound for a reversal and chase long positions heavily.
Short-term strategy reference: Follow the trend of the larger cycle, with small stop-losses for quick entry and exit.
Long positions from 62500 to 62000, stop-loss at 61500, target between 63500 and 64500.
Short positions from 64500 to 65000, stop-loss at 65500, target between 63500 and 62500.
Specific operations should be based on real-time data on the market. For more details, you may consult the author; the article publication may be delayed, and suggestions are for reference only, with risks taken on oneself.

Warm reminder: The above content is solely created by the author on Weibo; the ads at the end of the article and in the comments section are unrelated to the author. Please discern carefully, and thank you for reading.
免责声明:本文章仅代表作者个人观点,不代表本平台的立场和观点。本文章仅供信息分享,不构成对任何人的任何投资建议。用户与作者之间的任何争议,与本平台无关。如网页中刊载的文章或图片涉及侵权,请提供相关的权利证明和身份证明发送邮件到support@aicoin.com,本平台相关工作人员将会进行核查。