Academician of the Cryptocurrency Circle: On May 29, the daily structure of Bitcoin broke down, and a new round of transformation window has opened! Latest market analysis and trading suggestions
Bitcoin's current price is 73,500. An interesting thing happened these days; clearly, the trend of Bitcoin is heading south, yet many coin friends can't help but try to catch the bottom, always thinking it has almost reached the bottom. As a result, they are repeatedly slapped in the face and come to me for help. What is lacking in the cryptocurrency circle is not opportunities, but patience and discipline. Do not always think about making quick money while ignoring risks, and forget that contracts are a marathon, not a sprint. I, Old Chen, advise everyone to understand that fluctuations in the market are normal, and there is no need to cause internal strife over temporary gains or losses. Controlling your hands, not following blindly, and strictly executing plans are much more important than frequent trading. I hope everyone can cultivate their mindset in the midst of volatility, remain calm in rise and fall, and gradually become wealthy.
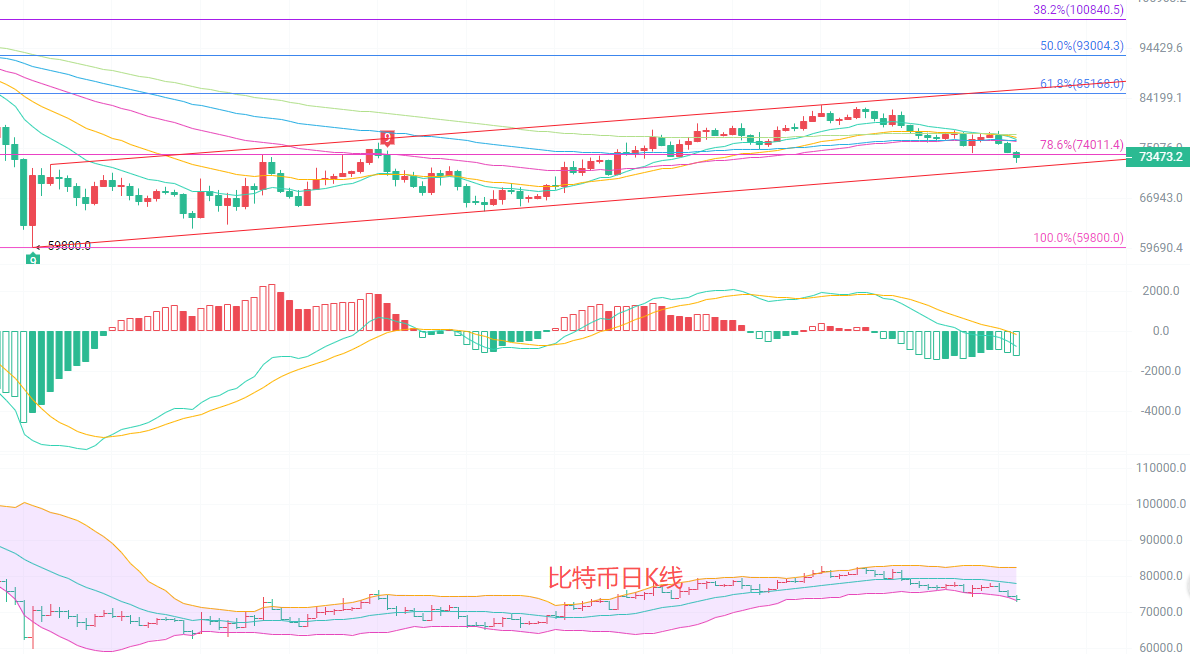
The daily K-line is testing key support. The price has broken below the upward trend line that started from 59,800 and closed below the Fibonacci 8.6% retracement level at 74,011, which is a clear sign of weakness. The EMA moving average system is arranged downward, and the price has fallen below all short- and medium-term moving averages like EMA15 and EMA30, indicating that the downward trend is still continuing. The MACD indicator's DIF is running below the DEA, with green bars continuously expanding, and the downward momentum has not yet exhausted. The Bollinger Bands' middle track at 77,954 has turned downwards, and the price has broken below the lower track support, showing short-term overselling but weak rebound, with the overall trend leaning towards a downward fluctuation.
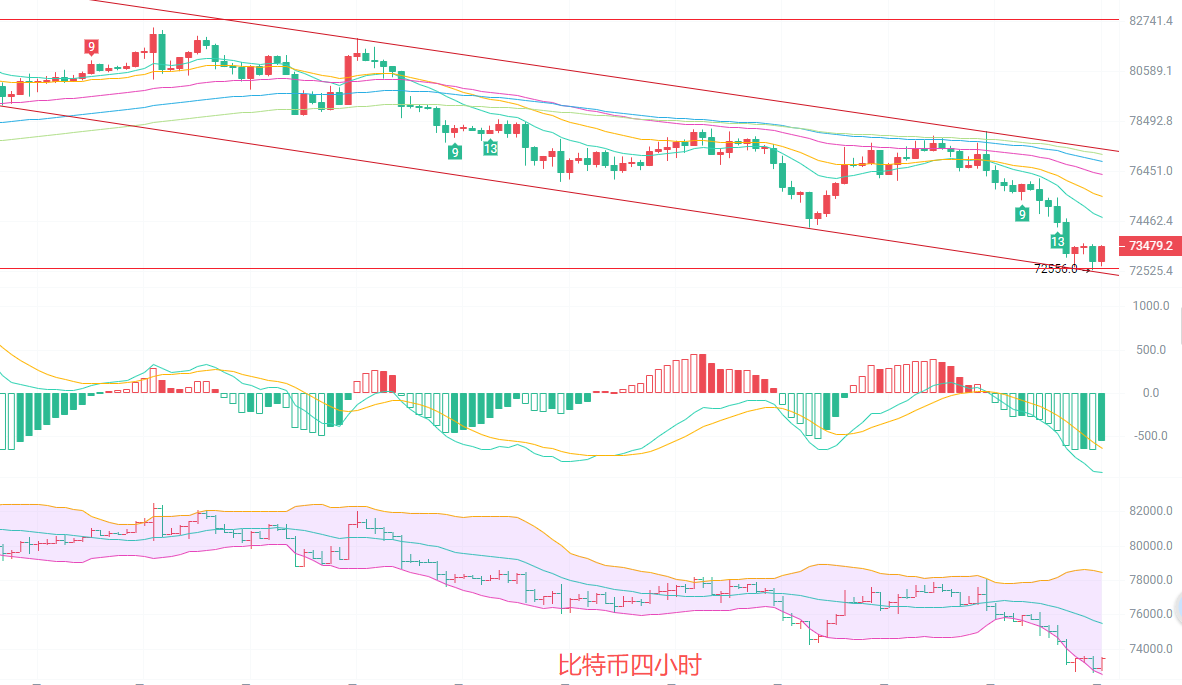
The four-hour K-line is near the lower track of the descending channel, with the price touching a low of 72,556 and currently struggling around 73,500. The EMA moving average system has all turned downward, and the price is running below all moving averages, forming a typical downward arrangement. The EMA15 and EMA30 around 74,600 are the first resistance levels, while the EMA60 around 76,600 is the second resistance level. The MACD indicators DIF and DEA are both moving downward, with green bars continuously expanding, indicating sufficient downward momentum. The lower track of the Bollinger Bands at 72,521 was briefly broken before slightly recovering, showing short-term demand for a rebound, but the pressure from the descending trend line above is obvious, limiting the rebound height, and the overall trend is still in a weak downward rhythm.
Short-term strategy reference: Follow the trend of the larger cycle, with small stop losses and quick entries and exits.
Position from 72,500 to 72,000 upward, stop loss at 71,500, target at 74,500 to 75,000.
Position from 74,500 to 75,000 downward, stop loss at 75,500, target at 72,500 to 72,000.
Specific operations are based on real-time market data. For more information, you can consult the author. The publication of the article has a delay; suggestions are for reference only and risks are self-borne.


Warm reminder: The above content can only be followed through the official account and Weibo created by the author, which can be scanned for attention. Advertisements at the end of the article and in the comments section are unrelated to the author, please be cautious in identifying them. Thank you for reading.
免责声明:本文章仅代表作者个人观点,不代表本平台的立场和观点。本文章仅供信息分享,不构成对任何人的任何投资建议。用户与作者之间的任何争议,与本平台无关。如网页中刊载的文章或图片涉及侵权,请提供相关的权利证明和身份证明发送邮件到support@aicoin.com,本平台相关工作人员将会进行核查。