Coin Wave Riding: 5.19 Ethereum (ETH) Market Analysis Reference:
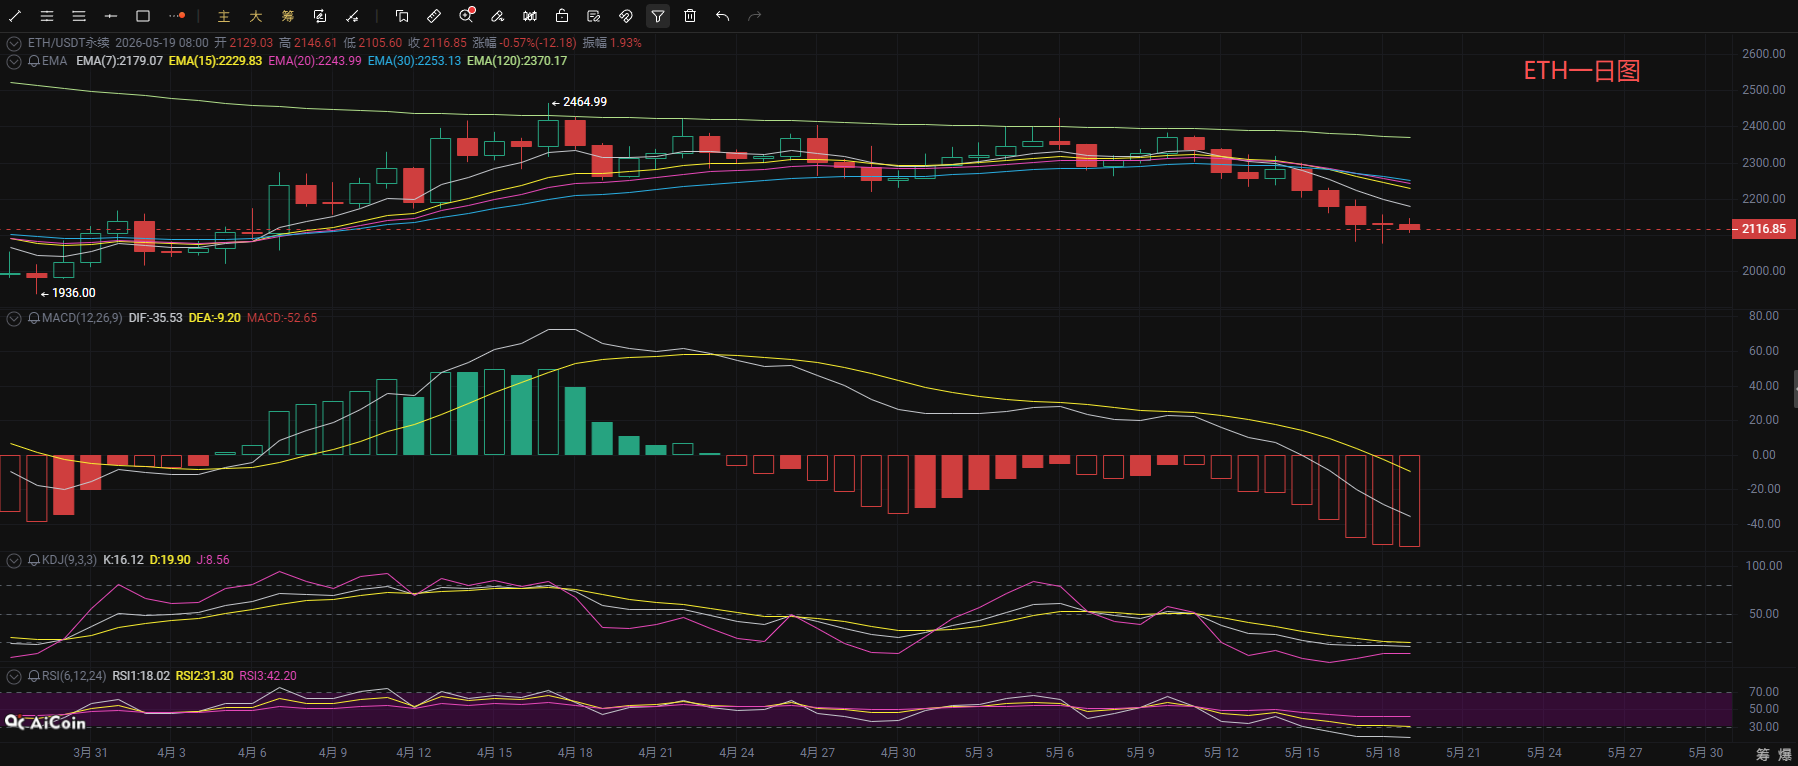
Ethereum's daily market continues to show a weak recovery. On the daily chart, the price has fallen below the previous consolidation zone and is currently operating near the lower Bollinger Band, forming a clear descending channel, with a bearish trend dominating. In the MACD indicator, the fast and slow lines have crossed below the zero axis and are diverging downwards, with the histogram not converging, indicating that the downward momentum has not fully exhausted; the KDJ indicator's K, D, and J lines are all in the oversold area below 20, and the RSI indicator has also fallen to low levels, showing serious short-term overselling. However, there is still no clear bullish crossover signal, and the EMA moving averages are in a bearish arrangement, with prices consistently under pressure from various period moving averages. The overall trend still leans towards downward movement, with only the possibility of a technical rebound. It has not yet reached a trend reversal point.
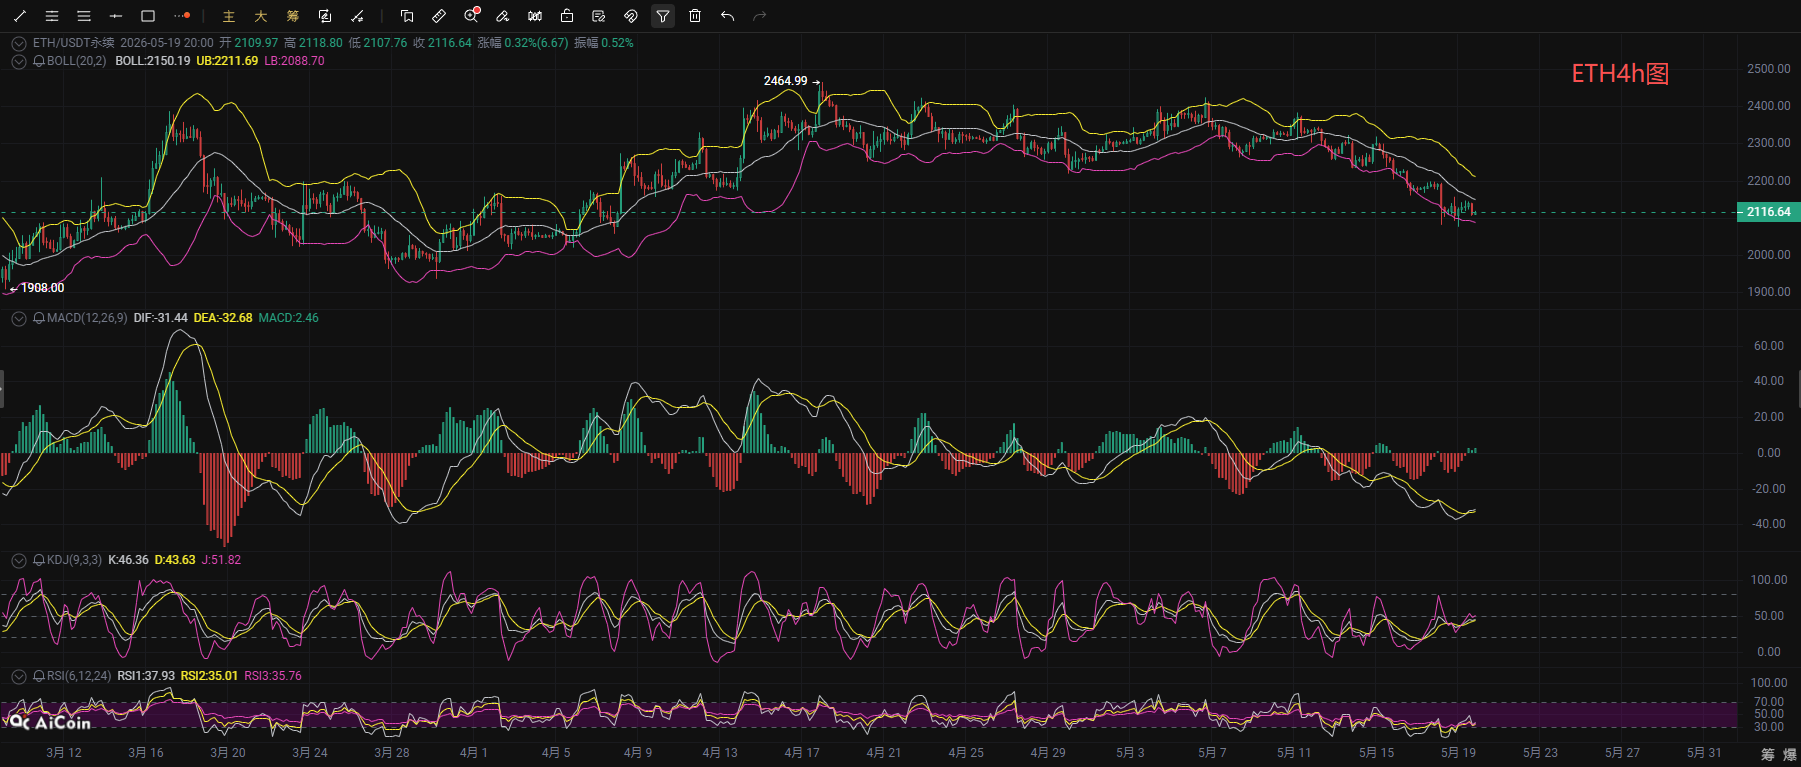
On the short-term 4-hour level, the price has gained temporary support near the lower Bollinger Band. The fast and slow lines of the MACD are located below the zero axis, with initial positive values showing, and signs of the DIF and DEA turning up from a low position, indicating that the downward momentum has slowed; the KDJ indicator has formed a bullish crossover at low levels and is diverging upwards, and the RSI indicator has also rebounded from the oversold range to around 35, with some accumulation of short-term rebound momentum. However, the price continues to operate below the EMA moving averages of all periods, and the Bollinger Band still shows a downward trend, with the bearish arrangement of moving averages not being broken. The current rebound is merely a technical correction in the downward process, with strong resistance in the 2150-2200 range. If this range cannot be broken, it is highly likely that the daily-level downward trend will continue.
Coin Wave Riding: 5.19 Ethereum Short-term Reference:
Short Position: 2180-2150 range short, stop loss 30 points, target look for 2120-2080,
Long Position: 2050-2080 range long, stop loss 30 points, target look for 2100-2150,
【The above analysis and strategies are for reference only, please bear the risk yourself. The article review and publication may have delays, and the strategies may not be timely. Do not operate blindly】

This content is originally shared by 【Coin Wave Riding】 and represents personal views only. The article may have delays in sending and is for reference only, please do not operate blindly! Want to get more daily real-time orders? Then follow my public account! Here, you can learn online technical analysis and gain knowledge about exiting positions. I have many years of research experience in the market, focusing on the major trends in the cryptocurrency sector. I mainly analyze and guide investment operations for BTC, ETH, SOL, BCH, and other coins. Welcome to study and learn together.
免责声明:本文章仅代表作者个人观点,不代表本平台的立场和观点。本文章仅供信息分享,不构成对任何人的任何投资建议。用户与作者之间的任何争议,与本平台无关。如网页中刊载的文章或图片涉及侵权,请提供相关的权利证明和身份证明发送邮件到support@aicoin.com,本平台相关工作人员将会进行核查。