According to current market data (April 27, 2026), Bitcoin (BTC) and Ethereum (ETH) present different market structures and trading logic.
Bitcoin (BTC) Market Analysis
The current Bitcoin price is around $78,100, with the overall market presenting agradual upward trend.
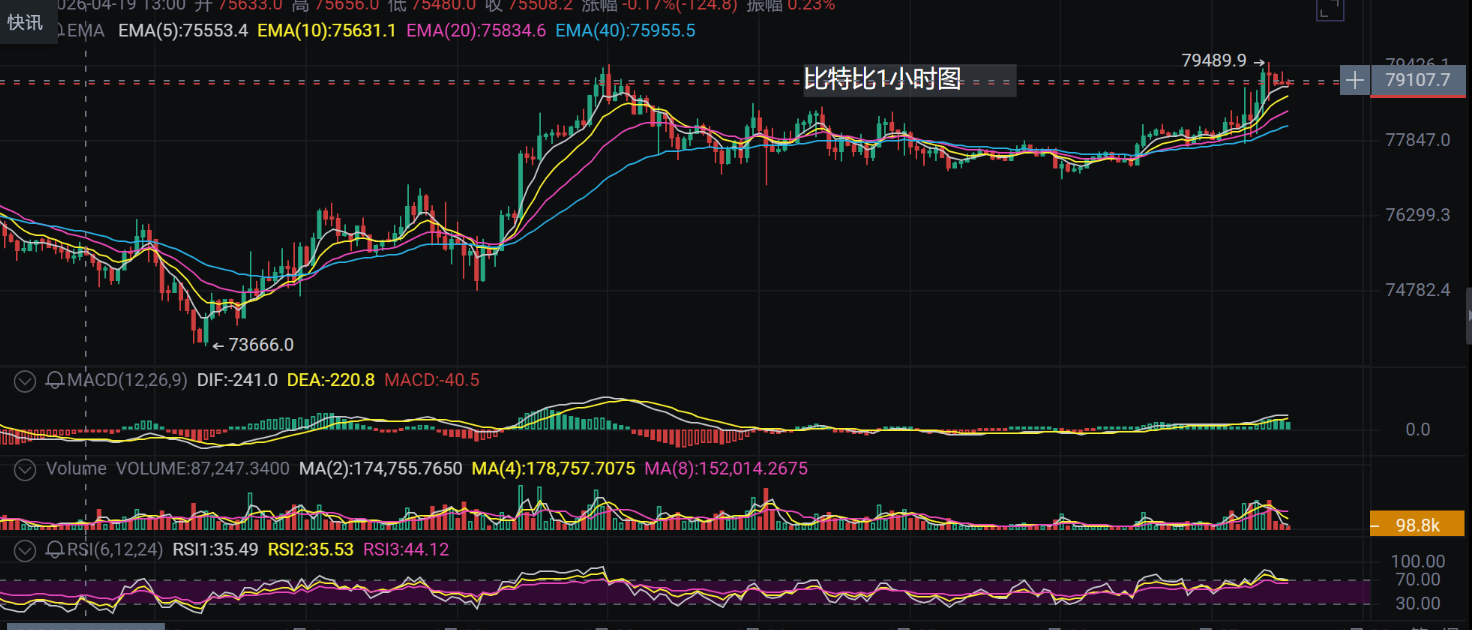
Core Logic: The spot Bitcoin ETF has recorded net inflows for nine consecutive trading days, with institutional buying continuing to provide solid support for the price. The market structure is favorable for bulls, and the trend is more likely to continue in a range-bound upwards movement rather than sharply rising or plummeting.
Market Sentiment: Despite bullish signals, the market remains cautious ahead of key resistance levels, with both bulls and bears in a standoff at high positions.
Key Resistance Reference Points
Table
Type | Price Range | Description |
|---|---|---|
Key Resistance Level | $80,000 - $82,000 | This is currently the most important psychological and technical threshold. If a breakout occurs and holds, it will open up new upside potential. |
Key Support Level | $74,000 | A critical defensive position for short-term pullbacks. |
Strong Support Level | $71,000 - $72,000 | If it breaks below $74,000, the price may consolidate within this range. |
Trading Strategy: Under the current structure, buying on dips is the main strategy. You can gradually position yourself as the price pulls back to near support levels, using a breakout above key resistance levels as a signal of trend strengthening. Be cautious of the risk of a quick drop if the resistance level fails to break.
Ethereum (ETH) Market Analysis
The current Ethereum price is around $2,395, with a 24-hour increase of about 3.5%. The market is in aconflicted situation between short-term rebounds and medium to long-term pressure.
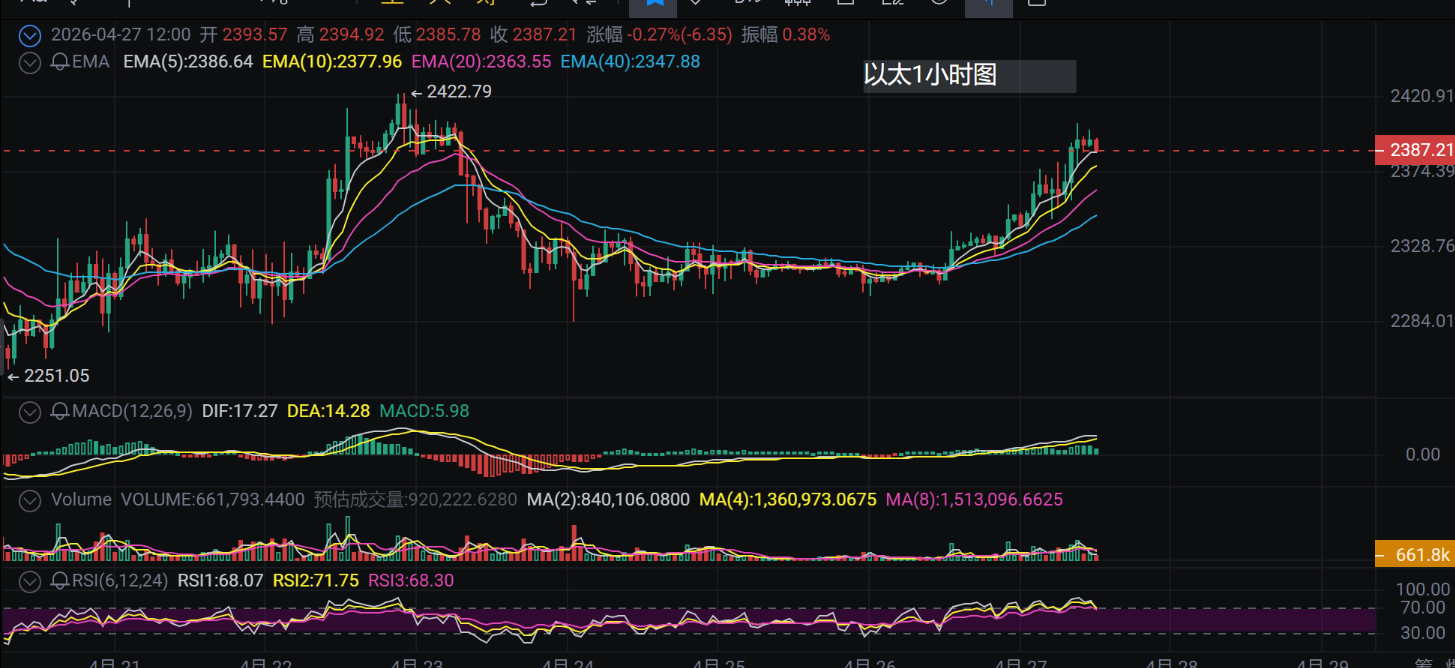
Core Logic: The core issue is whether the hourly rebound can evolve into a daily or weekly trend reversal. The market is awaiting guidance from macro events (FOMC meeting), with significant disparities between bulls and bears.
Technical Analysis: The daily level has stabilized above the middle band of the Bollinger Bands, with the MACD in the bullish zone, but the hourly level has shown overbought signals, indicating a technical pullback is needed.
Fundamentals: The Ethereum Foundation recently unlocked about 17,000 ETH, which may bring short-term selling pressure. Meanwhile, demand in the spot market is weak, and this round of rebounds is mainly driven by derivatives.
Key Support Reference Points
Table
Type | Price Range | Description |
|---|---|---|
Key Resistance Level | $2,400 - $2,500 | This is a long-term strong resistance band that includes the 200-week moving average. Failure to break through effectively may end the rebound at any time. |
Key Support Level | $2,300 | A strong support level formed by the short-term rebound. |
Strong Support Level | $2,200 | If it drops below $2,300, the price is highly likely to seek support at this level. |
Trading Strategy: Currently, the risk of chasing after the market is significant. Aggressive traders may look for short-selling opportunities near resistance levels ($2,400-$2,430), while conservative traders will wait for the price to pull back to support levels ($2,290-$2,320) and show stabilization signals before considering long positions.

The above article is exclusively planned by the analysis team of: (Warmhearted Talk about Currency), the article is delayed in sending, the content is for reference only. If you have issues with positions, locks, or want to learn more real-time analysis, please follow my public account and communicate with me. I have years of research experience in the cryptocurrency field, and everyone is welcome to learn.
免责声明:本文章仅代表作者个人观点,不代表本平台的立场和观点。本文章仅供信息分享,不构成对任何人的任何投资建议。用户与作者之间的任何争议,与本平台无关。如网页中刊载的文章或图片涉及侵权,请提供相关的权利证明和身份证明发送邮件到support@aicoin.com,本平台相关工作人员将会进行核查。