The original title: Can Liquidity Win the Battle Against the Next Phase of the Iran War? Why Bitcoin is Becoming a Reliable Liquidity Bellwether.
The original author: Joe Duarte
Translated by: Peggy, BlockBeats
Editor's note: Just as the market regained upward momentum driven by liquidity, new uncertainties have accumulated on the other end. The situation in Iran has once again become erratic, with risks in the Strait of Hormuz looming, bringing geopolitical conflicts back to the core variables of asset pricing. In just a few days, the market has shifted from a singular "fund-driven" logic to a dual game of "liquidity vs. risk events."
The current market is caught in a tug-of-war between "liquidity-driven rises" and "risk shocks brought about by escalating tensions in Iran." On one hand, the Federal Reserve and the U.S. Treasury have injected nearly $200 billion in liquidity into the financial system in a short period, rapidly pushing the stock market and risk assets to rebound; on the other hand, geopolitical uncertainties, private credit risks, and overheated sentiment keep the market vulnerable.
In this structure, the role of Bitcoin is beginning to change. Unlike traditional risk assets, it is more sensitive to changes in liquidity and often provides signals first when the funding environment shifts. Historical experience shows that whether it’s the early decline in October 2025 or the early stabilization in this rebound, Bitcoin has played a role as a "leading indicator" to some extent.
Therefore, the question is no longer just "Will the market rise?" but rather—when liquidity is still being released, and the war risks resurface, which force will dominate pricing? If funding cannot continuously hedge against external shocks, then the current rise may merely be a phase mismatch; however, if liquidity continues, the market may continue to rise amidst volatility.
Next, the key is not a single variable, but the relative strength between them. And Bitcoin may once again become the asset that provides the earliest answer.
Here is the original text:
“Oh, think twice, because today is another day for you and me in ‘paradise.’”—Phil Collins
For traders and investors, Friday was an unusual trading day. But there’s still some time until Monday, and the market has already been brewing new variables—early Saturday morning, news reported that Iran’s position on the Strait of Hormuz had reversed, which could once again trigger market turmoil.
Moreover, Friday’s rebound has pushed the market sentiment indicators (see below) to a relatively fragile position, making a market correction more likely. This has led the market into a "tug-of-war": one side is the massive liquidity injection mentioned below, while the other side is the uncertainty from the potential reversal of the Iran war situation.
What Just Happened?
The impact of liquidity on the market is facing a test—the opponent is the potentially escalating volatility from the Iran war.
Question: What happens if approximately $200 billion flows into the financial system almost simultaneously?
Answer: Asset prices experience a dramatic "melt-up."
Recently, I have been focusing on four common factors suppressing the stock market: the Iran war, liquidity tightening in the financial system since January of this year, widespread pessimism in the market, and insufficient understanding of the real conditions in the private credit market.
However, last week, these factors were almost "entirely overturned": the liquidity tightening reversed, the Iran situation seemed to ease, and the pessimism in the market was once again validated—it is often a leading indicator for potential rebounds in the stock market.
Have we escaped the peril? No one can be certain, as the Iran situation is heating up again. Furthermore, if investors revert to "panic mode," liquidity may dry up again. And what exactly is happening in the private credit market remains unclear to us.
For now, let's focus on a relatively observable variable: liquidity.
Dual "Liquidity Tsunami"
If you're wondering where the funds that have propelled the stock market up over the past two weeks came from—think again: the answer is the Federal Reserve and the U.S. Treasury. Together, around April 15, they injected approximately $200 billion into the financial system, providing traders with a "tax day buffer."
First, let’s look at the first "gun barrel"—the Federal Reserve.
On April 15, the Federal Reserve injected nearly $11 billion into the market through repurchase (Repo) operations (via Treasury securities and mortgage-backed securities). This alone is not insignificant, but more crucially, the Fed is still injecting about $40 billion per month into the market through its Reserve Management Purchase Program (RMP).
What’s truly noteworthy is the second "gun barrel"—the U.S. Treasury.
According to analysis by Garret Baldwin, the U.S. Treasury injected around $140 billion to $200 billion into the market during the same period. In other words, roughly speaking, without any formal quantitative easing (QE) announcement, the Fed and Treasury quietly injected nearly $240 billion in liquidity into the market.
It’s not hard to understand why the stock market exploded upward.
The More Covert Part: Treasury's Operations
How did the Treasury carry out this "covert operation"?
The key lies in one account—the "General Account" (TGA) held at the Federal Reserve. When the balance of this account rises, it generally indicates liquidity tightening; when the balance falls, it indicates liquidity release.
According to Garret’s calculations, the balance of the U.S. government’s "checking account" at the Fed decreased from about $837 billion before tax day to about $697 billion. However, it rebounded again to about $924 billion on April 15.
The critical point is that about $140 billion had already flowed into the banking system before tax day, meaning that the financial system was essentially in a "plentiful liquidity" state before April 15.
Interestingly, the National Financial Conditions Index (NFCI), which is tracked weekly in this report, has reversed its previous tightening trend in the latest data (April 10).
We pointed out this change in the Daily Report of "Smart Money Passport": "On that day, the Federal Reserve injected about $10.5 billion into the financial system, while the NFCI index dropped for the first time since January 23, 2026. These two signals combined may indicate that the Fed has adjusted its stance on liquidity tightening."
The next big suspense is: can liquidity dominate, or will a new round of escalation in the Iran war become the core variable in the market again?
Bitcoin Begins to "Activate": Why It Is the Liquidity Barometer
The movement of Bitcoin going forward is crucial.
Because compared to stocks, Bitcoin is more sensitive to liquidity. Therefore, its recent performance after breaking $75,000, and whether it can challenge the $80,000–85,000 range, deserves close attention.
From a technical perspective, the resistance in the $80,000–85,000 range is not strong. The volume profile (VBP) in this range is sparse, indicating that no effective support was formed during the previous decline. Therefore, under normal circumstances, this position should not represent a strong resistance during price recovery.
If the market fails here, it indicates two points: first, the market lacks confidence in this rebound; second, there may be issues with the liquidity itself. More importantly, if Bitcoin cannot break through this key range, it may indicate that this "liquidity tsunami" generated by the Fed and Treasury is rapidly dissipating.
If $200 billion in bank reserves is absorbed by the market within just a few weeks, it will be a dangerous signal. This may indicate that private credit markets or other external risks are accumulating.
Don’t forget, the drop in Bitcoin in October 2025 accurately predicted the difficulties in the stock market in 2026. At the same time, Bitcoin also stabilized weeks before the stock market bottomed out and rebounded ahead of the liquidity release from the Fed and Treasury.
In the current context of the ongoing evolution of the Iran situation and the global risks that have yet to dissipate, any weakening of Bitcoin should not be overlooked.
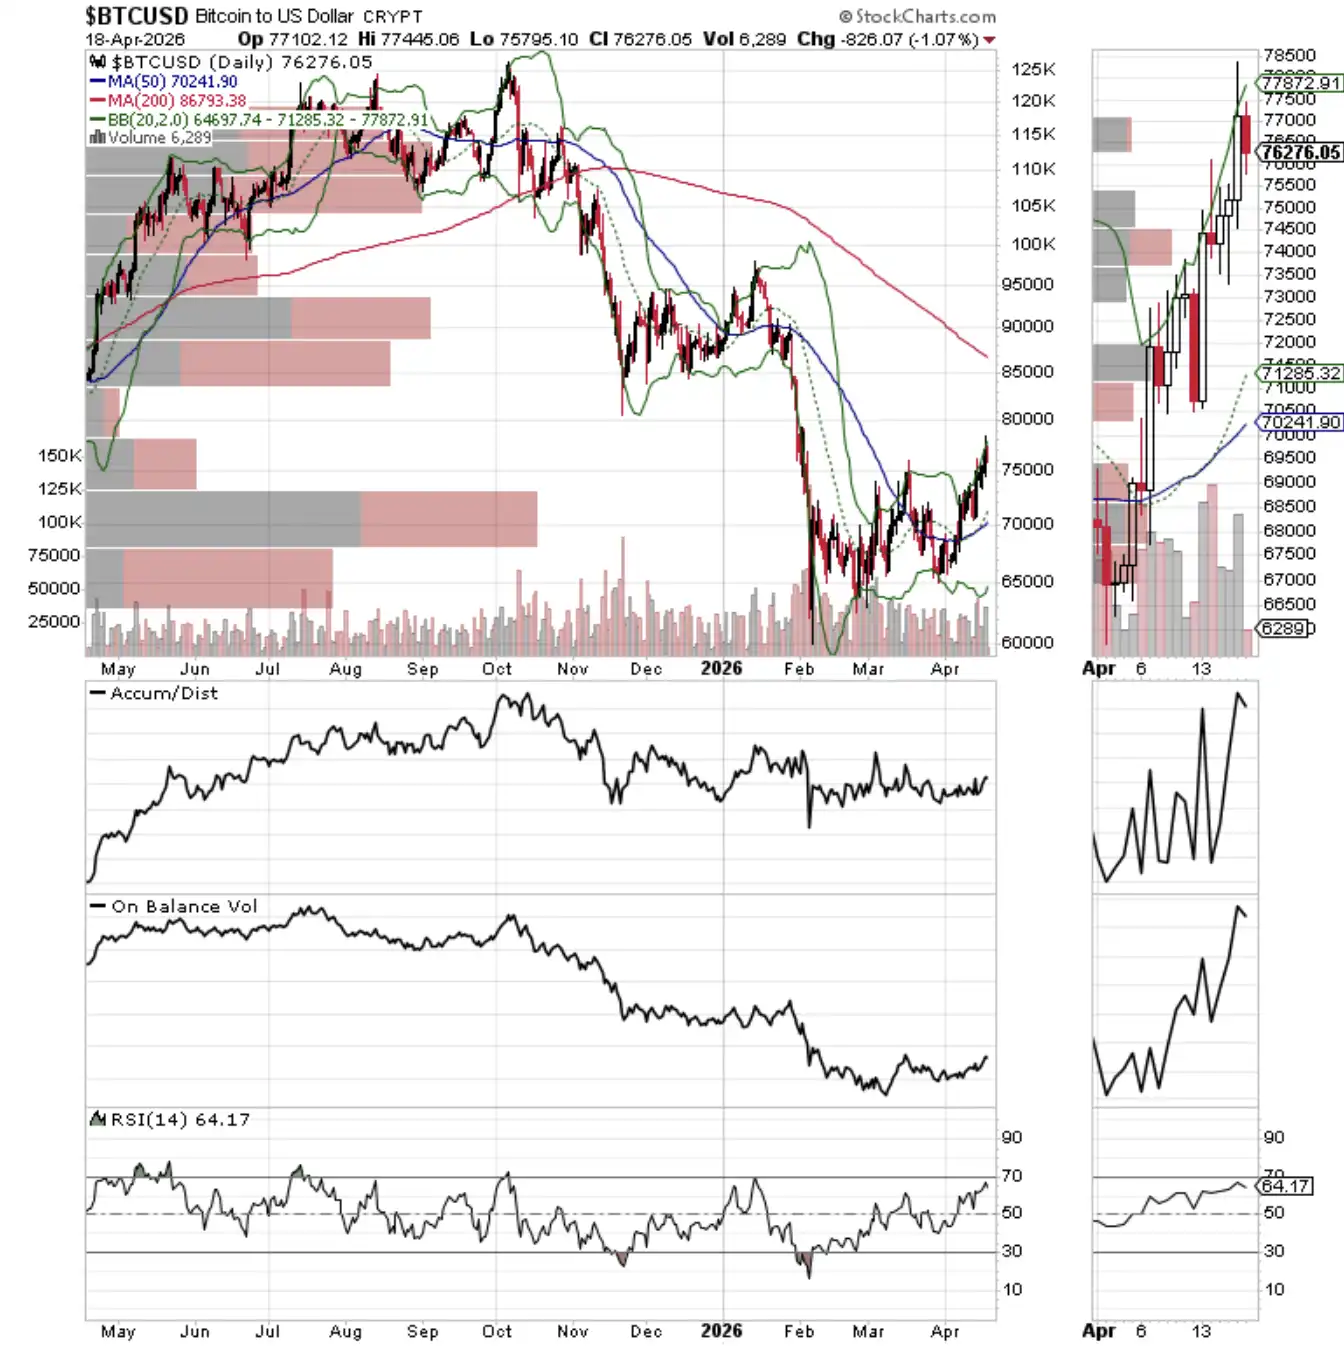
The $70,000–75,000 range is a key support level.
Sentiment Summary: The Market Suddenly Turns Optimistic
The CNN Fear & Greed Index (GFI) closed at 68 on April 17, 2026, in the "Greed" range.
The fear and greed index for the crypto market from CoinMarketCap was 59 on Saturday morning, indicating a relatively high "Neutral" level.
The Chicago Board Options Exchange (CBOE) composite put/call ratio is 0.65, with the P/C ratio of index options closing at 0.82. The current sentiment in the options market remains neutral, but as bullish sentiment rapidly heats up, it is gradually tilting towards bearish territory.
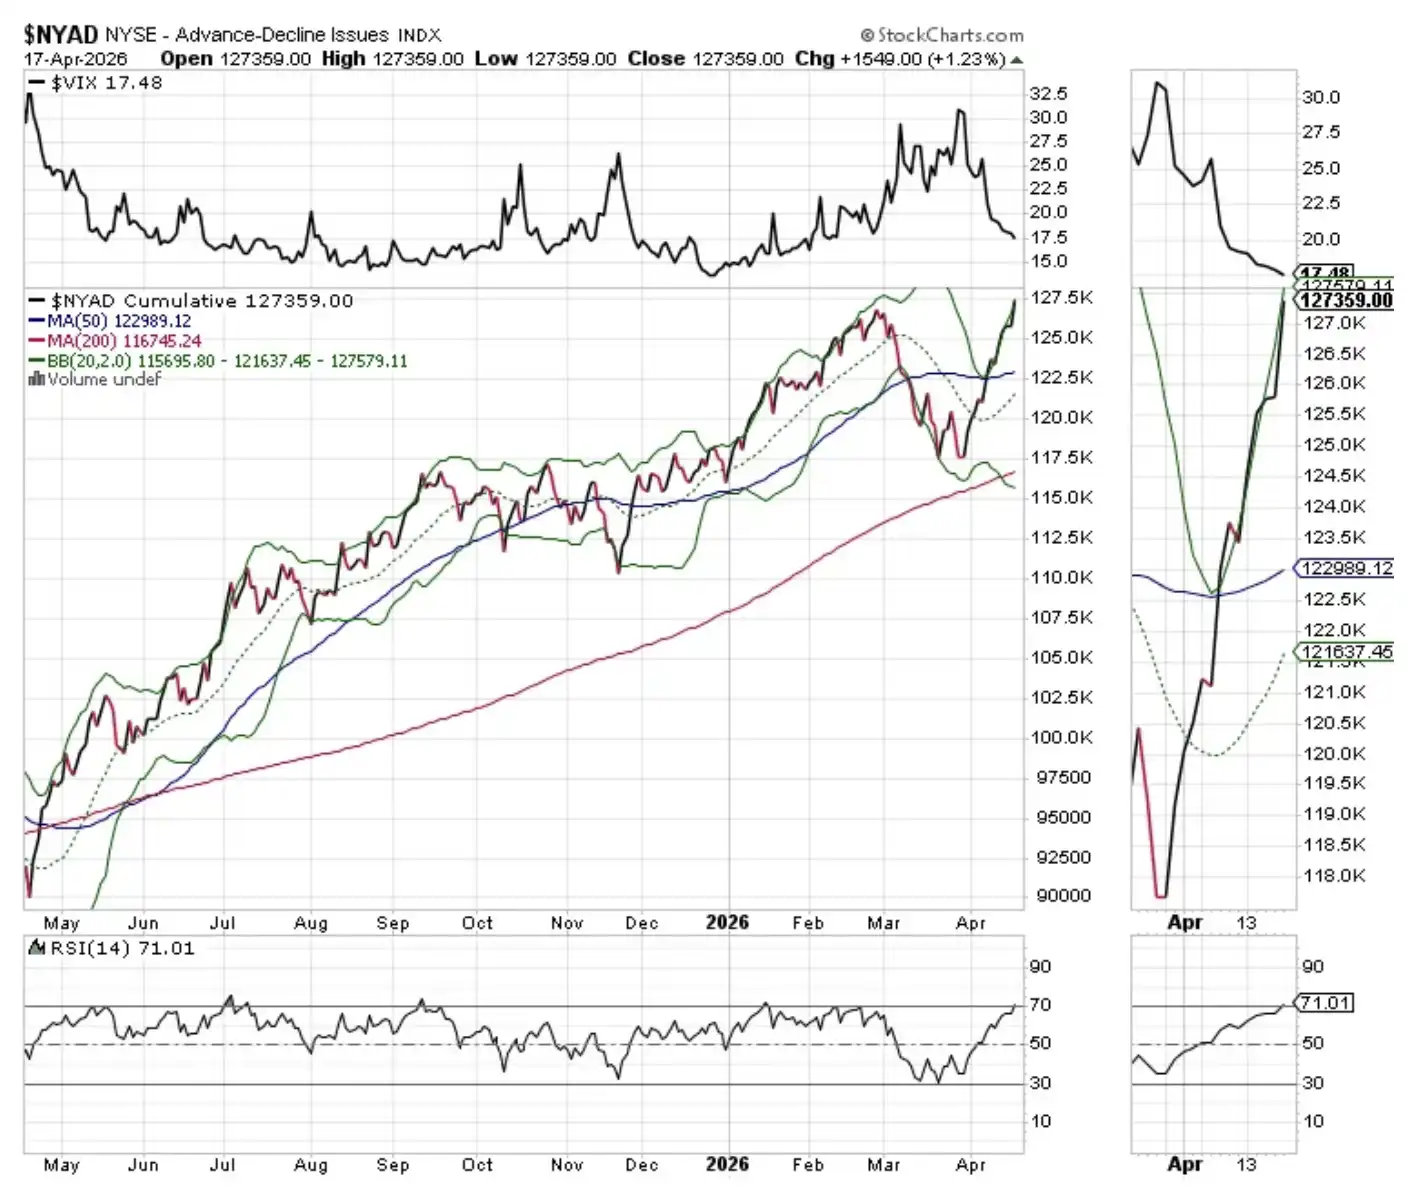
The CBOE Volatility Index (VIX) closed at 17.48, which is a relatively positive level. However, in the short term, it may rise again above 20 (which is usually seen as a risk alert line).
It should be noted that the VIX typically rises when traders buy a large number of put options. The rising demand for put options forces market makers to hedge by selling index futures, which can create downward pressure on the market.
Conversely, when the VIX falls, it indicates a decrease in demand for put options, market sentiment turns optimistic, and subsequently, there tends to be more buying of call options. This prompts market makers to buy index futures to hedge risks, thereby increasing the probability of stock market rises.
Liquidity Observation
1. Positive: Liquidity is easing
The National Financial Conditions Index (NFCI) released by the Federal Reserve had a latest reading of -0.47 on March 27, 2026 (released on April 10), further declining from the previous week’s -0.44, indicating that financial conditions are easing, and liquidity is improving.
A decline in the NFCI is generally viewed as a bullish signal, and a negative index indicates that market liquidity is in a relatively ample state.
2. Bond yields retreat
U.S. Treasury yields have retreated in the later part of this week, but with the development of the Iran situation, they may rise again in the future.
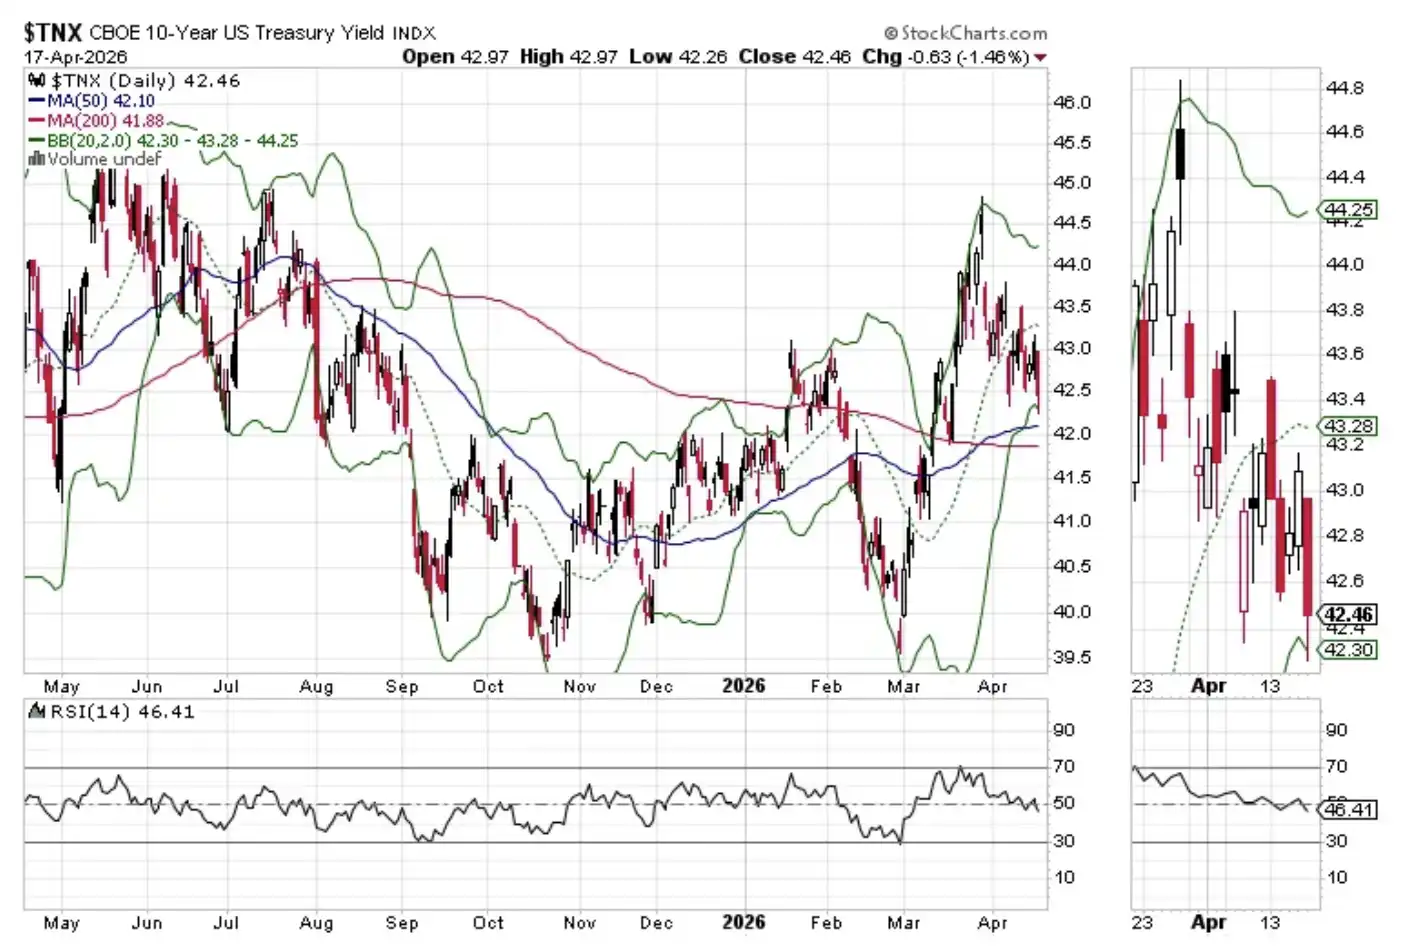
U.S. 10-Year Treasury Yield closed below 4.3% this week, having also fallen below its 20-day moving average. If it falls further below the 200-day average, it will be considered a bullish signal; conversely, if it rises above 4.5%, it may push yields back to around the 4.6% peak seen in May 2025.
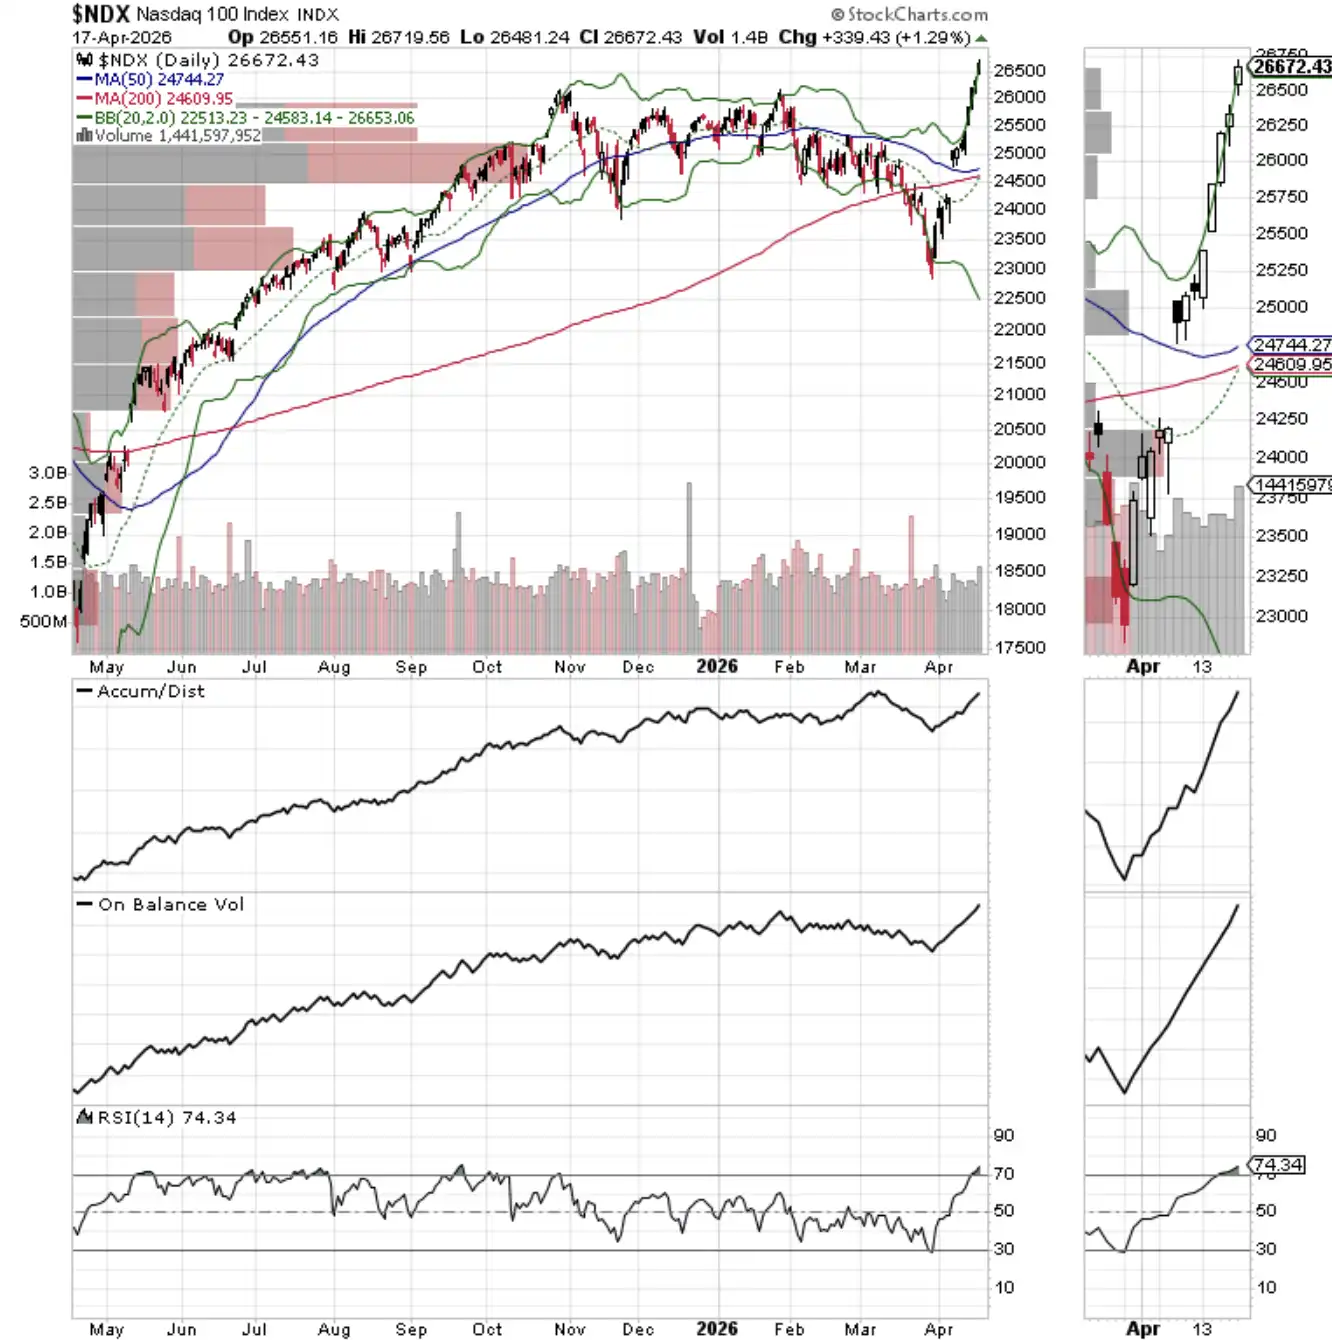
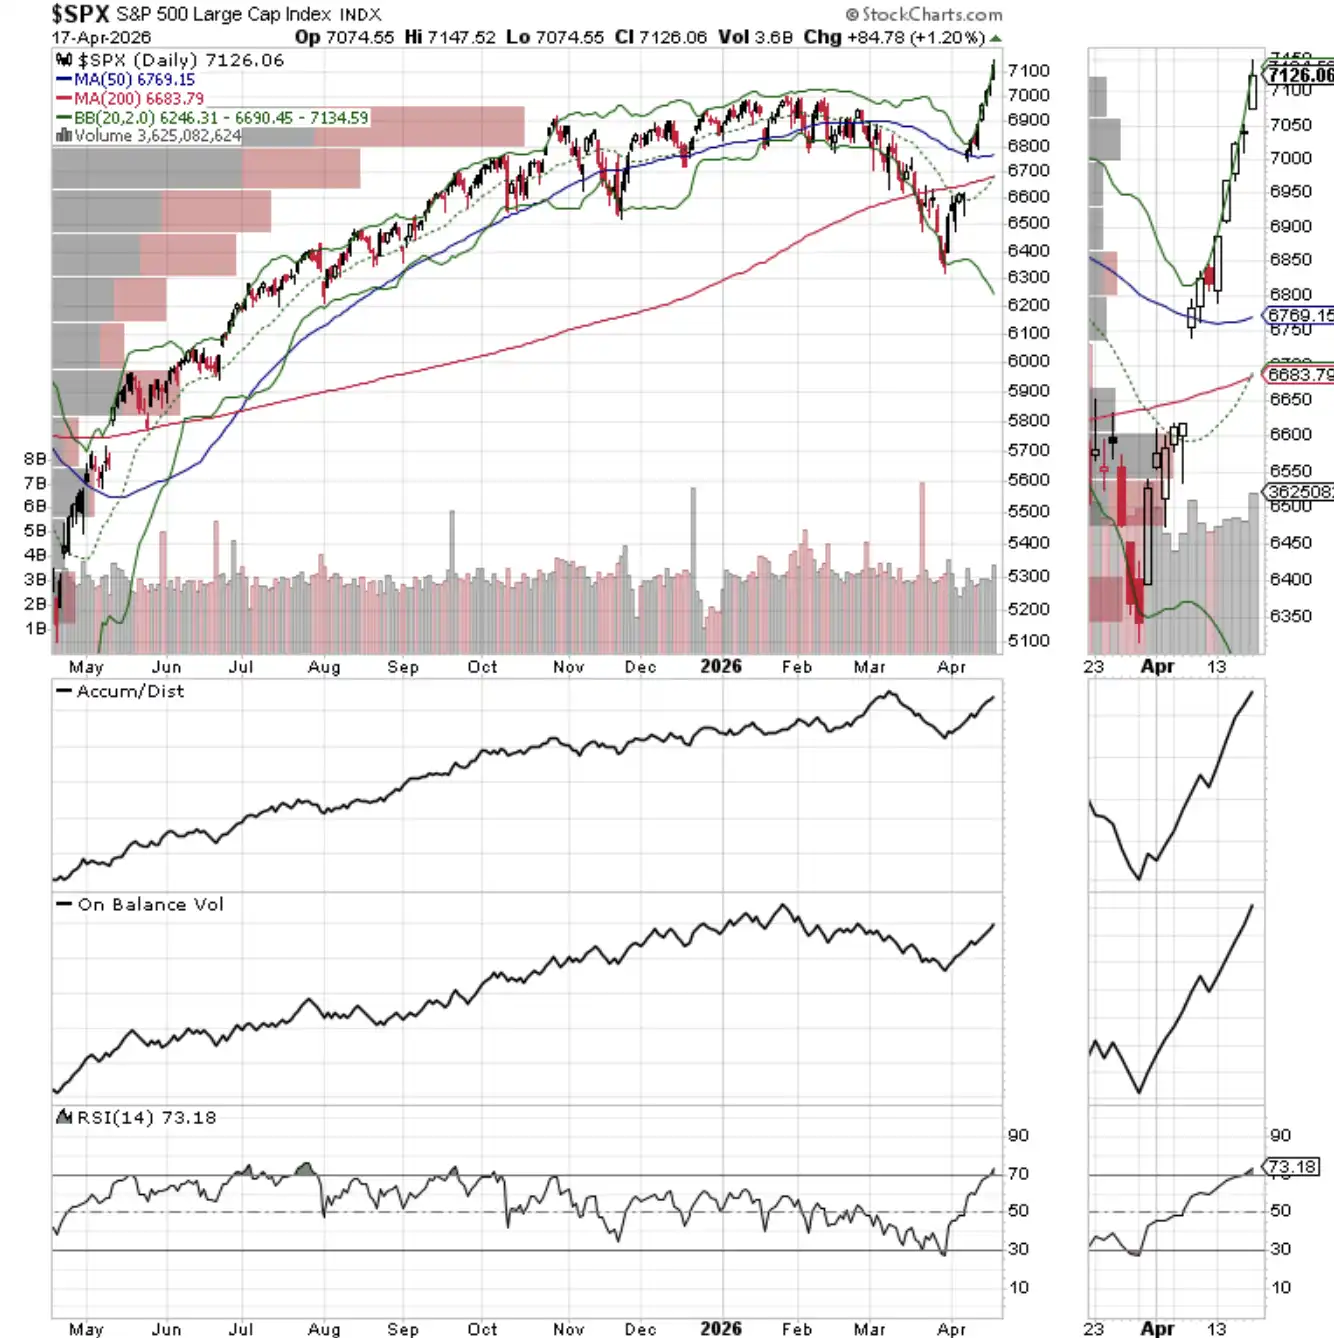
3. NYAD, SPX, and NDX all reached new highs in sync
The NYSE Advance-Decline Line reached a new high, refreshing highs in sync with the S&P 500 Index and NASDAQ-100 Index, forming a confirmation signal.
The current upward trend is validated—but only temporarily. Once it falls below the 20-day or 50-day moving average, the market situation may change rapidly.
The NASDAQ-100 Index reached a new high last week, with 26,000 points currently serving as a short-term support level.
The S&P 500 Index reached a new high last week and broke the 7,000 points mark. 7,000 points is currently a short-term support level.
[Link to the original article]
免责声明:本文章仅代表作者个人观点,不代表本平台的立场和观点。本文章仅供信息分享,不构成对任何人的任何投资建议。用户与作者之间的任何争议,与本平台无关。如网页中刊载的文章或图片涉及侵权,请提供相关的权利证明和身份证明发送邮件到support@aicoin.com,本平台相关工作人员将会进行核查。


