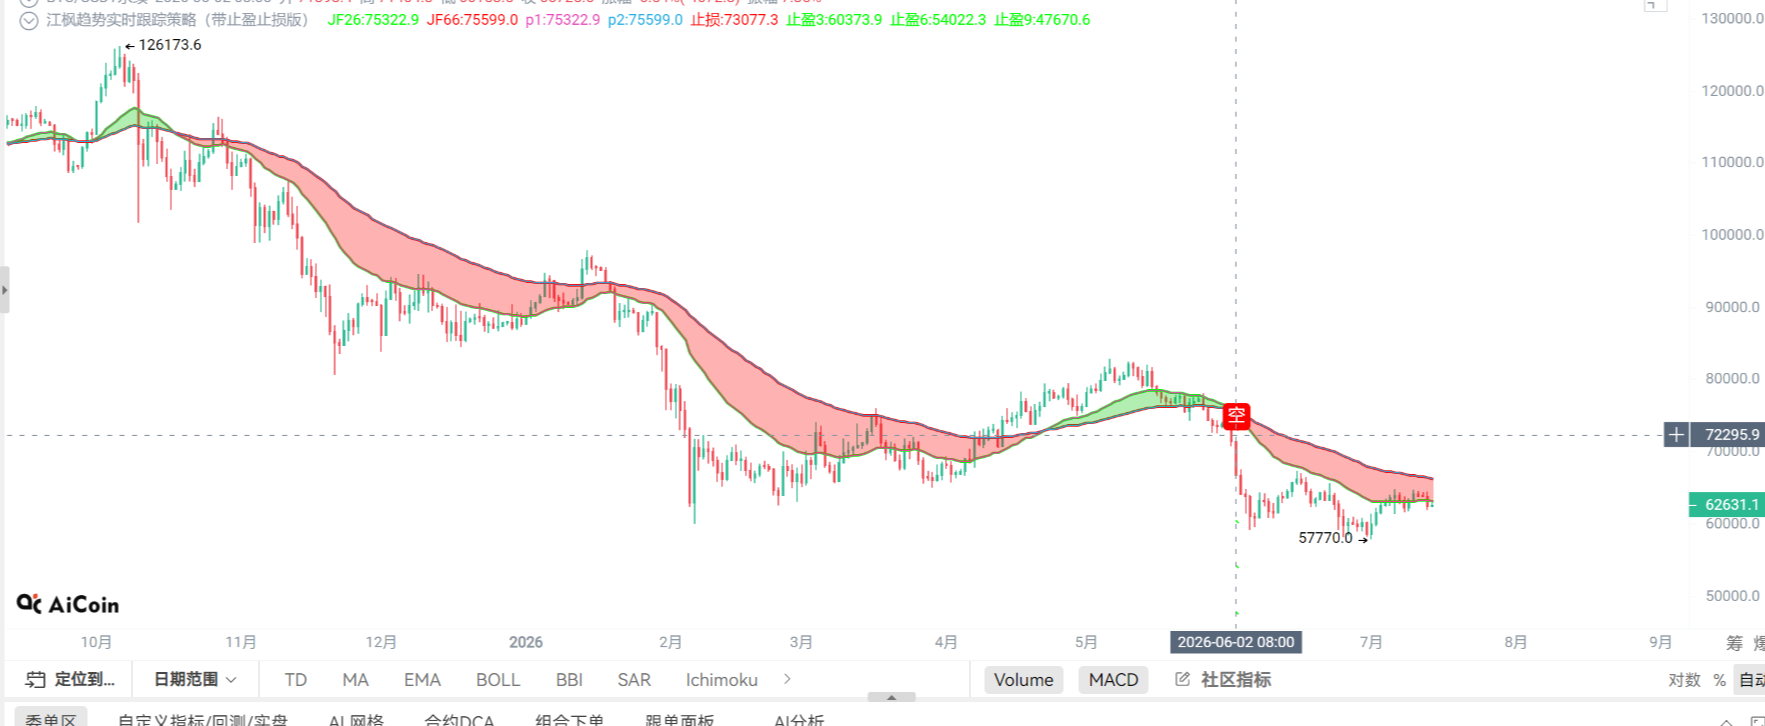
北京时间晚间十点左右,大盘走势急转直下,比特币遭遇强大阻力,迅速跌破74000美元整数关卡,最低一度下探至73300美元左右。与此同时,以太坊也未能幸免,跟随大盘跳水并失守2300美元的重要心理支撑位,市场情绪瞬间从乐观为谨慎。
这波突如其来的急跌行情,让许多看多后市、来不及撤退的合约投资人闪避不及,衍生品市场再次爆发大规模的清算潮。在过去24小时内,加密货币全网共有有高达13.7万人惨遭爆仓。爆仓总金额直线飙升至3.5亿美元,显示市场空头反扑的力道极为强劲,多头部位成为主要受灾户。
比特币四小时图
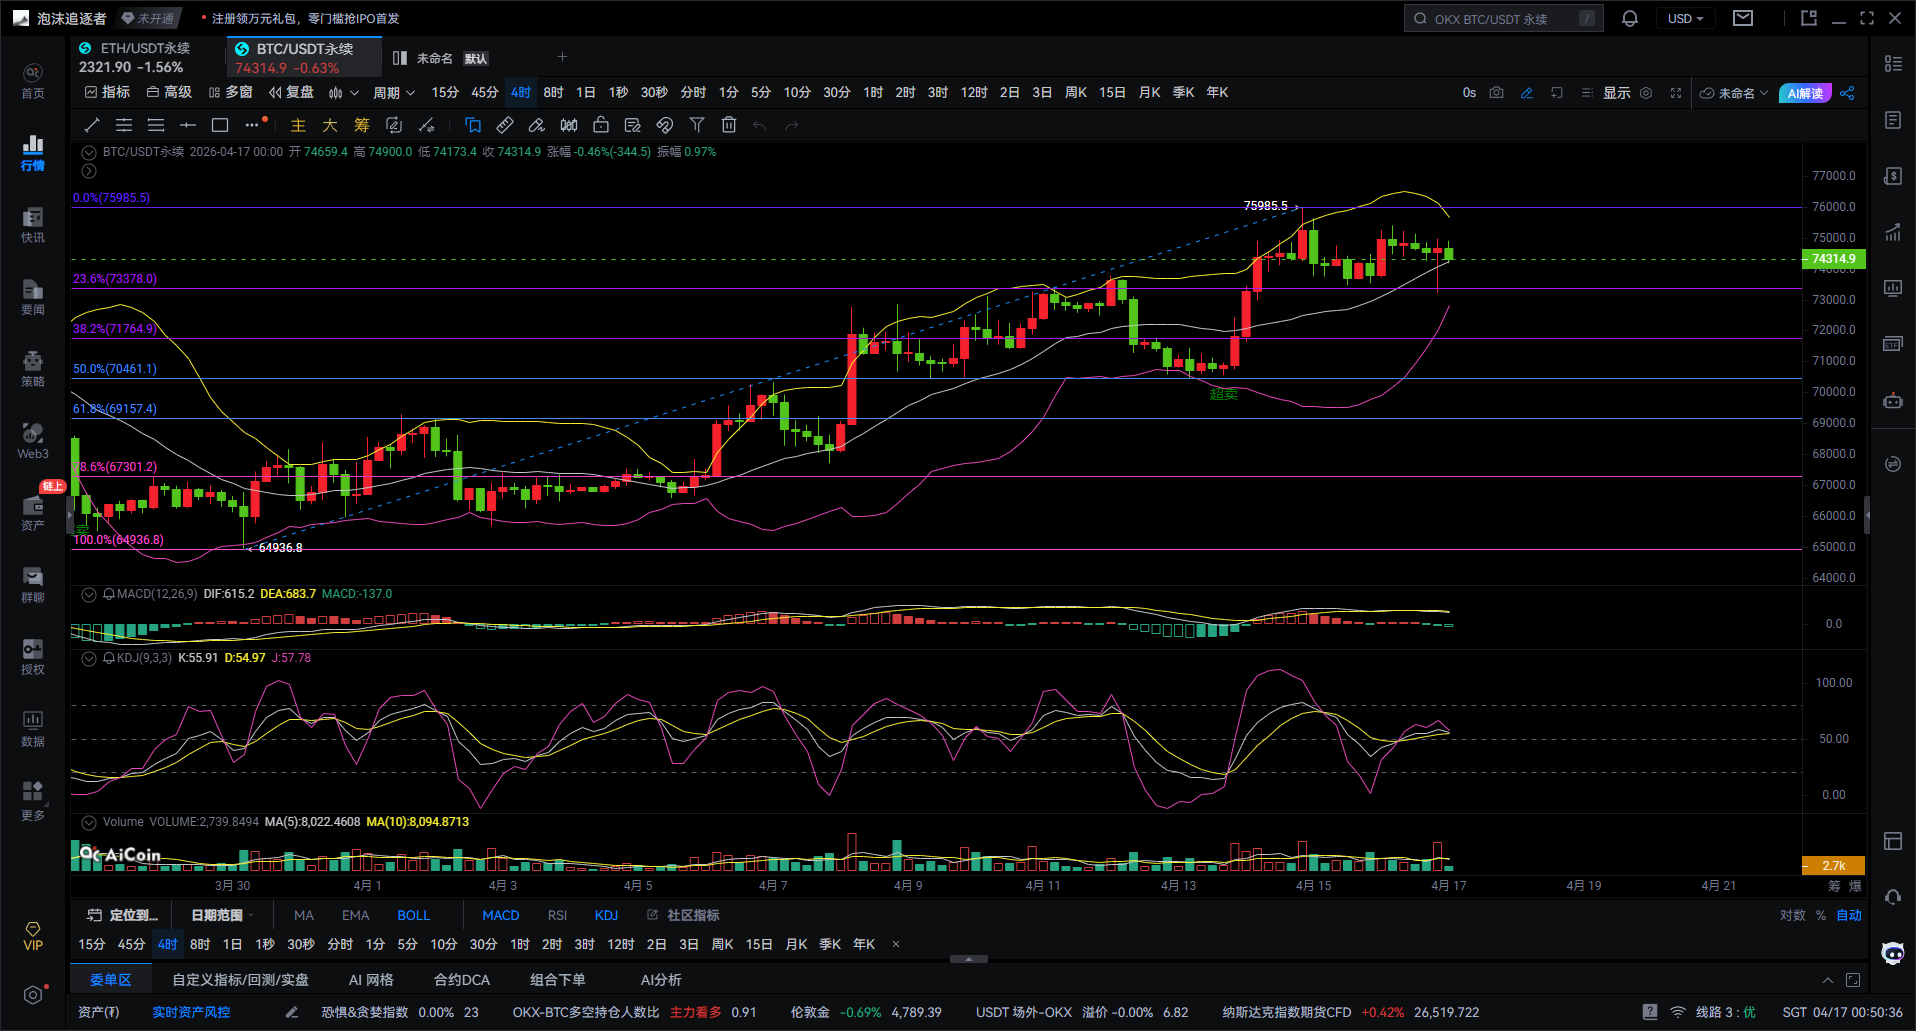
比特币眼下这架势,属于在高位横着不动,积蓄力量呢。大的方向还是看涨,但短线价格有点高,有往下踩一脚的需求。说白了就是,大趋势没毛病,但短线别急着追高,要么等它回踩下来,要么等它明确冲上去再说。
最关键的,咱得看斐波那契那几条线。从前面低点64936拉到高点75985这一段画出来。现在价格在74314附近晃悠。它现在卡在哪儿呢?就在0.236的回踩位73778的上边一点点横盘。这透露了一个信号:在强势行情里,回调往往很浅,主力不愿意让价格掉太低,便宜了散户。上边的压力就是前高75985,下边的支撑先看73778(0.236),强一点看71765(0.382),再往下70461(0.5)那是更强的支撑。
再看布林带,中轨线翘着头往上走,价格稳稳站在中轨上面,这是好现象,说明上涨的趋势骨架还在。不过呢,上轨线开始往中间收了,这叫收口。意味着波动变小了,市场在憋劲,准备选方向了。收口之后通常就两条路:要么放量往上冲,去挑战前高76000;要么撑不住跌穿中轨,往下回踩73000-71700这个区间。
MACD指标上,MACD红色柱状图越来越短,DIF和DEA两条线在高位都快粘到一起了。这说明上涨的劲儿在减弱,市场进入一个休息调整的阶段。这倒不是说要见顶大跌了,但明白告诉你:现在不是你舒服追着买的时候,反而是应该耐心等价格回踩下来再考虑接的位置。
KDJ指标,三条线在50附近缠缠绵绵,J值稍微有点抬头向上的意思。这反映了当下多空双方势均力敌,但多头稍微占那么一点点上风。
综合来看,大仙预判接下来更可能分两步走。第一阶段:先在74000-74800这个小区间里震荡,洗洗盘,把不坚定的筹码抖搂出去。第二阶段:震荡完了,就得选择方向了。
偏强的剧本(我觉得概率高一些):如果能站稳74500,那就有机会往上冲,先看75200,再看76000那个前高压力位。
偏弱的剧本:如果跌破了73700这个关键位,那可能会往下回踩,目标先看73000,再看71700。
说到实战策略,大仙给你支两招。做多方案是优先考虑的:一是等回踩到73700附近,出现企稳迹象了再做多,止损放在73200,目标看74800或者75900。二是如果价格强势突破74800并且站稳了,可以跟着趋势追多。做空方案呢,只适合短线老手轻仓尝试:如果价格冲到74800到76000这个区域却攻不上去,并且在更小周期的图(比如15分钟)上出现转弱信号,可以考虑轻仓空一下,目标看回73700。
那现在74300这个位置能不能动手?大仙直说:这不是最优的追多点。做多的话,潜在盈利和风险的比例不算很划算;做空呢,又是逆着大趋势,风险不小。
最后大仙一句话总结:真正的高手不是天天都在市场里杀进杀出,而是只在自己有优势、赔率合适的位置才出手。现在最优的策略就是:耐心等回踩到73700附近低吸,或者等明确突破74800后再追击。

给你一个百分百准的建议,不如给你一个正确的思路与趋势,授人与鱼不如授人与渔,建议赚一时,思路学会赚一生!
撰稿时间:(2026-04-17,00:50)
(文-大仙说币)特此申明:网络发布具有延迟,以上建议仅供参考。投资有风险,入市需谨慎!
免责声明:本文章仅代表作者个人观点,不代表本平台的立场和观点。本文章仅供信息分享,不构成对任何人的任何投资建议。用户与作者之间的任何争议,与本平台无关。如网页中刊载的文章或图片涉及侵权,请提供相关的权利证明和身份证明发送邮件到support@aicoin.com,本平台相关工作人员将会进行核查。