Our research institute officially opens the indicators class, and today is the first lecture!
If everyone feels that the content is practical and wants to learn more indicator skills, we will continue to update, helping everyone thoroughly understand technical analysis.
Whether it's cryptocurrency trading or US stocks, MACD is known as the king of indicators. Mastering it means you have a basic understanding of technical analysis, and you'll be able to confidently take center stage when discussing investment in the future.
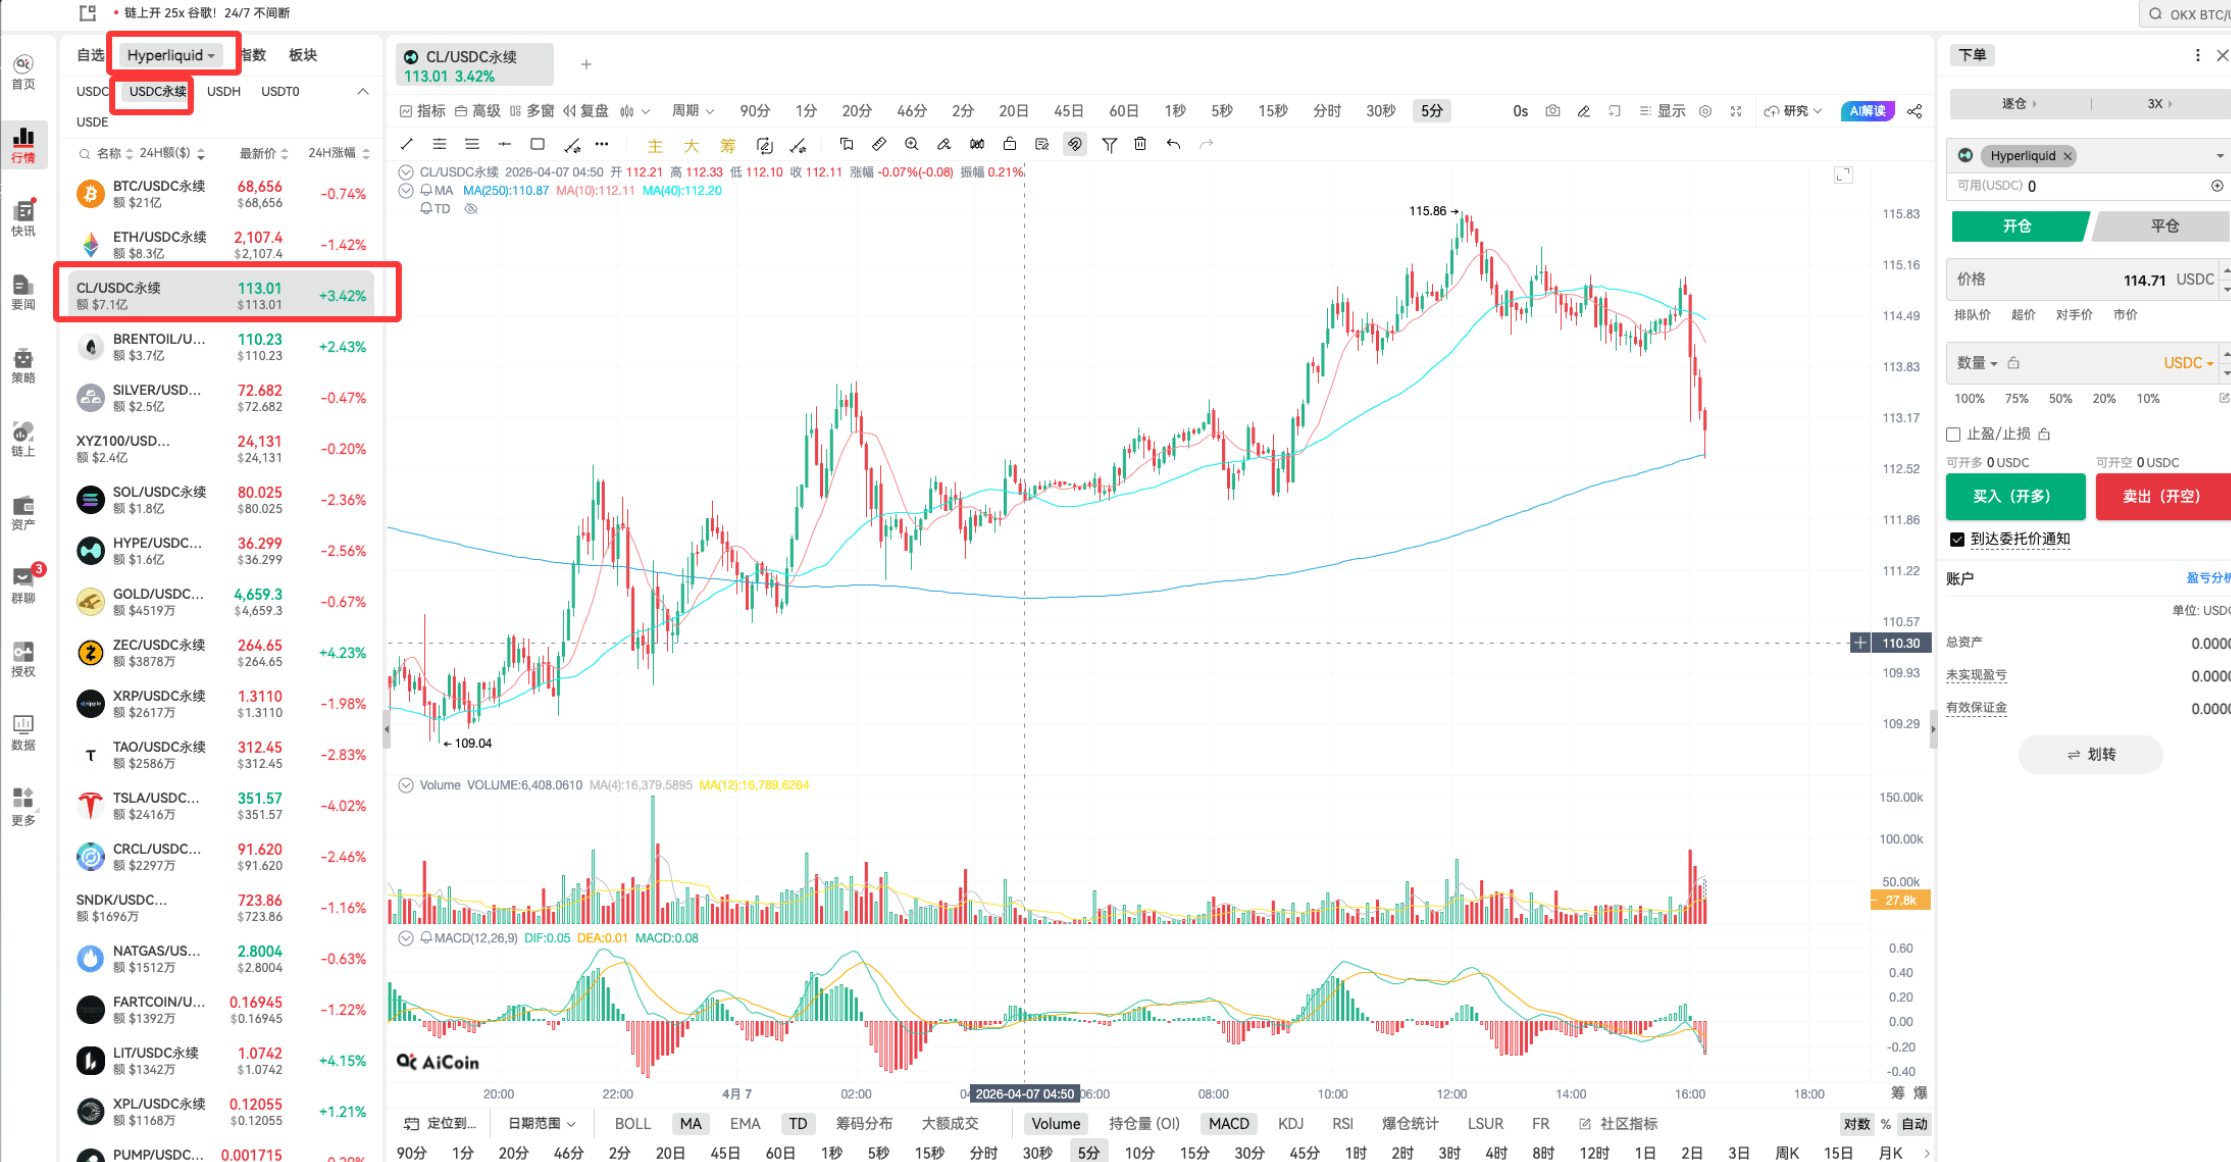
Let's start with the basics of MACD. You can directly open the oil K-line chart on Hyperliquid, and we will analyze it in real-time, learning as we go.
The reason for choosing US oil is that this commodity currently has the highest popularity and the most active capital participation.
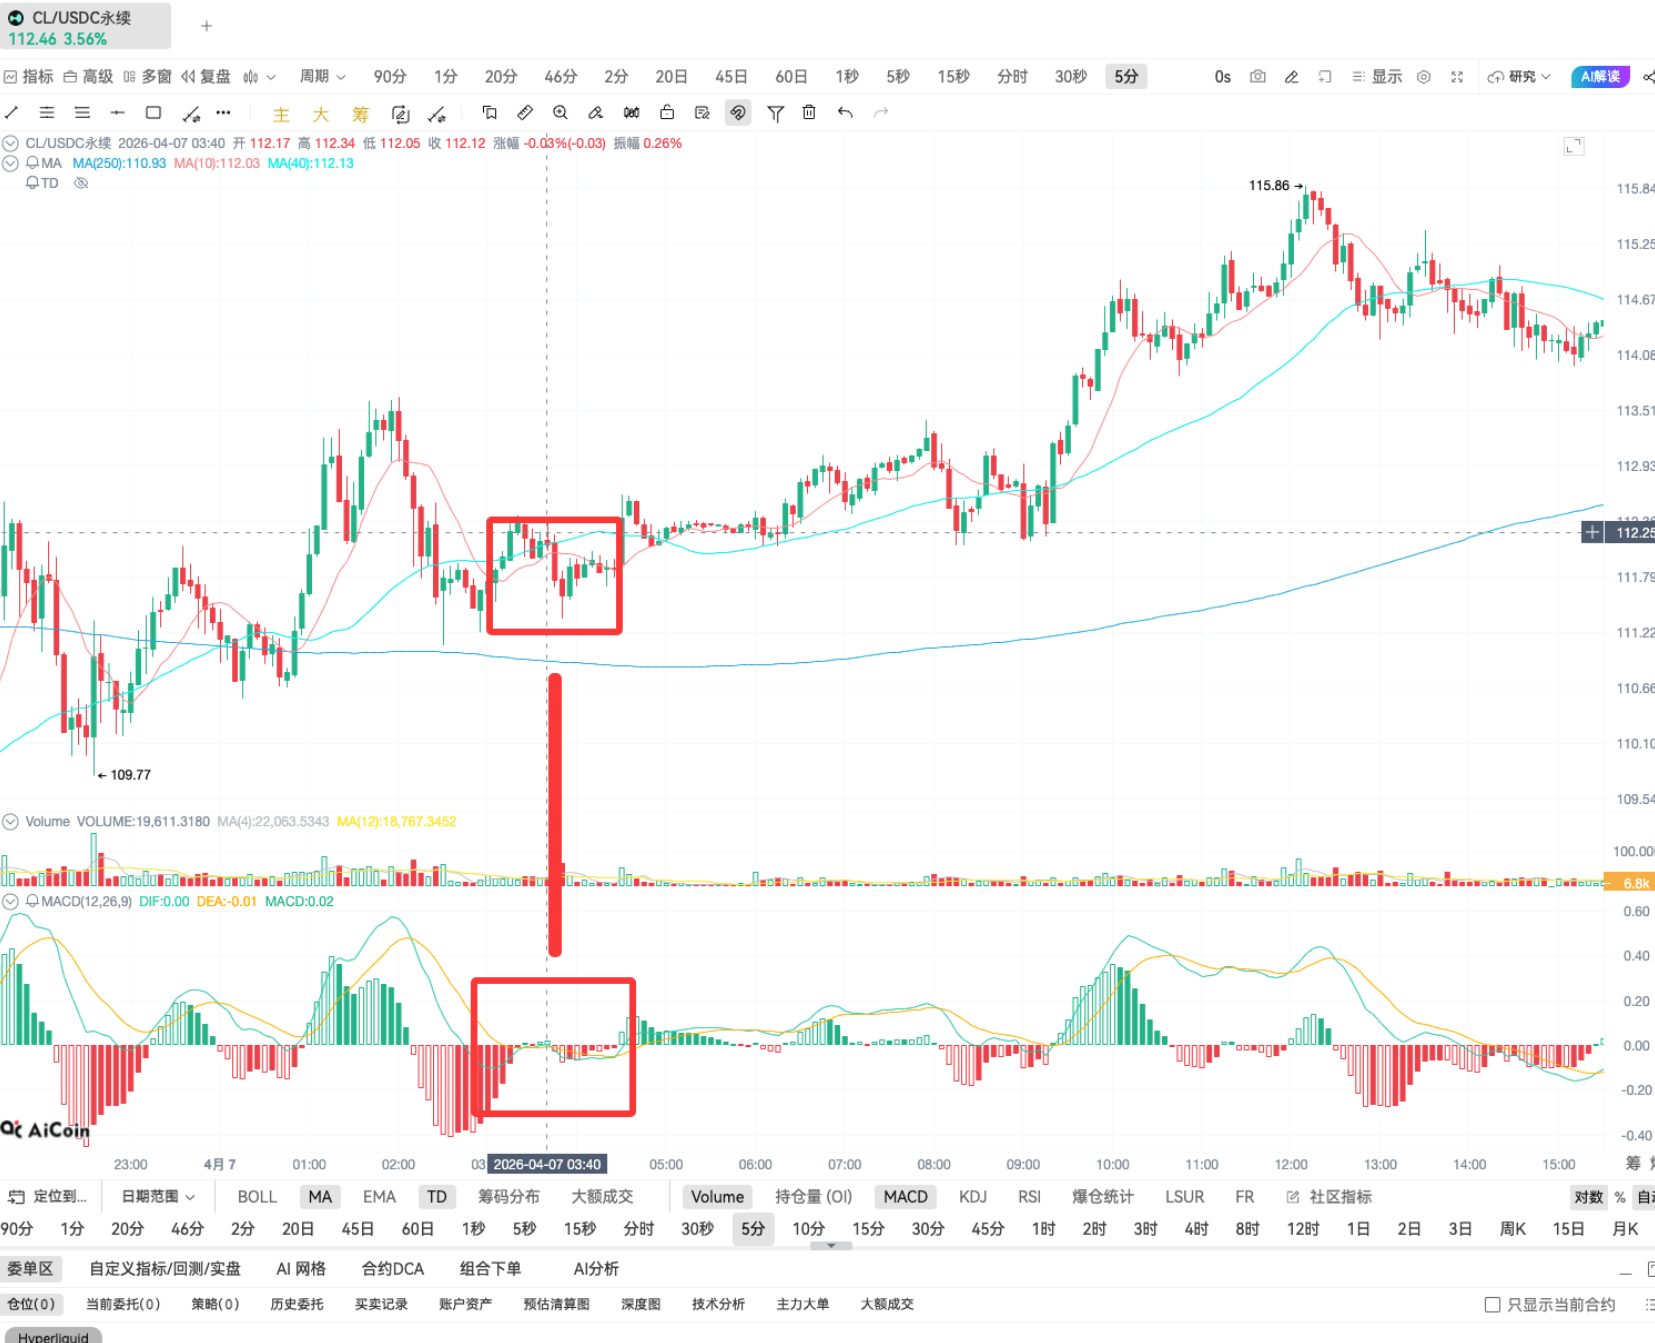
After selecting the oil commodity, pulling up the MACD indicator, you will see the complete indicator pattern.
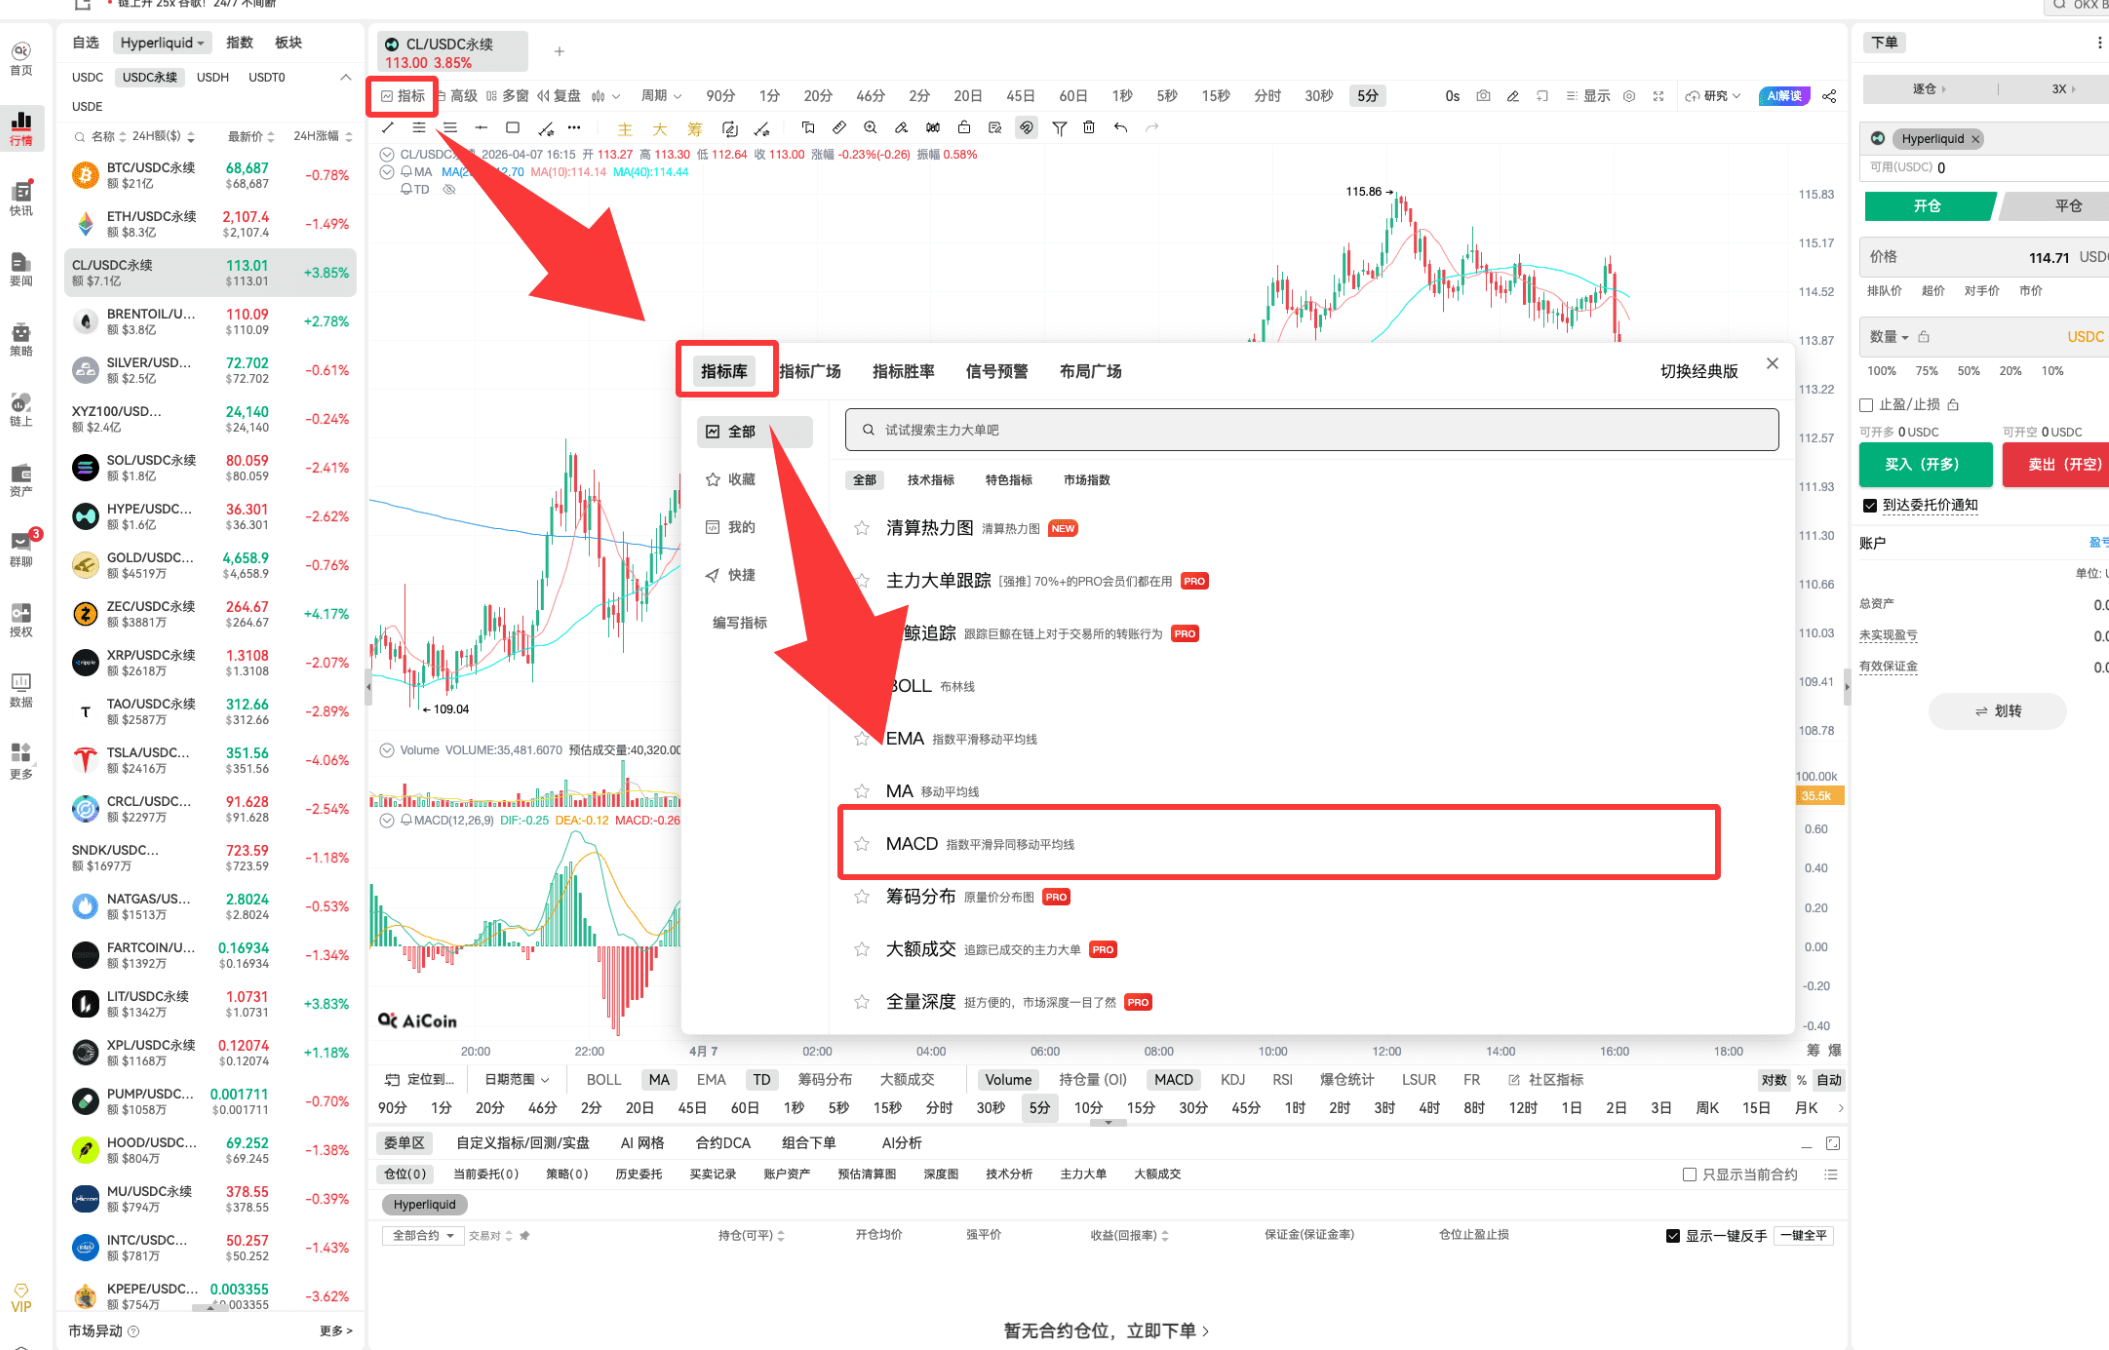
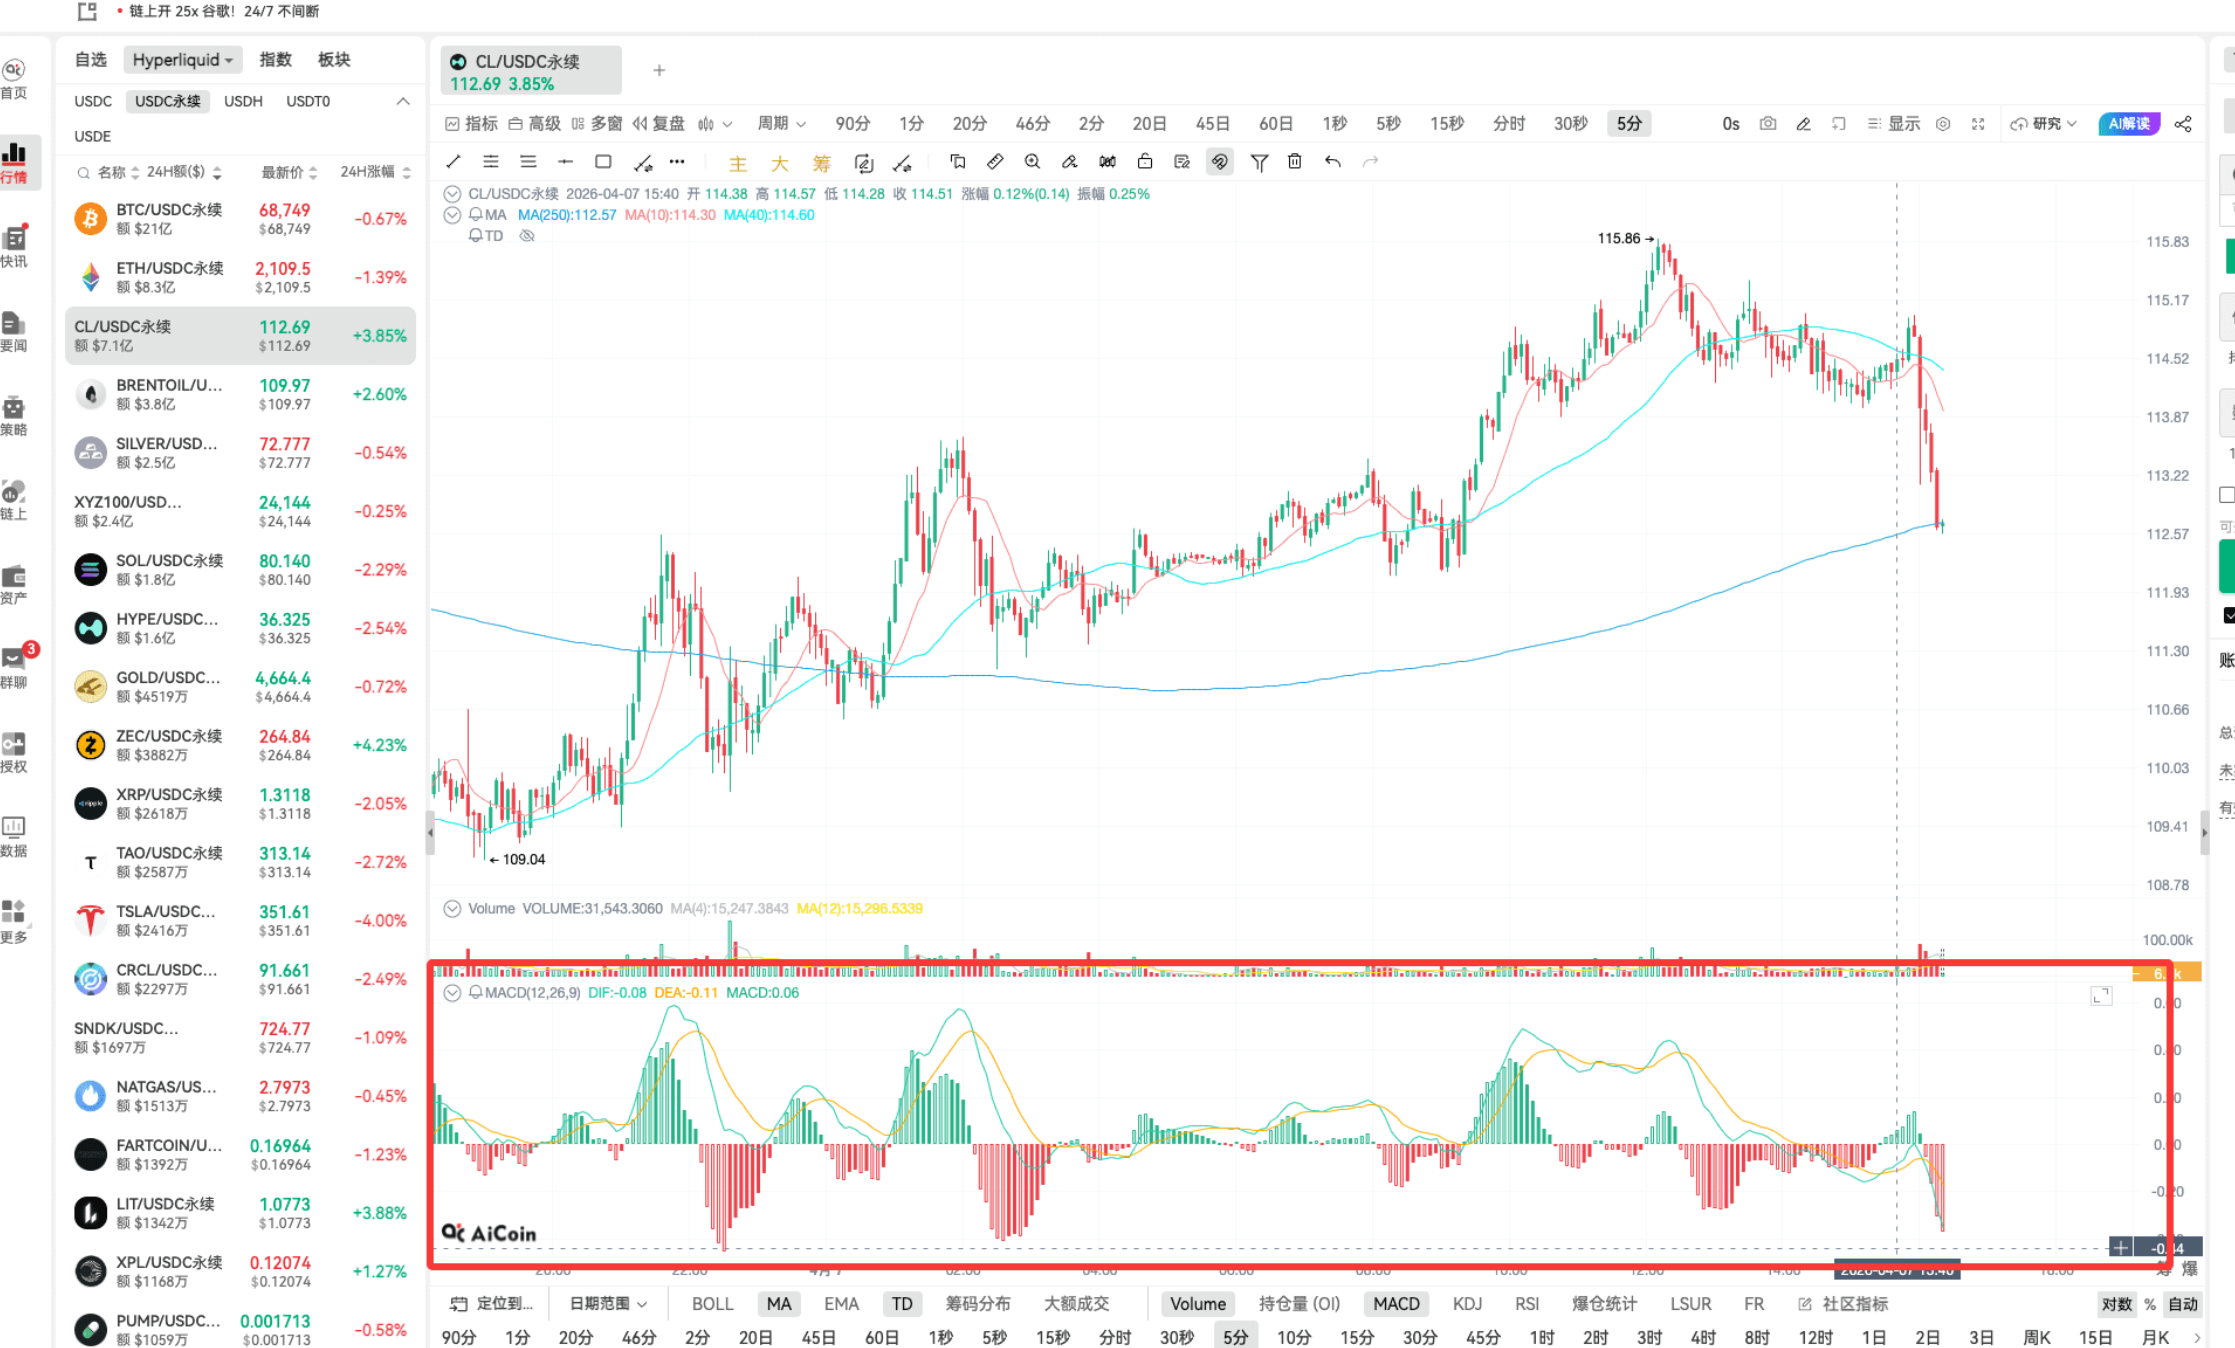
MACD consists of three parts: DIF fast line, DEA slow line, and the red-green histogram.
The red-green histogram is computed from the difference between DIF and DEA. You don't need to memorize these basic concepts; the more you use them, the more familiar you will become.
I have prepared an intuitive diagram for everyone, which is easy to understand at a glance.
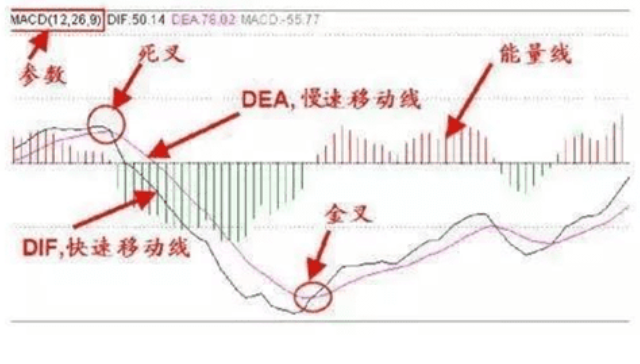
The most basic signals of MACD are the golden crossover and death crossover: when DIF crosses above DEA, it's a golden crossover, indicating a bullish signal; when DIF crosses below DEA, it's a death crossover, indicating a bearish signal.
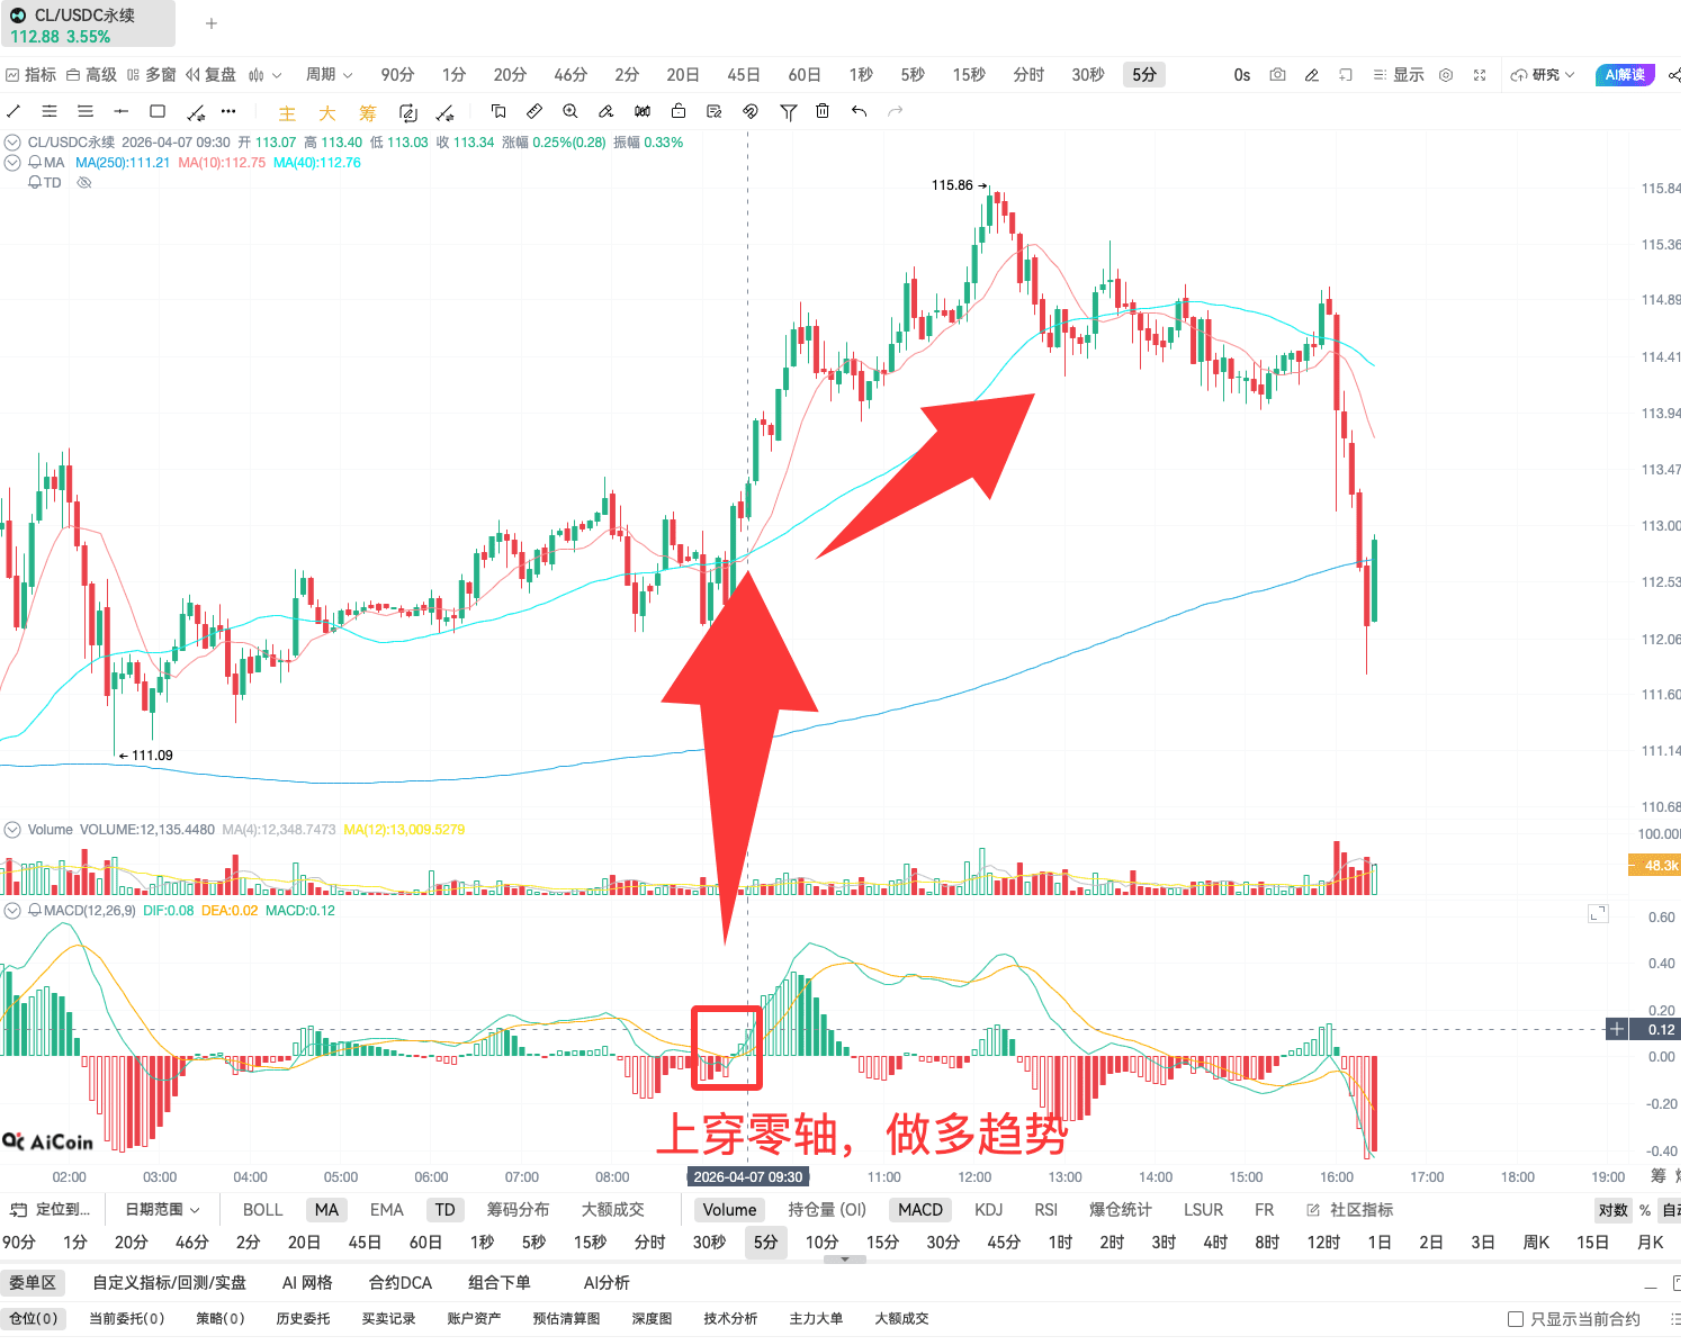
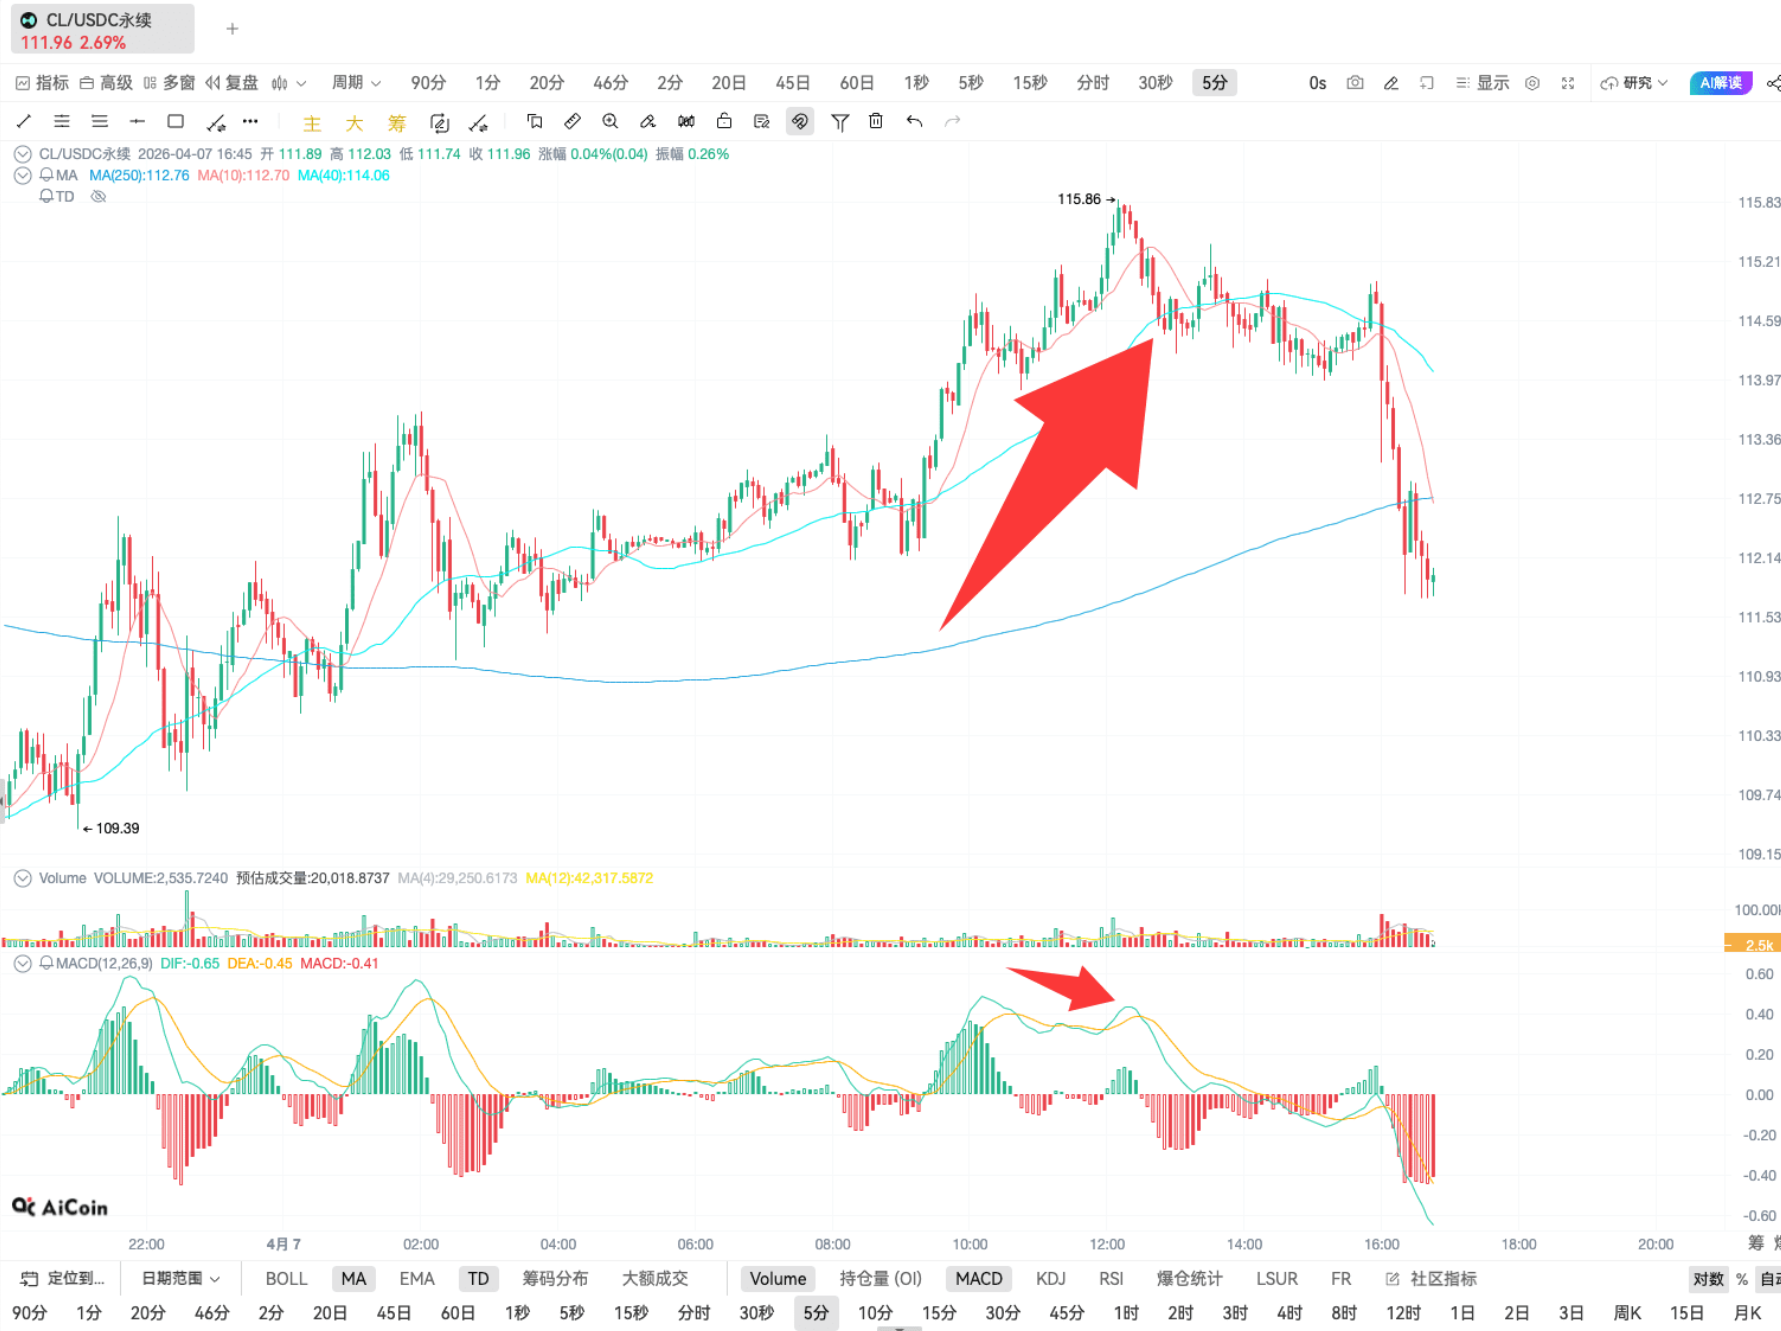
Next, we enter practical applications. The first core use of MACD is: using DIF crossing the zero line to judge the major trend.
When the DIF line crosses above the zero line, the trend is bullish;
When the DIF line crosses below the zero line, the trend is bearish.
We will continue to use the oil trend on Hyperliquid as an example, using this method to judge trends; recently, we have been able to accurately capture these recent waves of downturns.
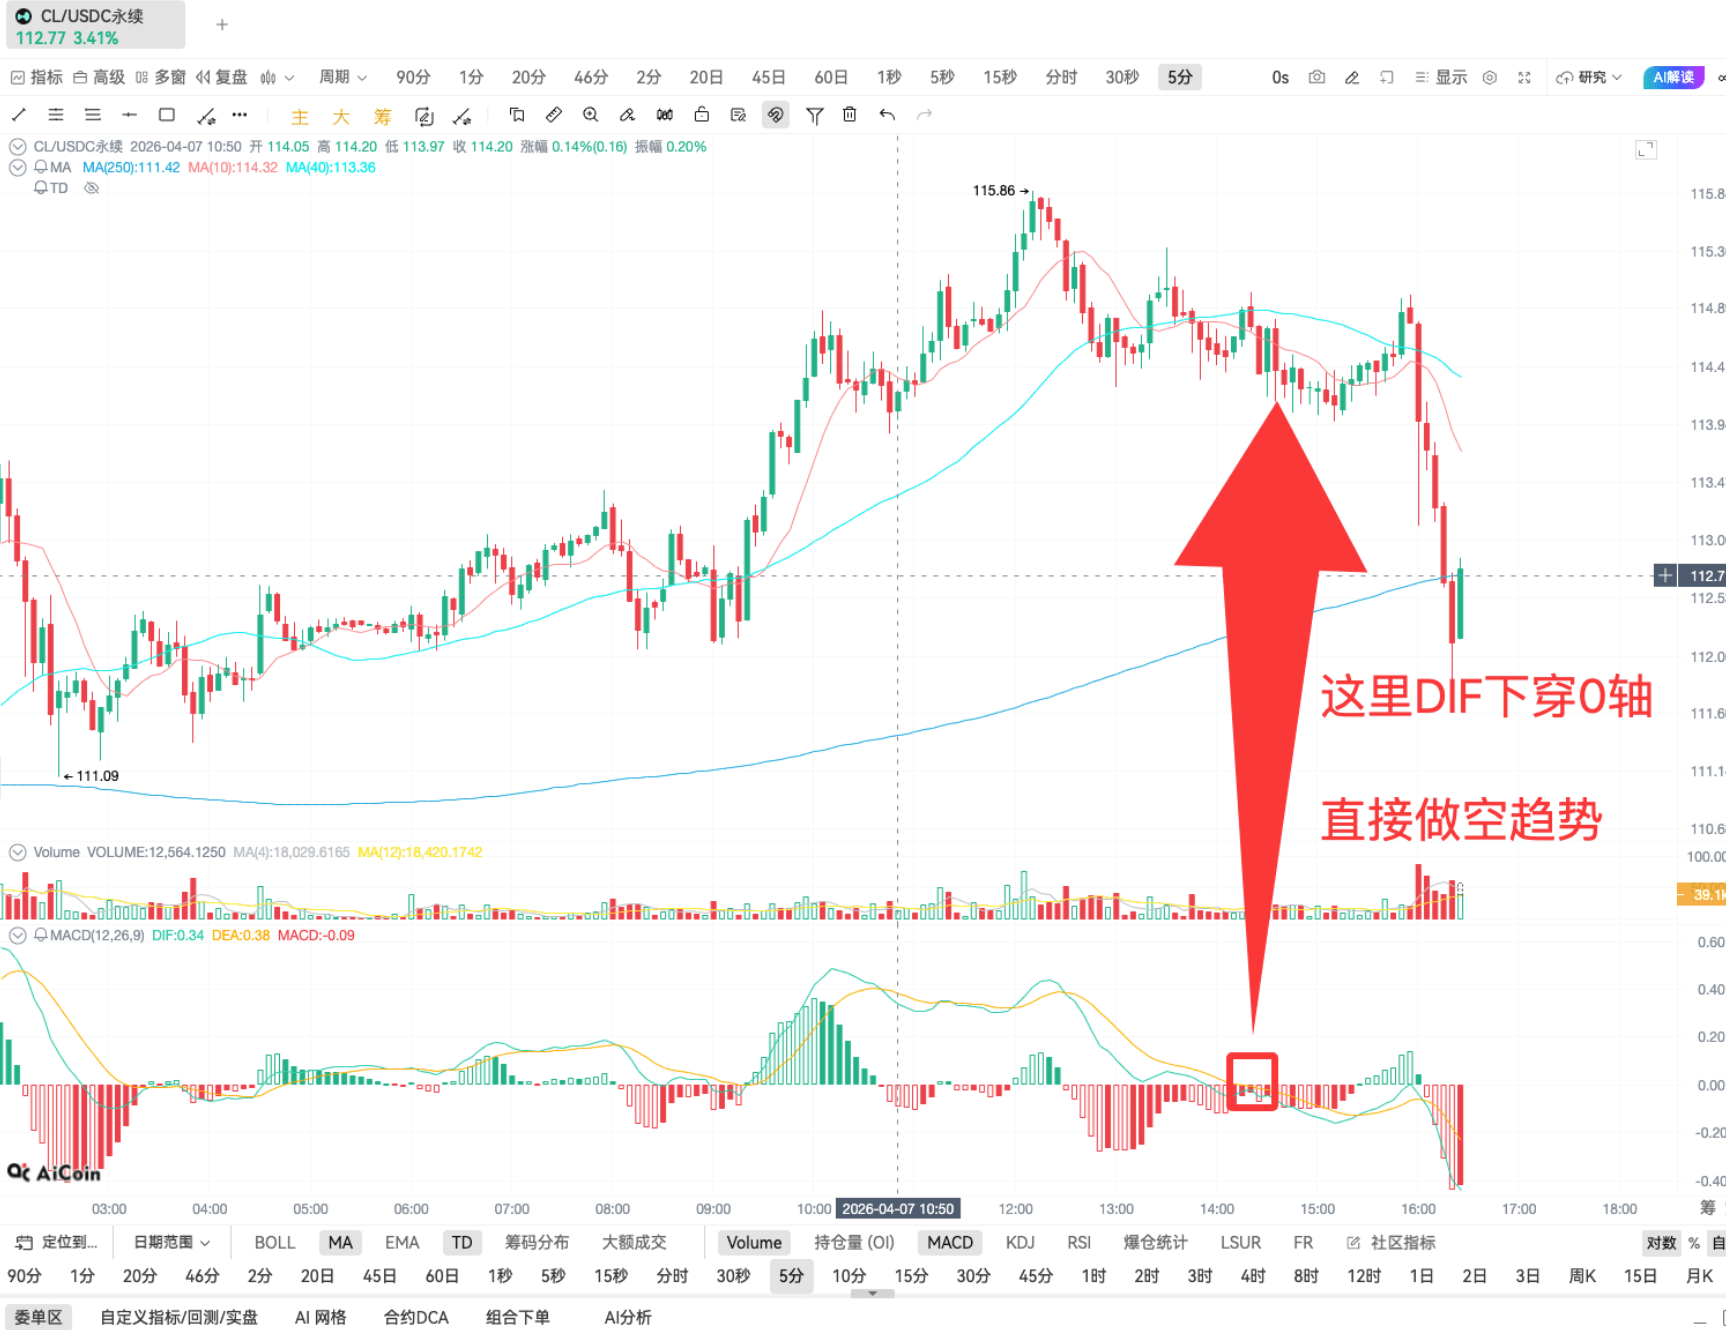
For friends trading CL crude oil, this rule can be fully applied, and the trend predictions will be quite accurate.
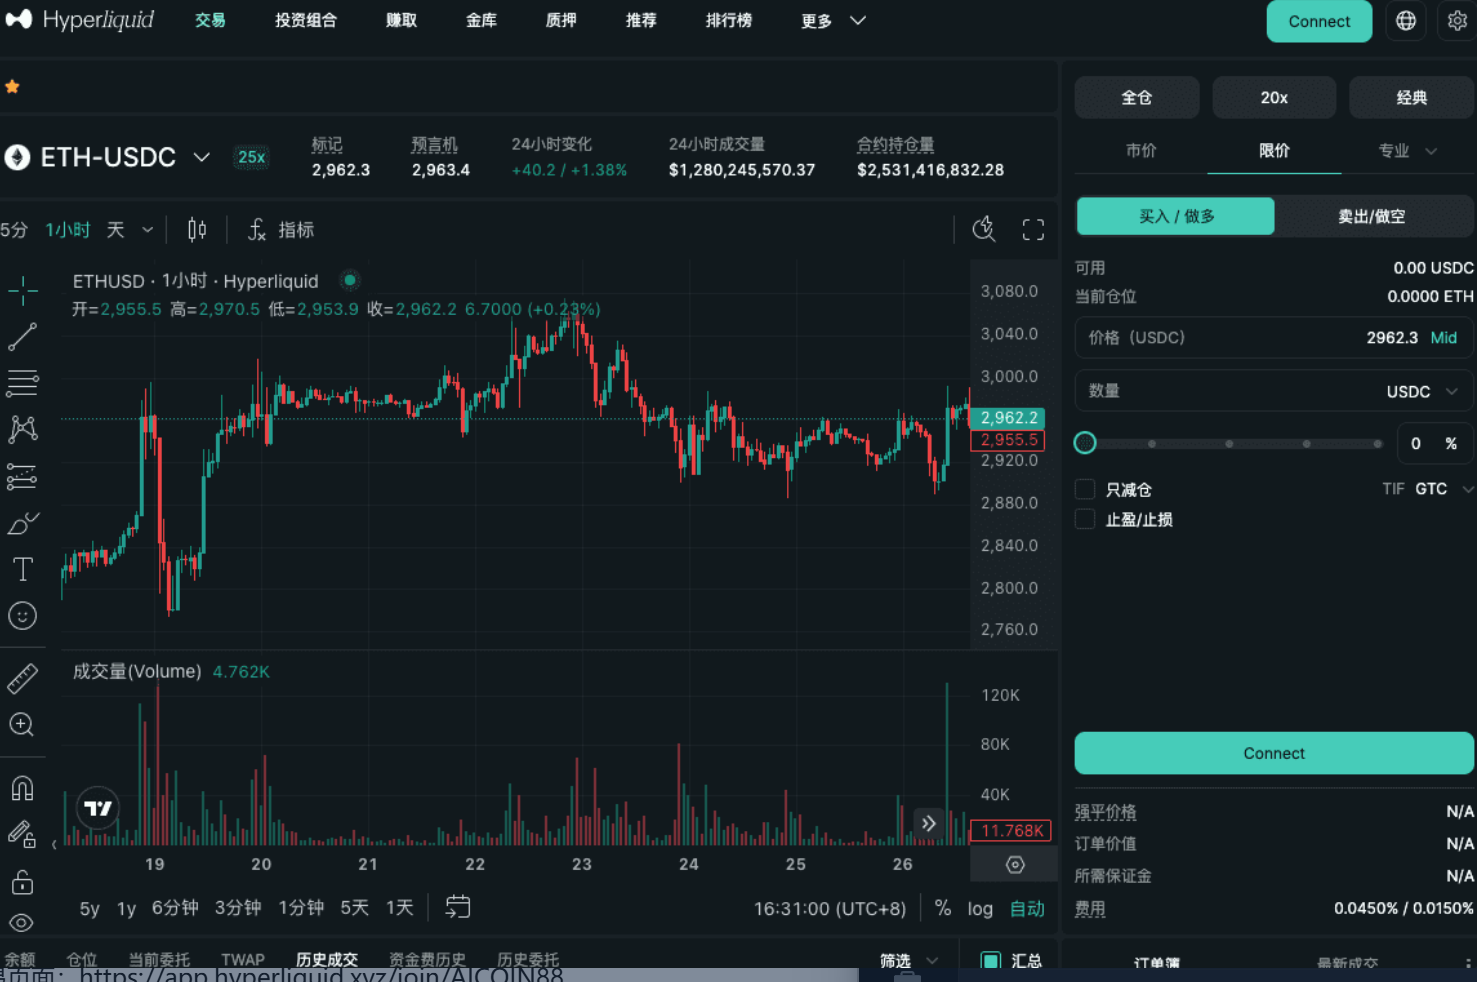
Taking this opportunity, I want to share a convenient channel for trading oil and US stocks — Hyperliquid.
On AiCoin, you can authorize quickly and directly. It is a decentralized perpetual contract + spot DEX built on our own high-performance L1 public chain, providing an experience comparable to centralized exchanges, with no gas fees and fully transparent on-chain operations. It's very suitable for newcomers to start with perpetual contracts, supporting up to 50 times leverage and requiring only USDC for margin.
Step-by-step operation guide:
Step 1: Prepare a wallet
Download a Web3 wallet that supports EVM, preferably OKX Wallet, and bind the exclusive invitation code: AICOIN88
Download link: https://static.rmgvx.com/upgradeapp/okx-android_aicoin20.apk
Step 2: Visit the official website to connect the wallet
Open the official trading page: https://app.hyperliquid.xyz/join/AICOIN88
Click "Connect" in the upper right corner to connect the wallet and select OKX Wallet for authorization, no KYC or account registration is required.
Once authorized, you can trade US stocks, crude oil, and gold on-chain, both spot and contracts, all anonymously and without barriers.
New users can bookmark this comprehensive tutorial: https://www.aicoin.com/zh-Hans/article/510225
When learning MACD, divergence is a core concept that must be mastered. I have summarized an original mnemonic for everyone, which is simple and easy to remember:
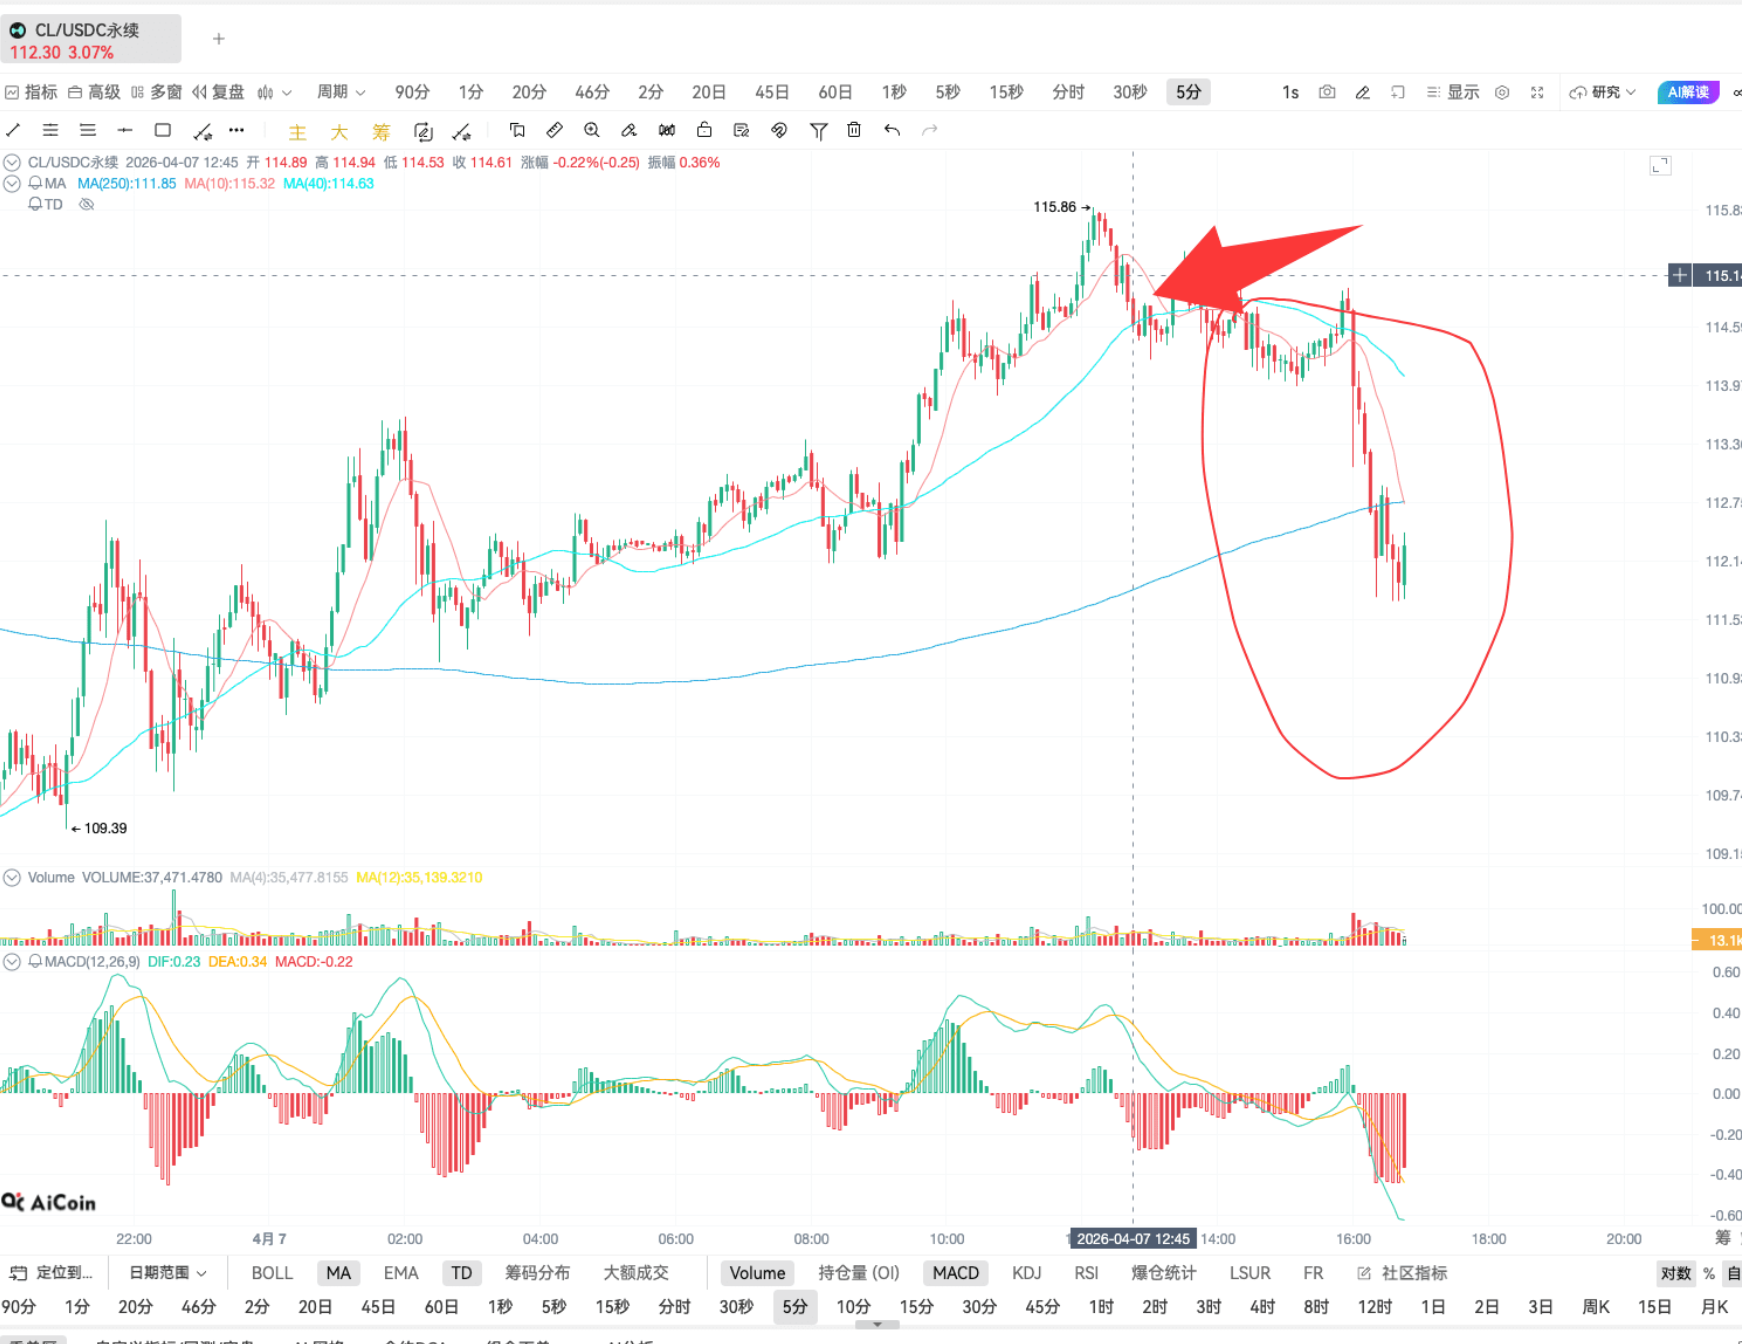
When the price makes a new high, but MACD does not make a new high → top divergence → bearish
When the price makes a new low, but MACD does not make a new low → bottom divergence → bullish
We will continue to use the oil trend as an example. In this wave of short-term decline, the divergence signals can definitely capture significant profits.
From the 5-minute K-line, you can clearly see that the price makes higher peaks, but MACD is unable to make a new high, which is a standard top divergence. According to the mnemonic, top divergence indicates bearish, entering the market can capture this wave of downward profit.
For US stocks and crude oil, using a 5-minute period for intraday trading is the most appropriate;
For long-term holdings, it is still recommended to hold BTC and ETH spot, using about 30% of the funds for short-term trading in oil, US stocks, and gold, which will be sufficient for daily expenses.
Hyperliquid has extremely low transaction fees, and on-chain trading is also the trend of the future. Many major US stock institutions are setting up on this platform.
I have organized two advanced tutorials for everyone, recommended to bookmark directly:
https://www.aicoin.com/zh-Hans/article/514197
https://www.aicoin.com/zh-Hans/article/510225
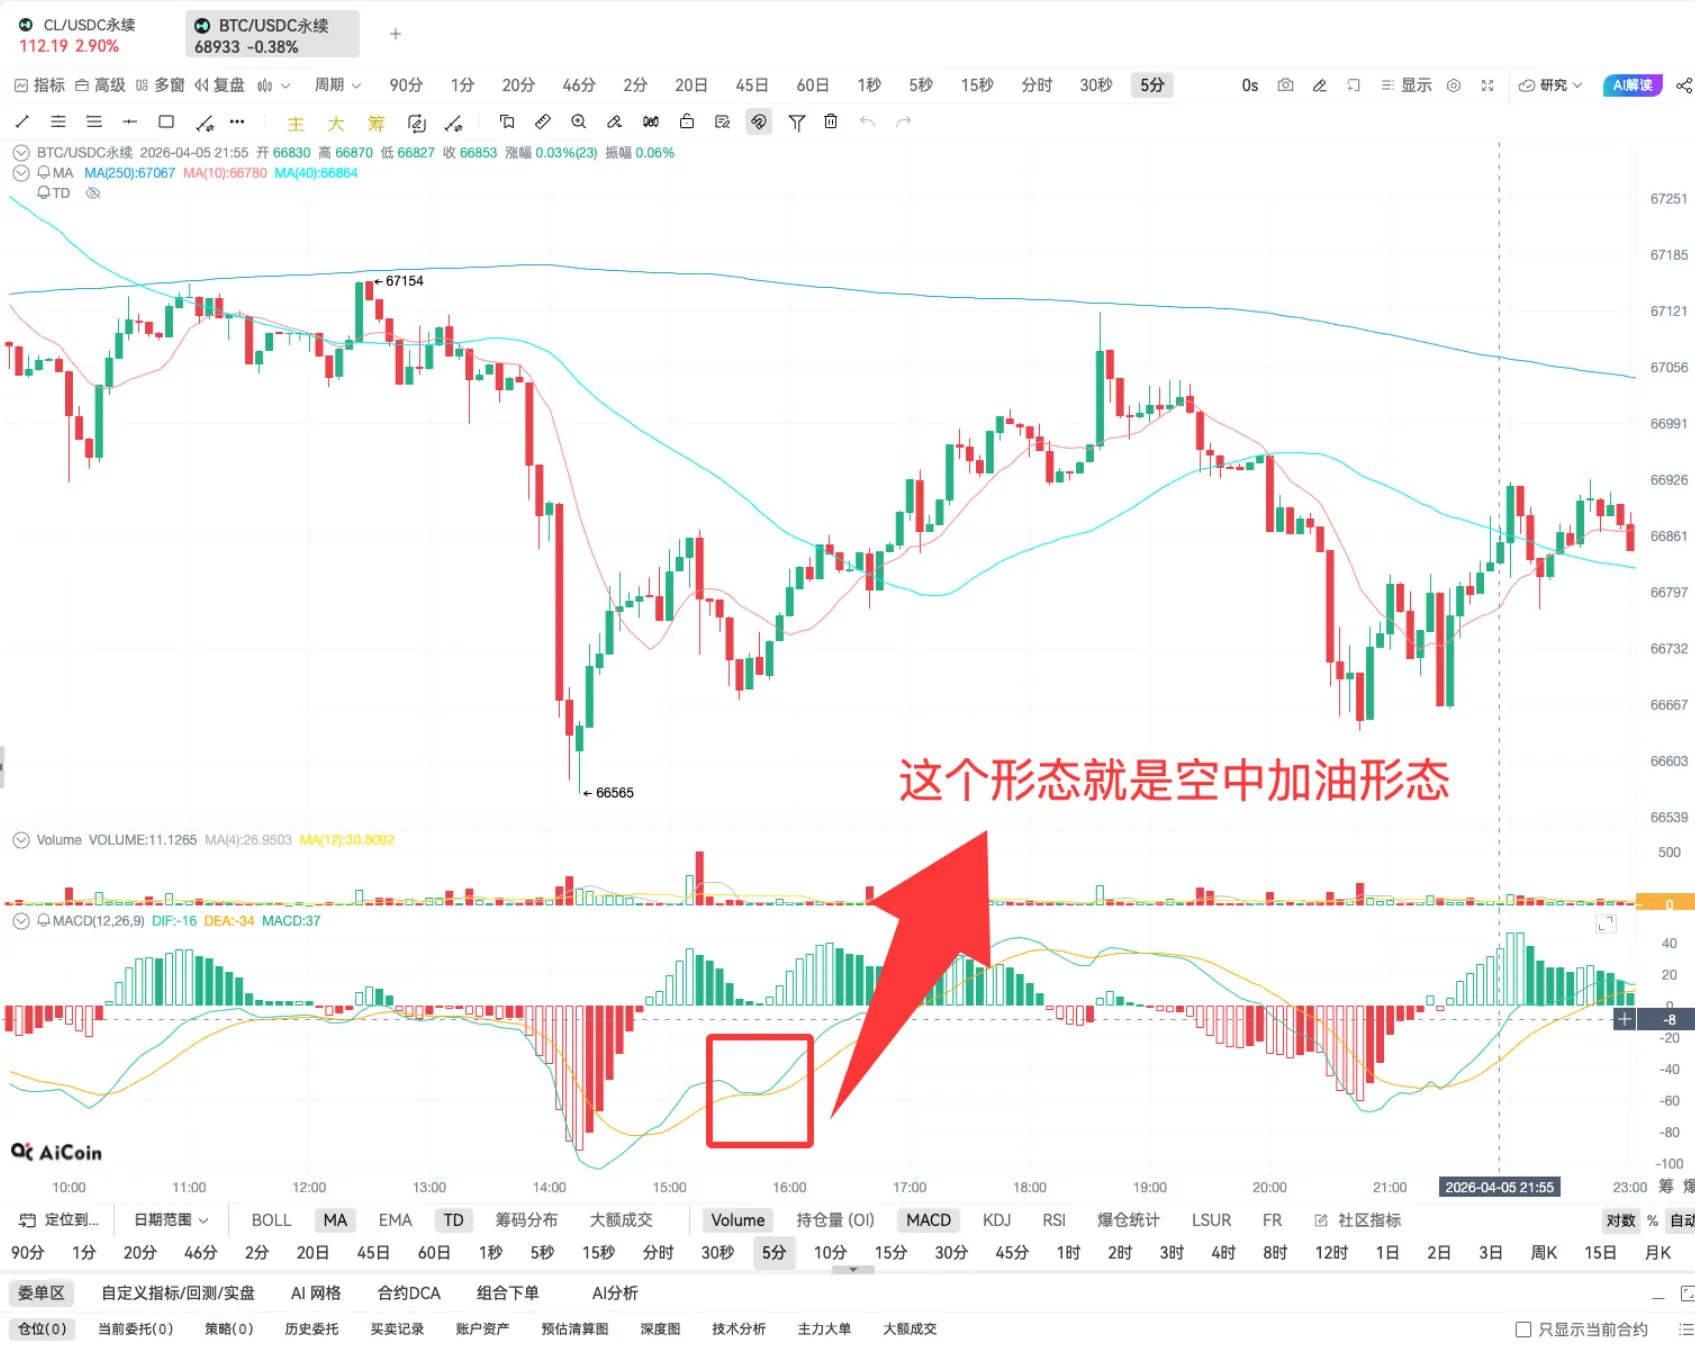
Finally, let's talk about the third advanced signal of MACD: in-flight refueling.
I will use the BTC trend pattern for reference.
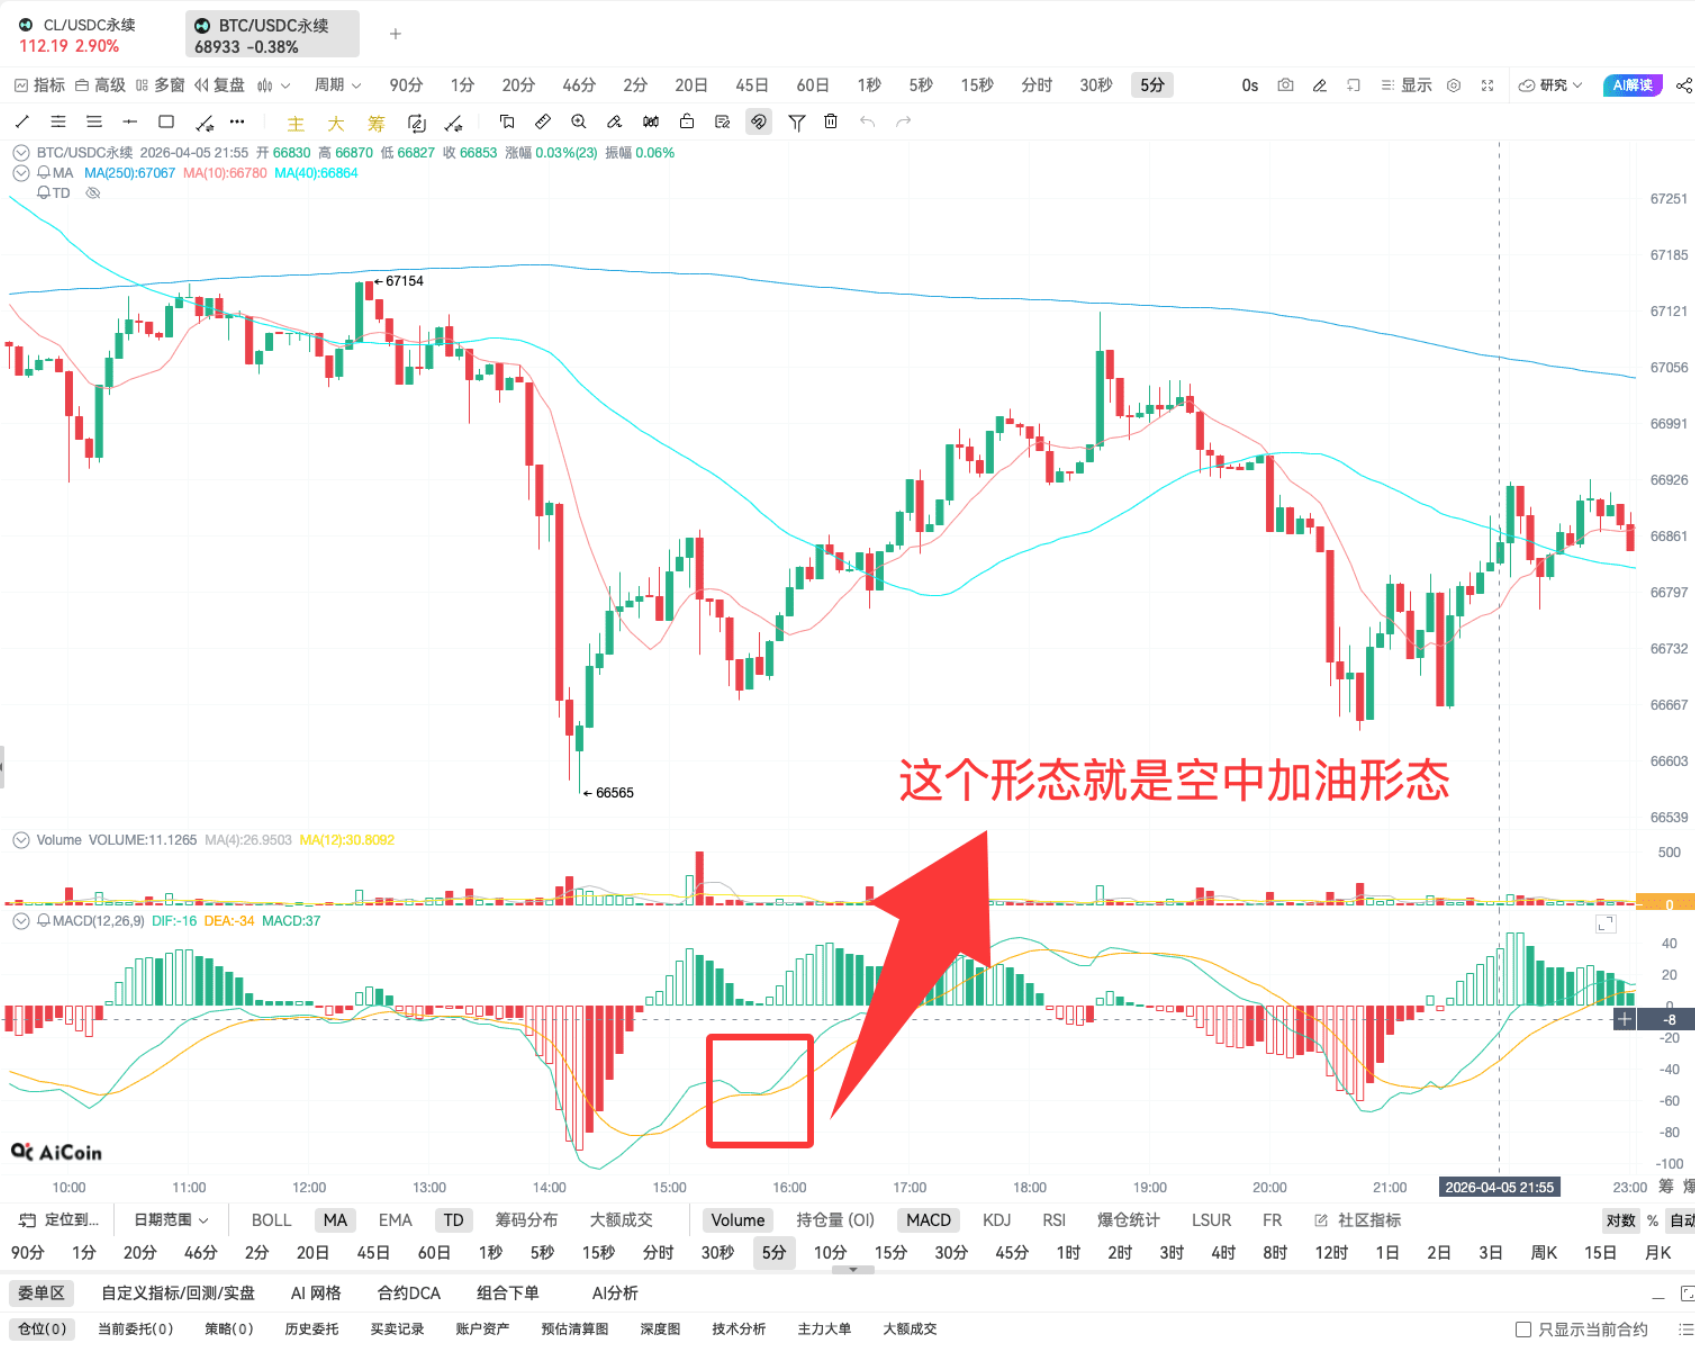
In-flight refueling refers to: when the DIF and DEA are about to form a death crossover, but are strongly supported, the death crossover does not occur, and the subsequent trend is likely to continue to rise.
This signal does not appear frequently, but once it does appear, the winning rate is very considerable. Once everyone has mastered the first two methods, we will delve deeper into this pattern.
Join our community to discuss together and become stronger together!
Official Telegram group: https://t.me/aicoincn
AiCoin Chinese Twitter: https://x.com/AiCoinzh
OKX benefit group: https://aicoin.com/link/chat?cid=l61eM4owQ
Binance benefit group: https://aicoin.com/link/chat?cid=ynr7d1P6Z
免责声明:本文章仅代表作者个人观点,不代表本平台的立场和观点。本文章仅供信息分享,不构成对任何人的任何投资建议。用户与作者之间的任何争议,与本平台无关。如网页中刊载的文章或图片涉及侵权,请提供相关的权利证明和身份证明发送邮件到support@aicoin.com,本平台相关工作人员将会进行核查。