The cryptocurrency market suddenly ignited after the release of Trump's announcement, which brought Bitcoin to a strong rally in the morning trading on the 8th of Beijing time, rising sharply from a 24-hour low of 68,900 USD. After breaking through the 70,000 USD mark, it continued to advance, reaching a daily high of 72,700 USD, with a daily increase of about 5%. However, by the time of writing, it had retreated to a quote of 70,736 USD. Ethereum showed even stronger performance, with a highest price of 2,270 USD on the 8th, achieving a 24-hour increase of 7%. It also retreated at the time of writing, temporarily quoted at 2,177 USD, and the bullish atmosphere was reignited in Asia in the early morning of the 8th.
The core catalyst driving this round of rebound was Trump's announcement of a two-week fire agreement with Iran, ending a prolonged five-week confrontation. Once the news broke, global risk assets collectively rebounded, while oil prices plummeted by about 10%, with WTI crude oil dropping to 90 USD per barrel, cooling market expectations directly benefiting risk assets. However, another concern for the rebound is that on April 9th, the second phase of the liberation day will officially take effect, with new tax rates ranging from 10% to 50% for more than fifty countries. Whether the optimism brought by the fire can withstand the substantial pressure of the tariff impact will be the biggest test for the market today.
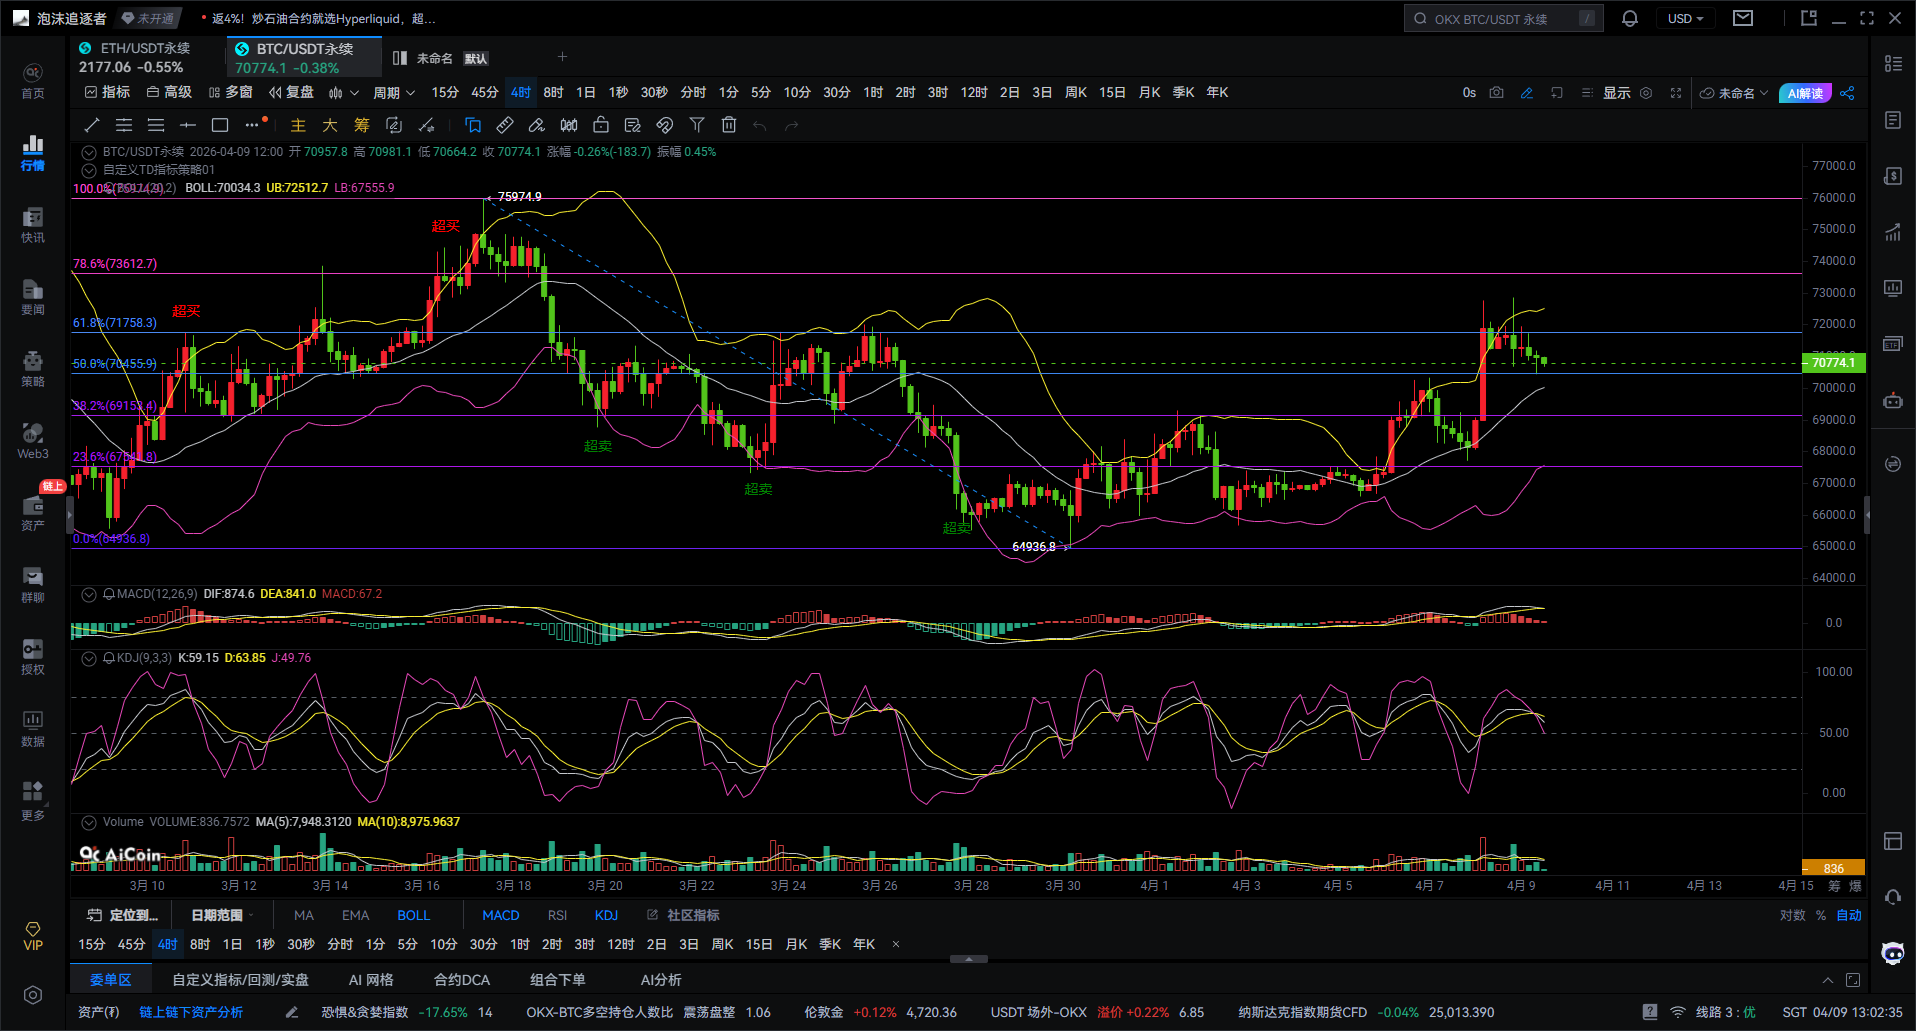
Bitcoin 4-hour chart
First, let me state my core judgment: the price has reached a phase of pressure zone. In the short term, there might still be some hesitation or even a small rise, but now it's not cost-effective to chase after buying, as it's easy to buy at the peak. The more likely rhythm going forward is to first oscillate at a high level, then pull back to find support for confirmation.
Now, let me clarify a few technical indicators.
First, look at Fibonacci and price structure. From the previous low, the key retracement level at the top is around 71,700, which has been genuinely tested. The price even tried to probe the previous round's high region, which is the range of 72,000-73,000. What does this area represent? It’s the previous high plus a key resistance level of Fibonacci, forming a double pressure zone. So my conclusion is straightforward: this is not the place to open new long positions, instead those who already have long positions should consider taking profits, while those wanting to try short positions can start observing.
Second, look at the Bollinger Bands. The price has now surged close to the upper band, which itself has begun to flatten out, without further widening the mouth of the horn. What does this indicate? It shows that the upward momentum is weakening, with no signs of continuing acceleration. The current trend resembles a sharp rise followed by digestion and oscillation at high levels, rather than being in the midst of a primary upward wave.
Third, look at the MACD. Although the fast and slow lines of the MACD remain at high levels, the MACD histogram representing momentum has started to shorten. Additionally, the fast and slow lines show signs of turning downward. This is crucial. It tells us that while the price appears strong at high levels, even potentially making slight new highs, the underlying upward momentum has begun to decelerate. Don’t be fooled by the seemingly strong candlestick readings; the intrinsic strength is already lagging.
Fourth, look at the KDJ. The KDJ indicator has formed a dead cross in the high region and is running downward, especially the sensitive J value has significantly retreated. This is technically a typical short-term top signal, at least a phase top signal.
Fifth, look at the trend line. The previous downtrend line has been broken upwards by the price, which is a positive sign. However, the price is now just a short distance above this broken trend line. This implies the situation is still quite delicate: if the price quickly falls back below this trend line, it would indicate that the previous breakout was false and a trap. On the other hand, if the price can first pull back to this trend line and gain confirmation of support, then the market can develop more healthily upwards. Otherwise, there may be a corrective wave.
In summary, at the current position, it is absolutely not a good time to go long. If you chase the upswing now, you are likely buying at the peak of market enthusiasm and can easily get trapped.
I consider there are two relatively feasible strategies at this moment:
The first strategy is to wait for a pullback to go long, which is more stable. You need to focus on several key support levels: first is 70,000, an important psychological barrier and support level for recent consolidation; second is around 69,000, corresponding to the Fibonacci 0.5 level; and lower down at around 68,000, which is a strong support level at the 0.382 golden ratio. When the price retracts to these areas and shows clear reversal candlestick patterns, while the MACD metric starts to expand again and KDJ forms a golden cross upwards, at that time consider entering long, which will be much safer.
The second strategy is to attempt shorts at high levels, which is more aggressive and suitable for short-term trading. If the price once again pushes upwards to 72,000 or even higher but clearly fails to break through, and leaves long upper shadows on the chart, or continues to produce small bearish candles, while the MACD confirms a dead cross downwards. Then you can attempt to short with a very small position, aiming for a price pullback from 71,500 to 69,000 range.
Finally, to summarize with a straightforward truth: this wave of increase has reached a point where "it should take a breath." The bullish trend has not ended, but the price is no longer cheap in the short term. The truly comfortable and reassuring long opportunities require patience to wait for prices to pull back to key support, rather than impulsively chasing highs at this moment.

A hundred percent accurate advice is not as good as providing you with correct thinking and trends; teaching a person to fish is better than giving them a fish, recommendations can earn for a moment, but learning the right mindset can earn for a lifetime!
Time of writing: (2026-04-09, 13:00)
(Written by - Daxian Talks Coins) Disclaimer: The online publication has delays, and the above suggestions are for reference only. Investment carries risks, and participants should exercise caution!
免责声明:本文章仅代表作者个人观点,不代表本平台的立场和观点。本文章仅供信息分享,不构成对任何人的任何投资建议。用户与作者之间的任何争议,与本平台无关。如网页中刊载的文章或图片涉及侵权,请提供相关的权利证明和身份证明发送邮件到support@aicoin.com,本平台相关工作人员将会进行核查。