Crypto Circle Academician: From weak oscillation to strong rebound on April 9, Ethereum's technical indicators show obvious stabilization signals! Latest market analysis reference
Ethereum's current price is 2215, trading Ethereum and linking with Bitcoin is key, now the BTC rebound trend is clear, and ETH rises synchronously. If the overall direction is bullish, don't think about betting against the trend; the more you short, the more you lose. Ethereum has completed a round of oversold rebound, breaking through the key resistance level of 2200, ending the previous downtrend. On the daily chart, the EMA moving averages are still arranged downwards, but the price has exited the downtrend channel, showing signs of stabilization and reversal; on the 4-hour chart, the Bollinger Bands are opening upwards, MACD shows a golden cross with red bars continuously increasing, and upward momentum is fully activated, defining a clear short-term rebound trend. However, the overall trend has not completely reversed; there is still strong resistance between 2300-2350. The focus should be on low buying along the trend, while high shorting is only suitable for light positions to test the waters, strictly controlling risk.
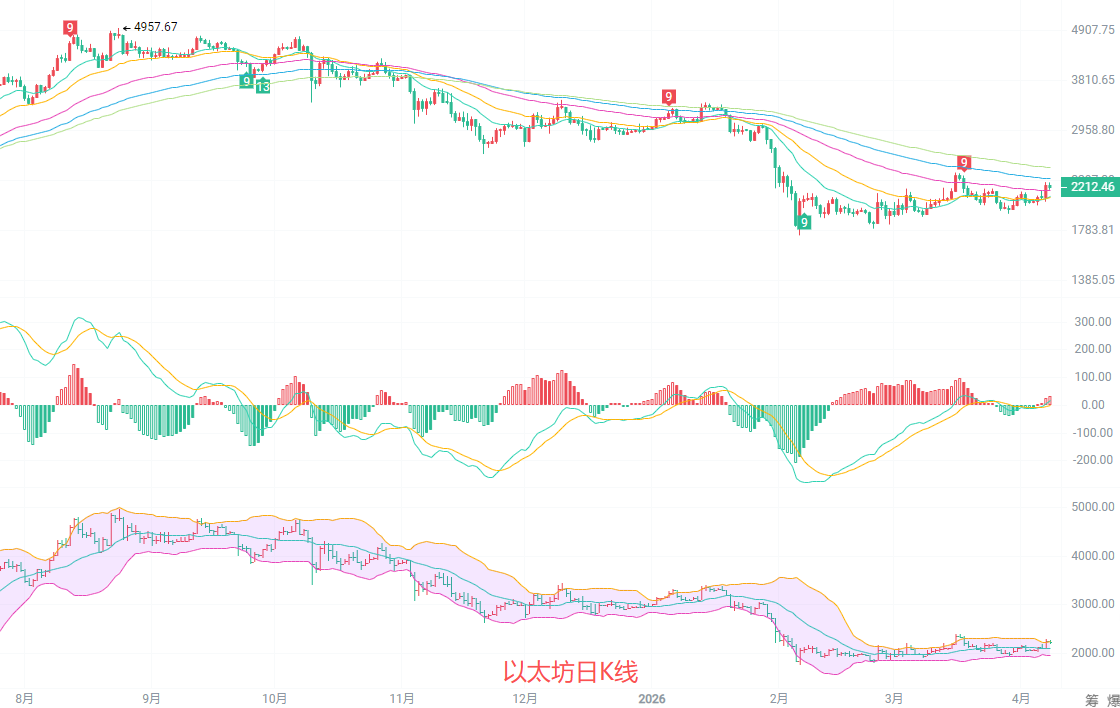
The daily K-line has produced an oversold rebound bullish line, ending the previous weak oscillation. The moving average system is still arranged downwards, with EMA15, EMA30, and EMA60 gradually turning upwards, and the price successfully stabilizing above EMA15 and EMA30, exiting the weak range below the Bollinger Bands, indicating a northward counterattack signal. The MACD indicator is in a golden cross state below the zero line, with red bars continuously increasing, and the southern momentum significantly weakening, showing signs of slowing down the mid-term downtrend. The BOLL indicator shows that the lower track at 1954 is strong support, and the upper track at 2234 is strong resistance. If it breaks above the upper track, it will confirm the trend reversal, with 2150 below serving as the defensive bottom line for the northbound movement; breaking below it will restart the downtrend.
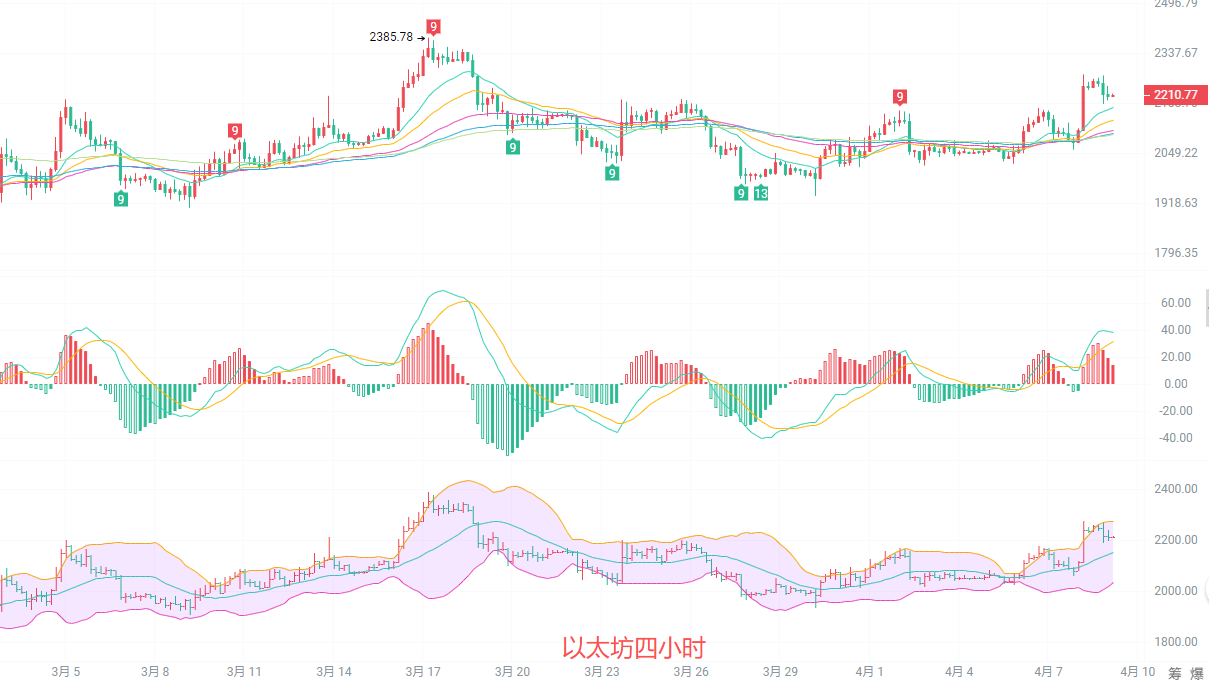
On the four-hour rising trend, the K-line has continuously closed bullishly, successfully breaking through the previous resistance level of 2200, standing above the EMA15 and EMA30 moving averages, with short-term moving averages turning upwards forming northward support. EMA15 and EMA30 are diverging upwards, while EMA60 forms support, and the price is moving within the rising channel. The MACD indicator's DIF and DEA show a golden cross with red bars continuously increasing, indicating ample northward momentum, with a clear rebound trend, only temporarily suppressed by EMA60. The BOLL indicator indicates that the upper and lower tracks are 2275 and 2034 respectively, with the price running along the upper track. If it breaks the upper track, it will further test the resistance level of 2300-2350, with a retest of the middle track being a good opportunity for low buying.
Short-term reference: (Real-time data has been updated; for details, please consult the author)
From 2200 to 2150 northbound, stop-loss at 2120, target looking at 2250 to 2300
From 2260 to 2300 northbound, stop-loss at 2330, target looking at 2200 to 2160
The specific operation depends on real-time market data. For more information and details, please consult the author. There may be delays in the article's release; recommendations are for reference only, and risks are self-borne.
This article is exclusively contributed by Crypto Circle Academician and represents the unique views of the academician.

Kind reminder: The above content is solely created by the author of the public account. The advertisements at the end of the article and in the comment section have no relation to the author. Please discern carefully, thank you for reading.
免责声明:本文章仅代表作者个人观点,不代表本平台的立场和观点。本文章仅供信息分享,不构成对任何人的任何投资建议。用户与作者之间的任何争议,与本平台无关。如网页中刊载的文章或图片涉及侵权,请提供相关的权利证明和身份证明发送邮件到support@aicoin.com,本平台相关工作人员将会进行核查。