Crypto Circle Scholar: 4.9 Bitcoin Short-term Bulls Dominate, Key Support Holds, Low Long Still Mainstream Thinking! Latest Market Analysis
Current Bitcoin price is 71400, with the main coin stuck in the 71000-72000 range, having just rebounded from a low of 70671, only to be pushed back down by the pressure at 72000, with rebound strength fluctuating. On the daily chart, the EMA moving averages have not fully turned yet, and the price is tightly pressed below EMA60; every time it rebounds near the moving average, it falls back. In the 4-hour chart, MACD golden cross with red bars at full stretch indicates that the price is stable above the moving averages, with strong upward momentum, and a clear short-term rebound trend. Simply put, this is a rebound after a decline; without the volume to support a break above 73000, keep an eye on the 70500-72500 range for short-term trading, low long and high short, quick in and out, no lingering battles.
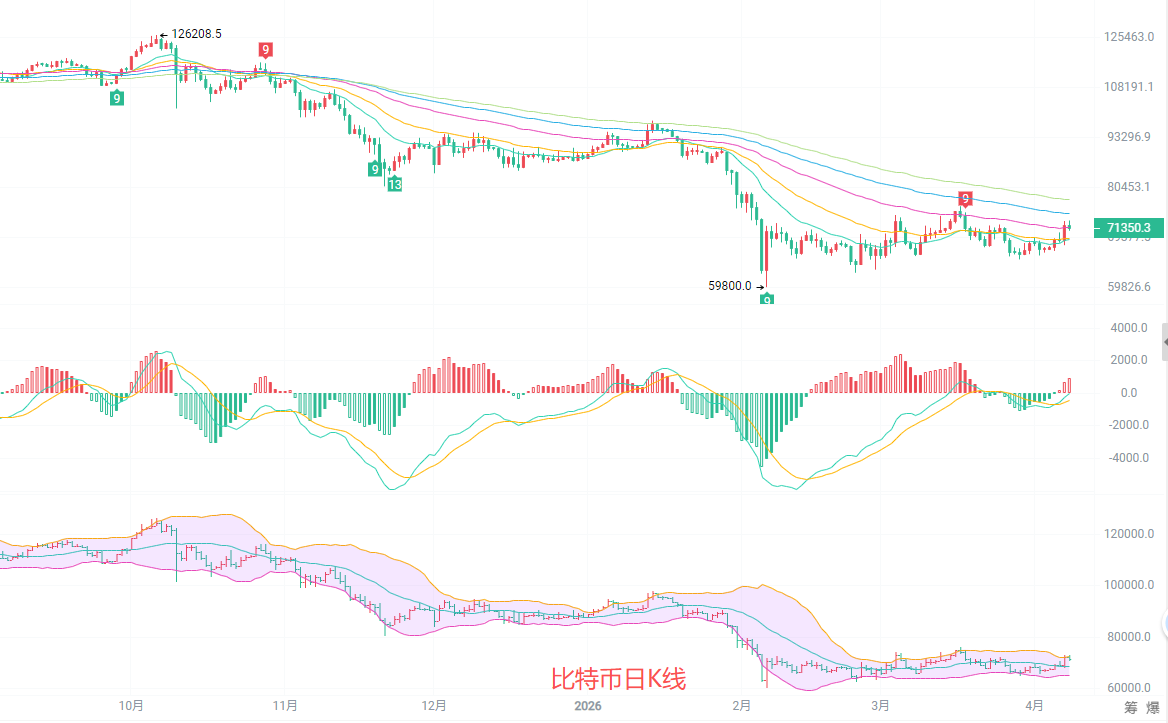
Overall, the daily K line shows a pattern of rebound followed by fluctuations. The EMA moving average system exhibits a significant descending arrangement, with EMA15, EMA30, and EMA60 moving downwards in succession, and the price is pressured below EMA60, lacking strength to break through during rebounds. After the MACD indicators DIF and DEA golden cross, the red bars continue to expand, while the downward momentum significantly declines, signaling a potential counterattack. The BOLL indicator has a lower boundary at 64960 providing strong support, and the upper boundary at 72294 serves as strong resistance. In the short term, observe the 70500-72500 range, and a breakout from this range will lead to a decisive trend; focus on low longs as the main strategy, with high shorts as a secondary approach.
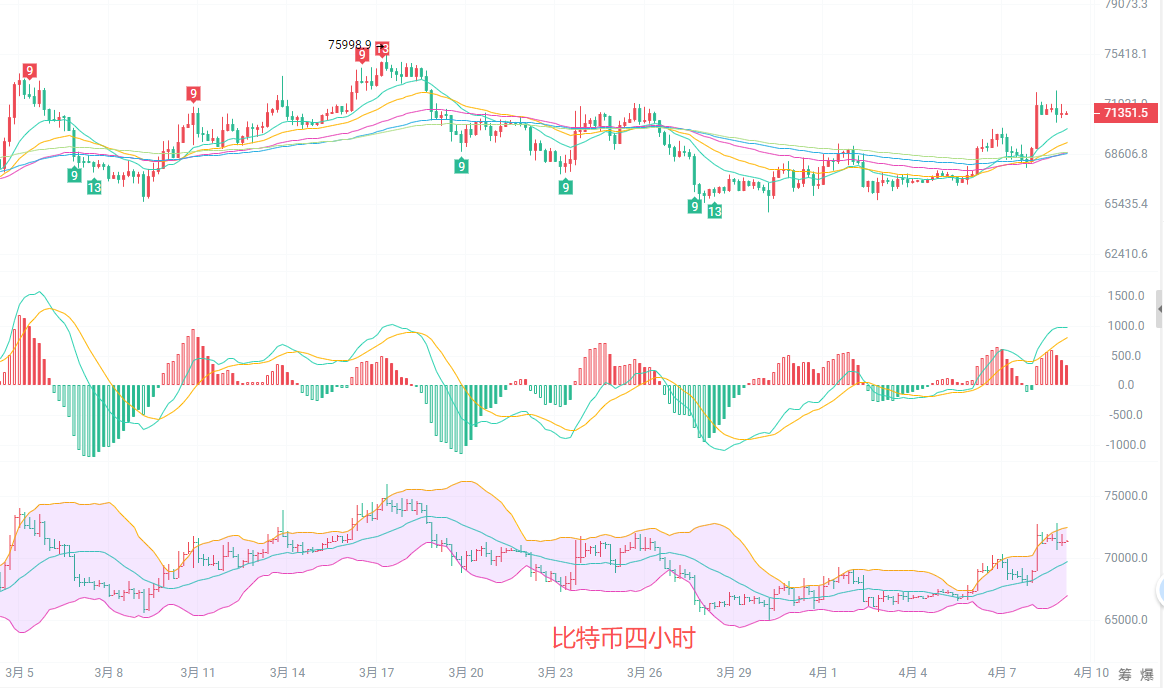
In the four-hour chart, the BTC price shows a clear upward rebound trend, with consecutive positive K lines successfully breaking through the prior pressure at 71000, standing firm above the EMA20, EMA30, and EMA60 lines, while the short-term moving averages have turned upward, forming upward support. EMA15 and EMA30 are diverging upward, and EMA60 provides support, with the price operating within an ascending channel. The MACD indicators DIF and DEA golden cross, with red bars continuously expanding, indicate strong upward momentum and a clear rebound trend. The BOLL indicator has the upper boundary at 72503 and the lower boundary at 67060 forming an ascending channel, with the price operating along the middle track. A breakout above the upper boundary will further probe 73000, while a retest of the middle track at 70800 provides a good opportunity for low longs.
Short-term strategy reference: Follow the major cycle trend, use small stop losses for quick in-and-out trades.
For upward movement from 70500 to 71000, stop loss at 70000, target looking at 72000, and if 72000 breaks, look at 72500.
For downward movement from 72500 to 73000, stop loss at 73500, target looking at 72000, and if 71500 breaks, look at 71000.
In the crypto circle, those with foresight and insight eat meat, those who are late to realize drink soup, and those who are completely unaware take the loss.
The specific actions depend on real-time market data; for more information, please consult the author. The article is published with some delay; suggestions are for reference only, and risk is borne by the reader.

Friendly Reminder: The above content is solely created by the author of the public account; ads at the end of the article and in the comment section are unrelated to the author, please differentiate carefully. Thank you for reading.
免责声明:本文章仅代表作者个人观点,不代表本平台的立场和观点。本文章仅供信息分享,不构成对任何人的任何投资建议。用户与作者之间的任何争议,与本平台无关。如网页中刊载的文章或图片涉及侵权,请提供相关的权利证明和身份证明发送邮件到support@aicoin.com,本平台相关工作人员将会进行核查。