Welcome to the Qinglan Crypto Classroom, I am Sister Qinglan. Today we will use the TPV three-point verification system to analyze the market in detail, filled with practical insights!
Step 1: First, look at the overall direction (multi-period trend overview)
1-day period: closing price 66613.01, below MA5 (67342.15), MA10 (67566.29), MA30 (69356.48), in a bearish arrangement. The price is struggling near the recent low of 66412.13 (from the 4h minimum price series). On-chain sentiment is extremely fearful (index 9), total market cap 2.38 trillion with a slight drop in 24 hours, pessimistic sentiment over the long term.
4-hour period: closing price 66613.01, below MA5 (66712.84), MA10 (67228.05), MA30 (67276.64), in a bearish arrangement. The price is near the recent low of 66412.13. Sentiment resonates with the daily line, extremely fearful.
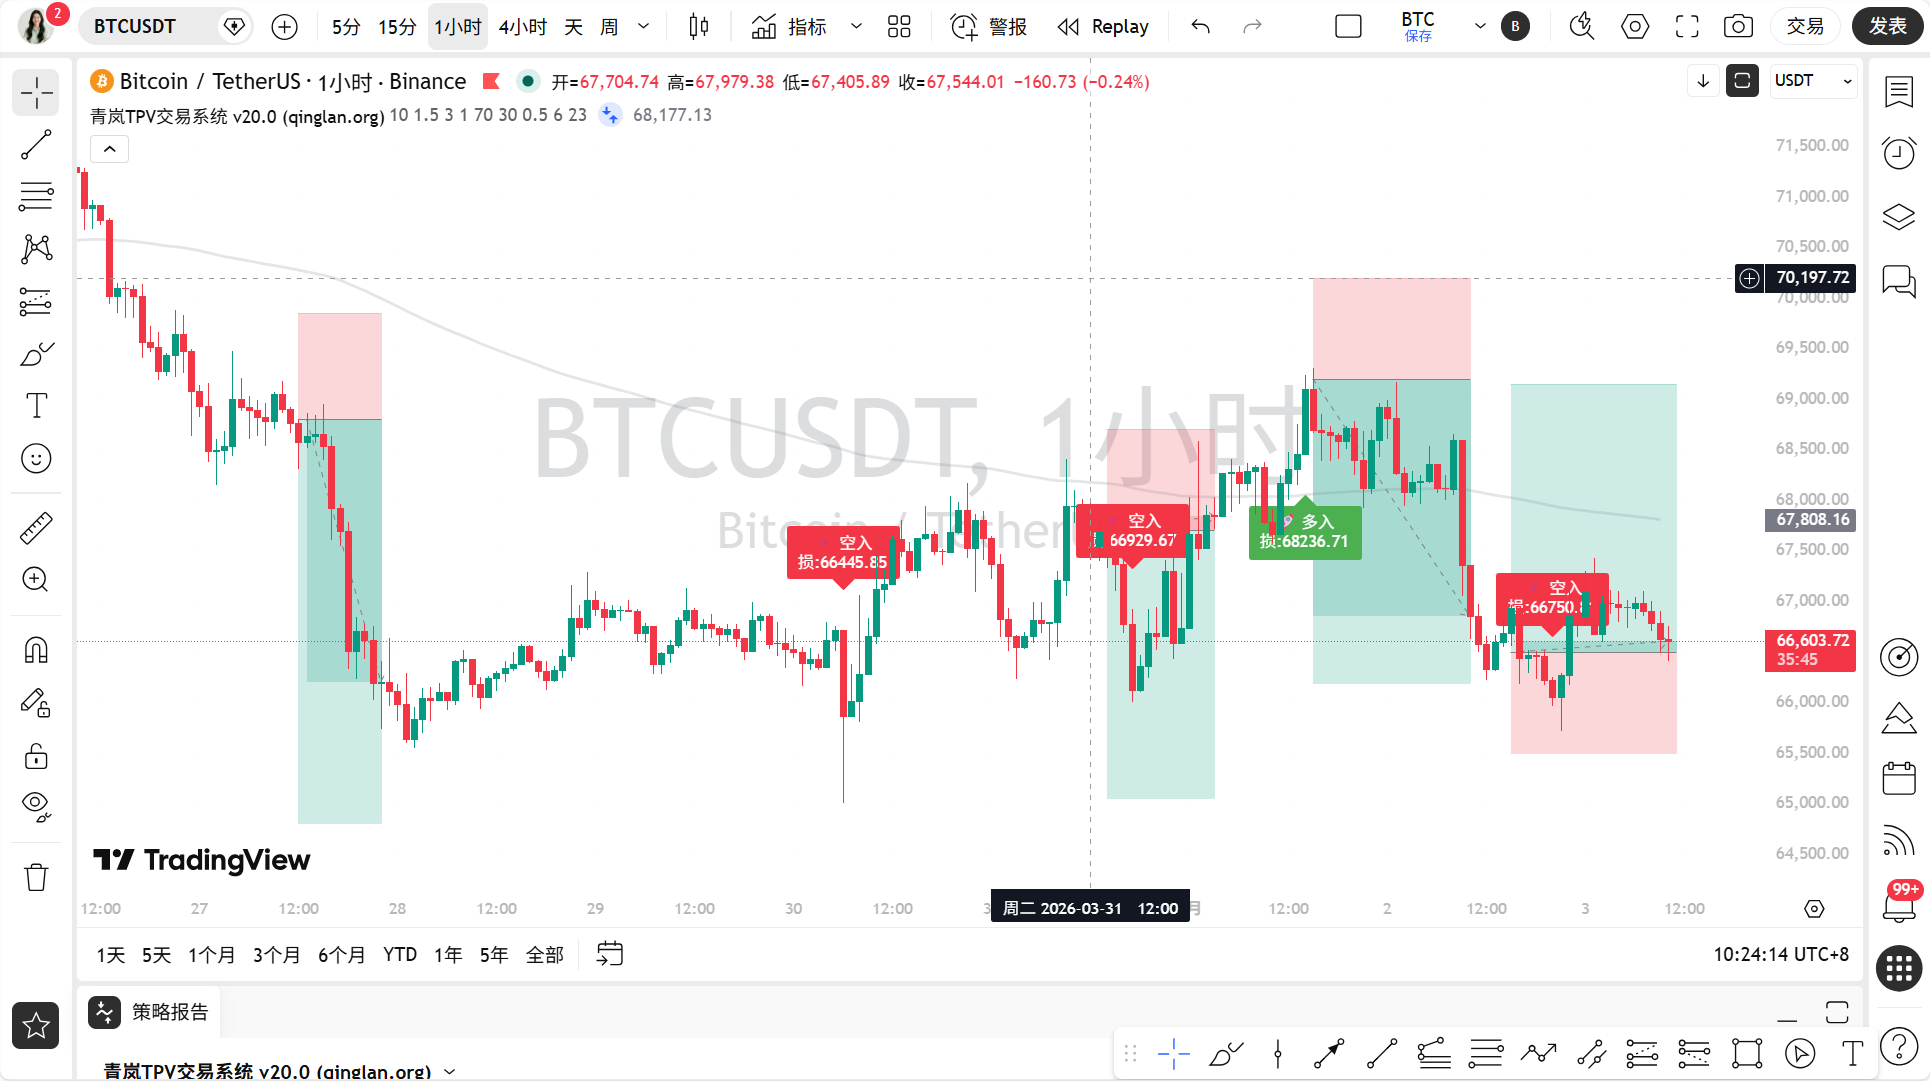
1-hour period: closing price 66613.01, below MA5 (66782.67), MA10 (66842.57), MA30 (66922.49), in a bearish arrangement. The price is slightly above the intraday low of 66412.13. The news mentions "Bitcoin briefly breaking $67,000," but it has currently retreated.
15-minute period: closing price 66613.01, below MA5 (66637.82), MA10 (66733.03), MA30 (66870.45), in a bearish arrangement. The price is at the lower edge of a very short-term fluctuation. Bearish news (ETF net outflow, losses approaching $600 billion) has intensified short-term selling pressure.
Step 2: Find pivot points and draw key lines (valid highs and lows + trend lines)
1-day period: valid high point 67000.0 (from the 4h maximum price series, recently touched), valid low point 66412.13 (from the 4h minimum price series, recently a new low). The downward trend line resistance is clear.
4-hour period: valid high point 67000.0 (from the 1h maximum price series), valid low point 66412.13 (from the 4h minimum price series). The price is testing support at the low point.
1-hour period: valid high point 66930.79 (closing price series), valid low point 66412.13 (minimum price series). A small fluctuation range is formed.
15-minute period: valid high point 66630.01 (maximum price series), valid low point 66412.13 (minimum price series). Very short-term fluctuations occur within a narrow range.
The news "Bitcoin briefly breaking $67,000" corresponds to the high point testing on the hourly level but failed to stabilize, forming a valid high point.
Step 3: Indicators to assist (technical indicators verification)
1-day period: MACD histogram -294.17, DIF below DEA, bearish momentum continues after the death cross. RSI is 37.89, close to oversold but not extreme, trend is weak. Confirms bearish trend.
4-hour period: MACD histogram -119.85, DIF below DEA, bearish momentum. RSI is 39.49, neutral but leaning weak. Indicators support the downward trend.
1-hour period: MACD histogram 39.00, but DIF (-158.19) remains below DEA (-197.19), no valid golden cross formed, momentum is weak. RSI is 62.42, in the neutral strong area, slightly diverging from the price drop, caution needed for short-term rebound but the trend is unchanged.
15-minute period: MACD histogram -40.31, bearish momentum. RSI is 28.91, entering the oversold area, indicating that there might be technical rebound demand in the short term.
Step 4: Bull vs Bear (news + on-chain)
News:
Bearish factors: "Yesterday, the U.S. Bitcoin ETF had a net outflow of 2254 BTC," "Bitcoin has a loss of nearly $600 billion, retail selling pressure continues to suppress the market," "44% of Bitcoin's circulating supply is in loss," "Riot Platforms transferred another 500 BTC, possibly for sale." The core factor is the continuous outflow of ETF funds and the selling pressure caused by massive losses, which is affecting the market.
Bullish factors: "Circle is about to launch a 1:1 Bitcoin-backed wrapped token cirBTC," "Coinbase received conditional approval from OCC and will establish a national trust company," which is beneficial for long-term ecological construction, but offers limited short-term price stimulation.
Technical and news consensus: The bearish arrangement in technicals resonates with capital outflows and market panic sentiment, pointing to downward pressure.On-chain data:
The fear and greed index is 9, indicating "extreme fear," with market sentiment being extremely pessimistic. BTC's dominance is 56.11%, data does not show changes, but high dominance shows that funds have not significantly flowed into altcoins during the decline. Total market cap 2.38 trillion, 24-hour change -0.25%, with slight capital outflow. On-chain data resonates with the technical bearish trend, confirming the market is in a panic selling phase.
Step 5: Path of least resistance (trading strategy)
In summary, the multi-period bearish arrangement, extreme fear sentiment, and predominance of bearish news indicate the path of least resistance is downwards. However, the 15-minute RSI is oversold, so caution is needed for short-term rebound.
Key entry zone (short): Rebound to the 66800-67000 area (referring to the valid high point of 66930.79 on the 1-hour and the resistance of 67000.0 on the 4-hour).
Stop-loss basis: Valid breakout and stabilization above 67200 (referring to the 1-hour MA30 of 66922.49 and the previous high).
Target area: First target 66400 (recent low point support), second target below 66000 (referring to the previous low area an hour ago).
Today's trading thought: Mainly short, waiting for signals of weak rebounds, do not chase shorts.
Step 6: How the day will go (market prediction)
Current (within a few hours): Expected to weakly oscillate between 66400 and 66800, possibly accompanied by slight technical rebounds, but overall under pressure.
Today and recent key: Today's most important support level 66412.13 (recent valid low point), if broken, it may accelerate the decline to 66000. The most important resistance level is 67000.0 (recent valid high point). Attention is needed on the suppression of the downward trend line.
Trading thought: The only suitable direction for trading currently is to short on the upside. Reason: Multi-period trend is down, sentiment and news resonate bearishly, any rebound provides better short entry points.
Summary: The current core contradiction in the market is the continuous selling pressure from massive floating losses and extreme fear sentiment, countering any weak buying or technical rebound demand.
Trading saying: When "floating losses" become the headline news, the market is not looking for a bottom, but the next support.
📊 Qinglan TPV Trading Strategy 🕒 Last backtesting time 04-03 10:09:46
Total analysis: 567 Backtest: 555 Accuracy: 71.4% (396/555)
[Qinglan's personal view]
Oh dear, the market looks really distressing, on-chain data shows "extreme fear." We should understand that at such times, we are often not far from the real panic bottom, but do not rush to catch falling knives. My insight is that the trend friends have not turned yet, so we continue to follow it, waiting for a decent rebound signal to consider shorting, or wait for sentiment indicators to come back from the extremes. The market will always give opportunities to the patient.
This TPV system is something I have refined over the years of tracking the market, backtesting, and practical application. I dare not say it is 100% accurate, but it can at least give us more confidence at key positions. If you want to get the latest entry opportunities captured by my TPV system as soon as possible, feel free to visit the Qinglan Crypto Classroom official website www.qinglan.org
免责声明:本文章仅代表作者个人观点,不代表本平台的立场和观点。本文章仅供信息分享,不构成对任何人的任何投资建议。用户与作者之间的任何争议,与本平台无关。如网页中刊载的文章或图片涉及侵权,请提供相关的权利证明和身份证明发送邮件到support@aicoin.com,本平台相关工作人员将会进行核查。