Hello everyone, I am your old friend, Odaily's special invited market analyst Cody. Before starting today's Bitcoin market analysis, I want to say a word to everyone:
Tomorrow is the first day of the Lunar New Year, and I would like to wish all readers a Happy New Year in advance.
In the past year, the market has fluctuated continuously, with phases of smooth sailing as well as tests of repeated volatility. Regardless of the investment results of this year, I hope that in the new year, all readers can maintain a stable mindset, clear rhythm, and controllable risks.
Cody also sends the most sincere blessings:
Wishing everyone a successful new year, immediate blessings, a consistently profitable account, and family safety.
Holidays are short, but the market will not stop.
Returning to the market itself, during this special time window of the Spring Festival, Bitcoin's price structure, capital behavior, and market sentiment are showing some changes that are worth paying particular attention to.

Weekly Trading Report Core Summary:
• Trend Structure Update: Analysis of the internal C-2 wave trend in the Bitcoin decline C wave, and interpretation of the future C-3 wave downward trend structure after the rebound ends. (Detailed explanation see Figure 1)
• Strategy Execution (Short-Term) Effectiveness Verification: Last week's trading followed the established short-term strategy, completing a second short-term operation (1x leverage), successfully achieving a cumulative return of approximately 4.01%. (Detailed explanation see Table 1)
• Strategy Execution (Mid-Term) Effectiveness Verification: Last week, following the established mid-term strategy, continued to hold a short position opened at $89,000 (1x leverage), with a profit of approximately 22.71% by last week's close, and a maximum profit of approximately 32.58% during this period.
• Core Viewpoint (Short-Term) Verification: Last week, Bitcoin gained support around$65,000 and transitioned into a volatile rebound, with multiple technical signals indicating this position may become the low point of C-1 wave. The current trend aligns with previous expectations of an oversold rebound in C-2 wave, and the market structure is gradually transitioning to a repair phase.
The following text will review market predictions, strategy execution, and specific trading processes in detail.
1. Detailed Explanation of Internal Three-Stage Adjustment Structure of Bitcoin C Wave
Bitcoin Daily K-Line Chart
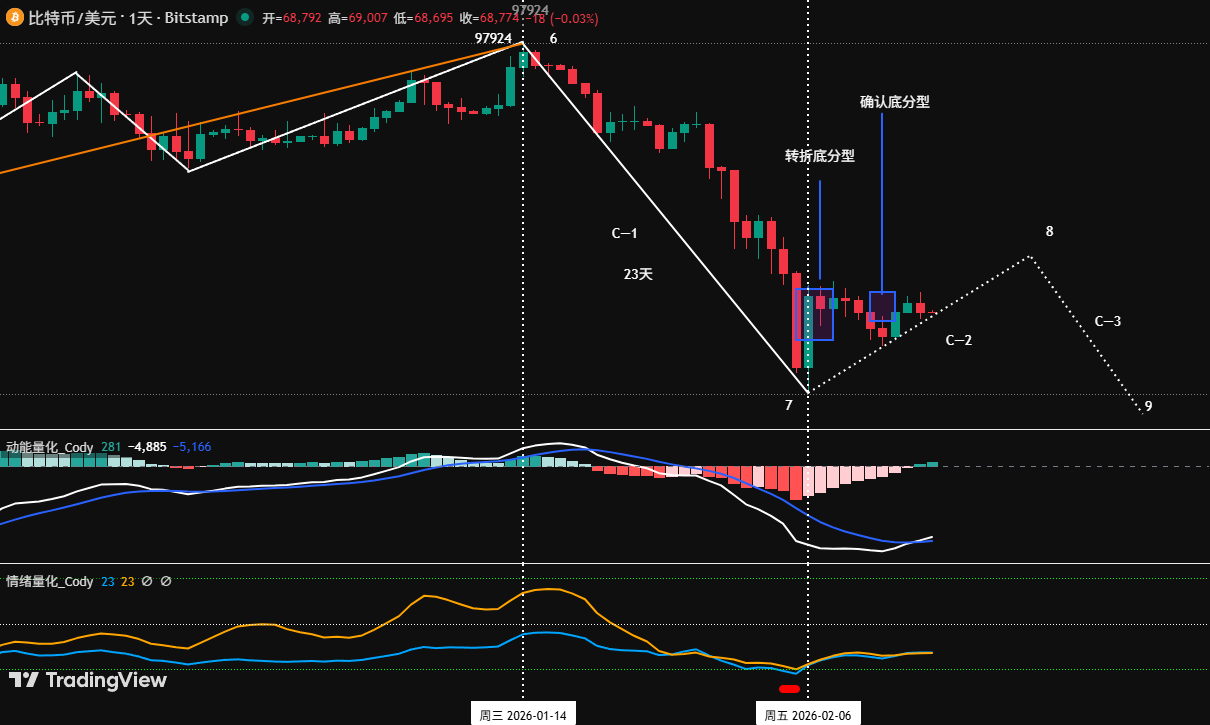
Figure 1
The author has clearly pointed out in the weekly review on February 8 that the adjustment of Bitcoin since its peak on October 6, 2025, follows the classic A-B-C three-wave structure and has speculated on several possible trend structures appearing in the internal C wave. Currently, given the clear three-stage sub-wave structure in both A wave and B wave, following the principles of pattern alternation and consistency in wave theory, it is most probable that the internal C wave will also complete the adjustment with a three-stage (i.e., C-1, C-2, C-3) structure.
Next, we will analyze in detail the possible three-stage adjustment trend structure of the internal C wave:
1. Overview of the Main Decline Stage of C Wave
• Time and Magnitude: The C wave began on January 14, 2026, and when this analysis was conducted, it had been in operation for about 32 days, with a maximum decline of 38.7%. This aligns with C wave being the "main decline wave," which typically exhibits the largest magnitude and intense movement.
2. C-1 Wave: Segments 6-7 in the figure, first round of driven decline (already completed)
• This decline lasted from January 14 to February 6, spanning 23 days, the target was achieved by pushing the price down to near$60,000, forming the first "foot" of C wave.
3. C-2 Wave: Segments 7-8 in the figure (dashed area), rebound correction stage (currently ongoing)
• Current Phase: The rebound starting from the February 6 low can currently be defined as C-2 wave.
• Technical Pattern Confirmation: On the daily chart, the K-line combination formed from February 5 to 8 created a "reversal bottom pattern", initially suggesting a depletion of downward momentum. Subsequently, from February 11 to 13, the K-line further formed a "confirmation bottom pattern", enhancing the validity of February 6 as the short-term bottom. Currently, the price is oscillating upwards along the short-term upward trend line formed by connecting the lows of February 6 and 12. If there are new changes in the market operation trajectory later, I will share them with everyone at that time.
• Key Resistance Area: Based on historical price behavior, the primary resistance area for C-2 rebound is near $74,500. This area not only constitutes the lower boundary of the previous fluctuation center but also resonates with the 50% Fibonacci retracement level of the A wave decline and other key technical points. The more significant pressure area is located near $79,500, which is an intensive trading zone (fluctuation center) formed during the previous decline of C-1, and is expected to pose strong resistance.
4. C-3 Wave: Segments 8-9 in the figure (dashed area), final downward segment (may occur in the future)
• Technical Pattern Confirmation: On the daily chart, an effective breakdown of the short-term upward trend line formed by connecting the lows of February 6 and 12 might be a key condition for determining the formation of C-3 wave.
• This adjustment stage will need to break below the February 6 low (approximately $60,000) to complete the integrity of the wave type. The time and space of the final decline will be determined by the strength and height of the C-2 wave rebound.
5. Core Viewpoint Summary:
The market is currently in the expected C-2 wave rebound phase. The strength and height of this rebound, especially whether it effectively breaks through the $74,500-$79,500 key resistance zone, will be critical for assessing the subsequent strength and target of the C-3 wave decline. Traders should closely monitor market reactions near the aforementioned price levels.
2. Review of Bitcoin's Operation Strategy and Key Price Levels from Last Week (02.09~02.15)
1. Review of Short-Term Operation Strategy: As shown in (Figure 2)
We strictly followed the trade signals issued by our self-constructed spread trading model and momentum quantitative model, combined with market trend predictions, to complete two short-term operations, achieving a cumulative profit of 4.01%.
Figure 2
• First Trade (Profit 2.12%):
• Opening Position: The price rebounded to near the $72,500 resistance line and encountered resistance, while the spread quantitative model triggered a top warning signal (green dot), combined with the momentum quantitative model signaling "from long to short," thus a 30% short position was established at$70,417.
• Risk Control: Initial stop-loss for the short position was set at $74,500.
• Closing Position: When it fell near $68,000, the K-line combination showed a bottom signal along with two models' bottom resonance signals, we closed all positions at$68,924.
• Second Trade (Profit 1.89%):
• Opening Position: The price rebounded near the short-term downward trend line and showed a resistance signal. Additionally, the momentum quantitative model momentum line again "crossed down" below the zero axis, thus a 30% short position was established at$68,290.
• Risk Control: Initial stop-loss for the short position was set at $70,000.
• Closing Position: When it encountered resistance near $66,500, combined with two models' bottom resonance signals, we closed all positions at$67,000.
Bitcoin 30-Minute K-Line Chart: (Momentum Quantitative Model + Spread Trading Model)
2. Mid-Term Operation Strategy Review:
Mid-term strategy: Continued to hold a60% short position opened near $89,000, with a profit of 22.71% at last week's close.
3. Key Price Levels Review:
Resistance level watches the $72,000-$74,500 area;
Support level watches the $60,000-$62,500 area.
3. Technical Indicator Analysis of Current Bitcoin Market: Comprehensive Assessment Based on Multiple Models and Dimensions
Combining market operations, the author conducted an in-depth analysis of multiple technical indicators of Bitcoin based on the self-constructed trading system, from various levels of multiple models and dimensions.
1. As shown in (Figure 3), analyzing from the weekly chart:
Bitcoin Weekly K-Line Chart: (Momentum Quantitative Model + Sentiment Quantitative Model)
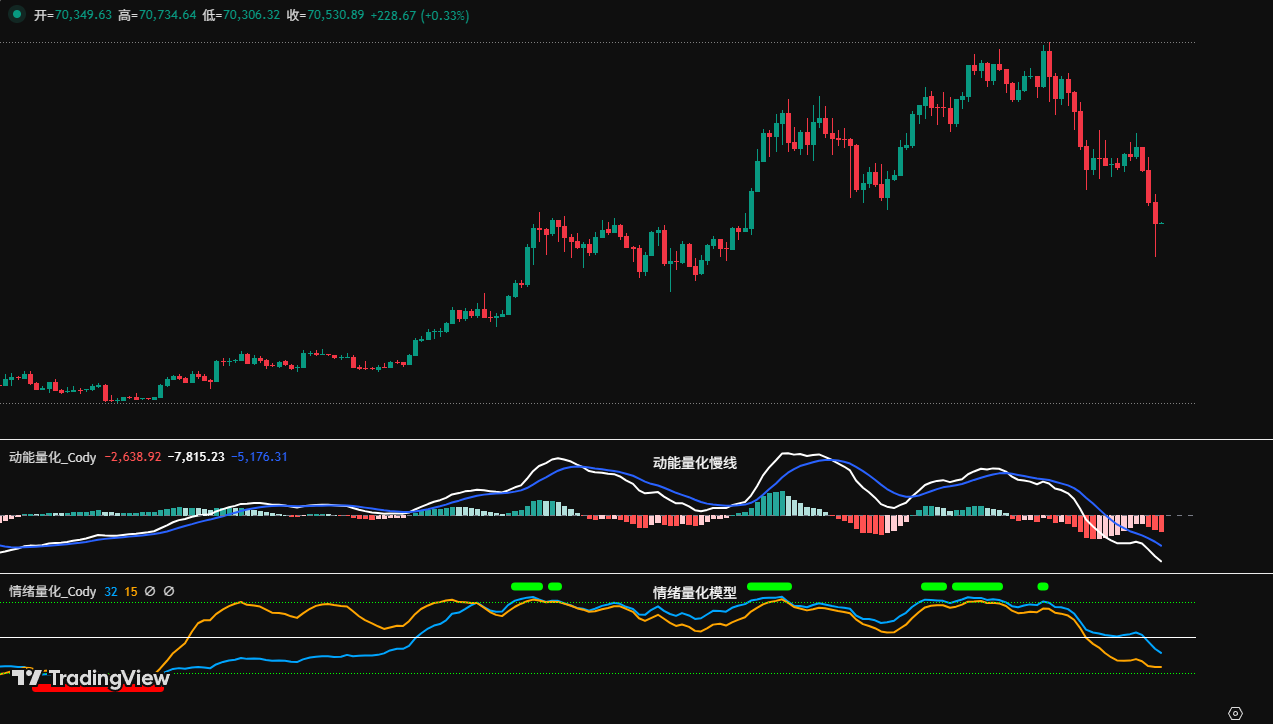
Figure 3
• Momentum Quantitative Model : Technical indicators show that the momentum line is synchronously declining, the negative energy bar is still expanding, but the expansion intensity is weakening, with no signs of momentum divergence appearing.
Momentum Quantitative Model Indicates: Bitcoin Price Decline Index: High
• Sentiment Quantitative Model: Blue sentiment line value is 34, intensity is zero; yellow sentiment line value is 10, intensity is zero, peak value is 0.
Sentiment Quantitative Model Indicates: Bitcoin Price Bottom Support Index: Neutral
• Digital Monitoring Model: No bottom digital monitoring signals have appeared.
Digital Monitoring Model Indicates: No digital bottom signals have appeared; the weekly K-line closed with a small negative line with upper and lower shadows, with a decline of about 2.15%.
The above data suggests: Bitcoin's weekly bearish trend, with narrowing declines. Currently, it belongs to a downward continuation pattern.
2. As shown in (Figure 4), analyzing from the daily chart:
Bitcoin Daily K-Line Chart: (Momentum Quantitative Model + Sentiment Quantitative Model)
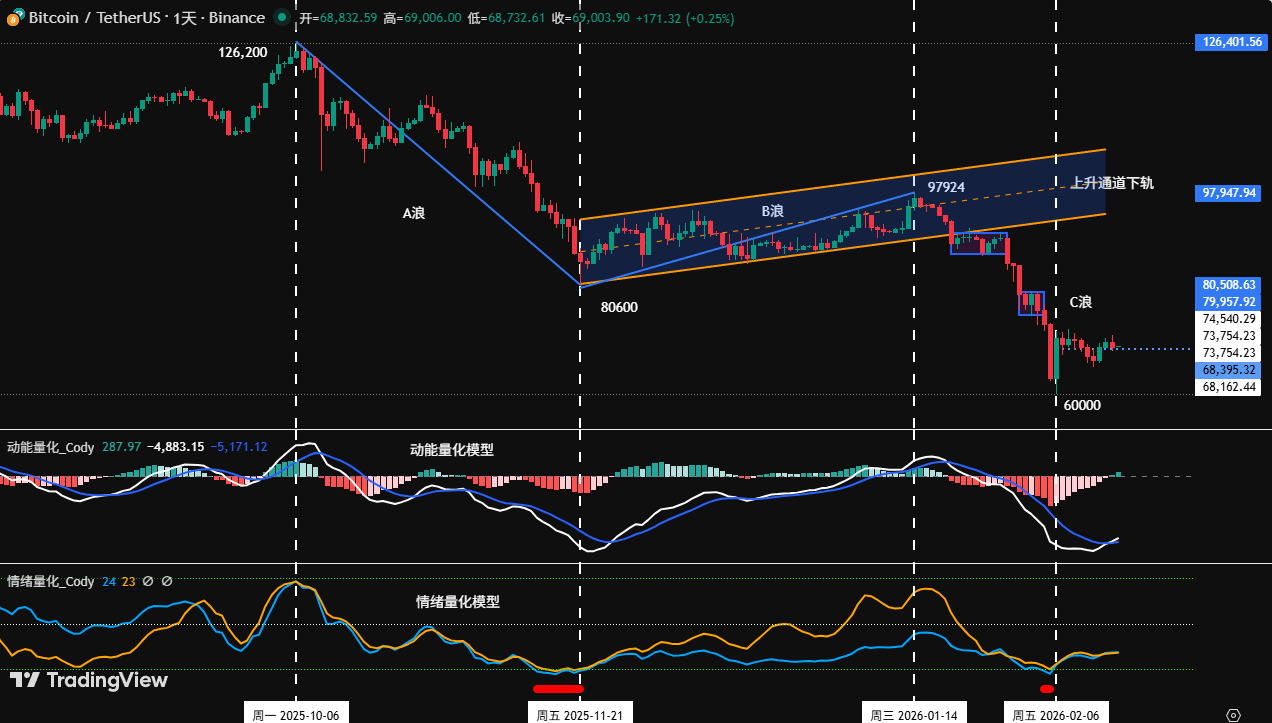
Figure 4
• Momentum Quantitative Model: Last week's market exhibited an overall "first suppressed then lifted" pattern. After Sunday trading, the momentum line formed the first "golden cross" below the zero axis, while the volume bar "turned positive from negative."
Momentum Quantitative Model Indicates: Bullish momentum is starting to accumulate, and the short-term trend is expected to gradually strengthen.
• Sentiment Quantitative Model: After the sentiment model triggered a bottom warning signal (red dot), both sentiment lines began to turn upwards. After Sunday trading, the sentiment line moved away from the oversold zone and started a slow upward movement.
Sentiment Quantitative Model Indicates: The timeliness of the bottom warning signal has been validated by the market, and the sentiment line is slowly turning upwards, with market oversold emotions being repaired.
The above data hints: The bearish trend at the daily level has not changed, the current trend belongs to an oversold rebound nature, currently indicating a potential small-level rebound; please control short-term long positions appropriately.
4. Market Forecast for This Week: (02.16~02.22)
1. Core Viewpoint for This Week: The current C-2 wave rebound market has likely formed, focus on the performance of long and short competition when the currency price rebounds to the core resistance area.
• For investors who participated in this round of short-term rebound, the strategy should be to "reduce positions at highs, lock in profits";
• For investors who are previously stuck, they should firmly execute "reduce positions at highs, roll over operations, control risks."
2. Core Resistance Levels:
• First Resistance Area: $72,000-$74,500 area (near last April's low)
• Second Resistance Area: $79,500-$80,600 area (near the starting point of B wave)
3. Core Support Levels:
• First Support Level: Near $65,000 (previous K-line bottom pattern low)
• Second Support Level: $60,000-$62,500 area (near the February 6 low)
• Third Support Level: $57,400 near (near the 210-week moving average)
5. Operation Strategy for This Week (Excluding Sudden News Impact): (02.16~02.22)
1. Mid-Term Strategy: Maintain a 60% short position. If the rebound effectively breaks through $74,500, the position can be reduced to 40%.
2. Short-Term Strategy: Use 30% position, set stop-loss points, and based on support and resistance levels, seek opportunities for "spread trading". (With 30/60 minutes as the operating cycle).
3. Since the mid-term direction of the market is bearish, short-term operations should follow the principle of "act in accordance with the trend, short at highs". To dynamically respond to the complex evolution of the market and combined with the signals issued by our self-built trading model, we propose two short-term operation plans, A/B:
• Plan A: If the currency price rebounds and encounters resistance in the $72,500-$74,500 area:
• Opening Position: When the rebound reaches this area and triggers a resistance signal combined with the model's top signal, a 15% short position can be established.
• Risk Control: Initial stop-loss for the short position should be set about 1.5% above the cost price (1.015*cost price).
• Closing Position: When it falls near an important support level and combined with model signals, positions can be gradually closed to secure profits.
• Plan B: If the currency price rebounds and encounters resistance in the $79,500-$80,600 area:
• Opening Position: When the rebound reaches this area and encounters resistance combined with the model's top signal, a 30% short position can be established.
• Risk Control: Initial stop-loss for the short position should be set about 1.5% above the cost price (1.015*cost price).
• Closing Position: When it falls to the support level and combined with model signals, positions can be gradually closed to secure profits.
6. Special Reminder:
1. When opening a position: Immediately set the initial stop-loss.
2. When profits reach 1%: Move the stop-loss to the opening cost price (break-even point) to ensure principal safety.
3. When profits reach 2%: Move the stop-loss to the position where the profit is 1%.
4. Continuous Tracking: After that, for every additional profit of 1%, the stop-loss will move 1% accordingly to dynamically protect and lock in gains.
The financial market is ever-changing, and all market analyses and trading strategies require dynamic adjustments. All viewpoints, analytical models, and operational strategies discussed in this article stem from personal technical analysis and are for personal trading logs only, not constituting any investment advice or operational basis. The market has risks; investment must be cautious, and please do not make decisions based on this.
免责声明:本文章仅代表作者个人观点,不代表本平台的立场和观点。本文章仅供信息分享,不构成对任何人的任何投资建议。用户与作者之间的任何争议,与本平台无关。如网页中刊载的文章或图片涉及侵权,请提供相关的权利证明和身份证明发送邮件到support@aicoin.com,本平台相关工作人员将会进行核查。


