Original title: Structural Weakness
Original authors: Chris Beamish, CryptoVizArt, Antoine Colpaert, Glassnode
Original translation: AididiaoJP, Foresight News
Bitcoin is still defending the range of $60,000 to $72,000, while the selling supply at $82,000 to $97,000 is suppressing the rebound space. Outflows, weak spot trading, and a cooling of futures all indicate insufficient demand, with prices being forced to passively react and struggling to break through actively.
Summary
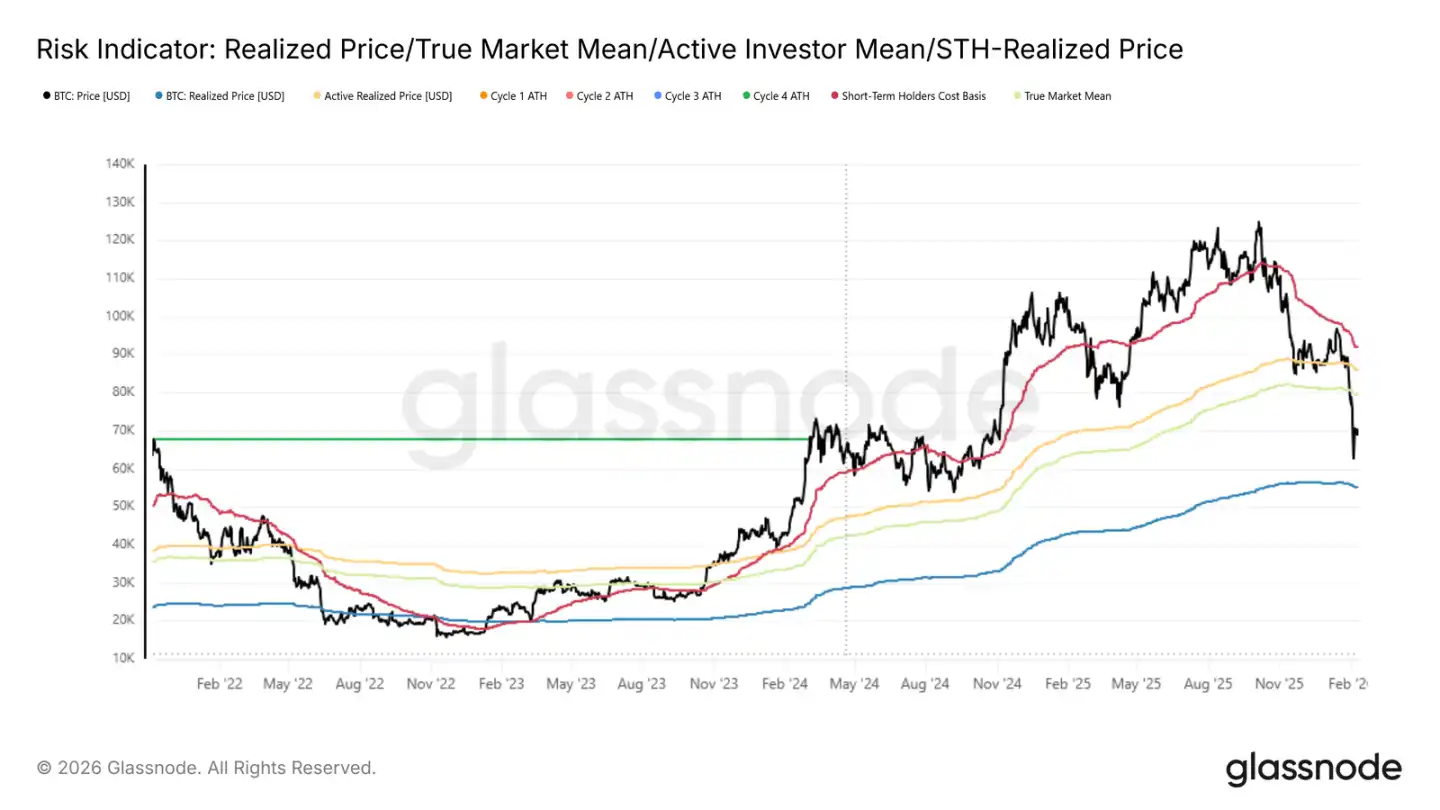
· Bitcoin is trapped between the real market average (approximately $79,200) and the realized price (approximately $55,000). After a structural weakening, the market has remained in a defensive state, with the range of $60,000 to $72,000 still absorbing selling pressure.
· $82,000 to $97,000 and $100,000 to $117,000 have accumulated a significant amount of chips, currently sitting at a loss, and encountering obvious resistance if rebounded to these levels.
· Short-term holders are generally at a loss, and new entrants lack confidence, making it difficult to pass the baton for upward movements.
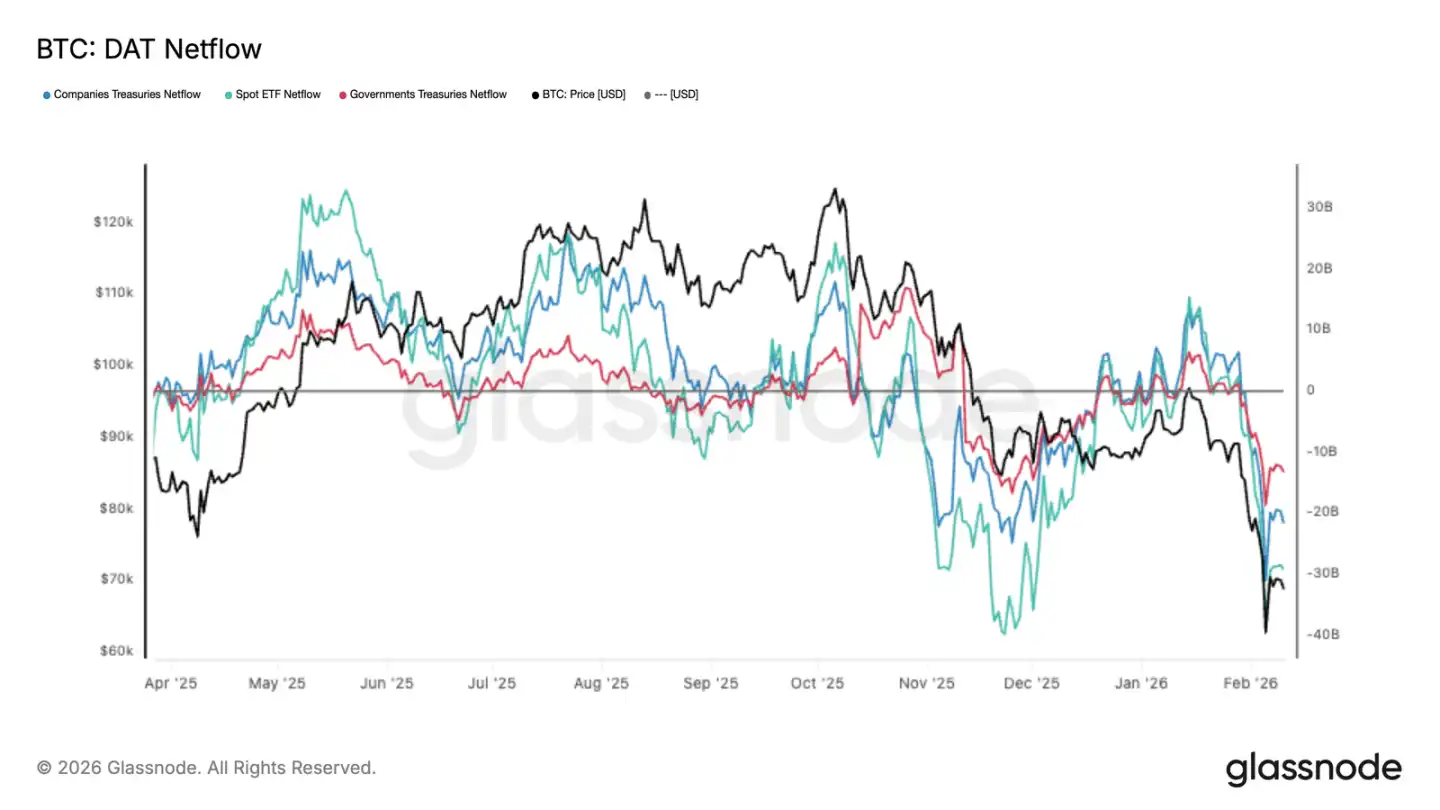
· Various institutional holdings of digital assets are synchronized with net outflows, which is not an isolated behavior, but rather an overall contraction of risk exposure, indicating insufficient spot absorption strength.
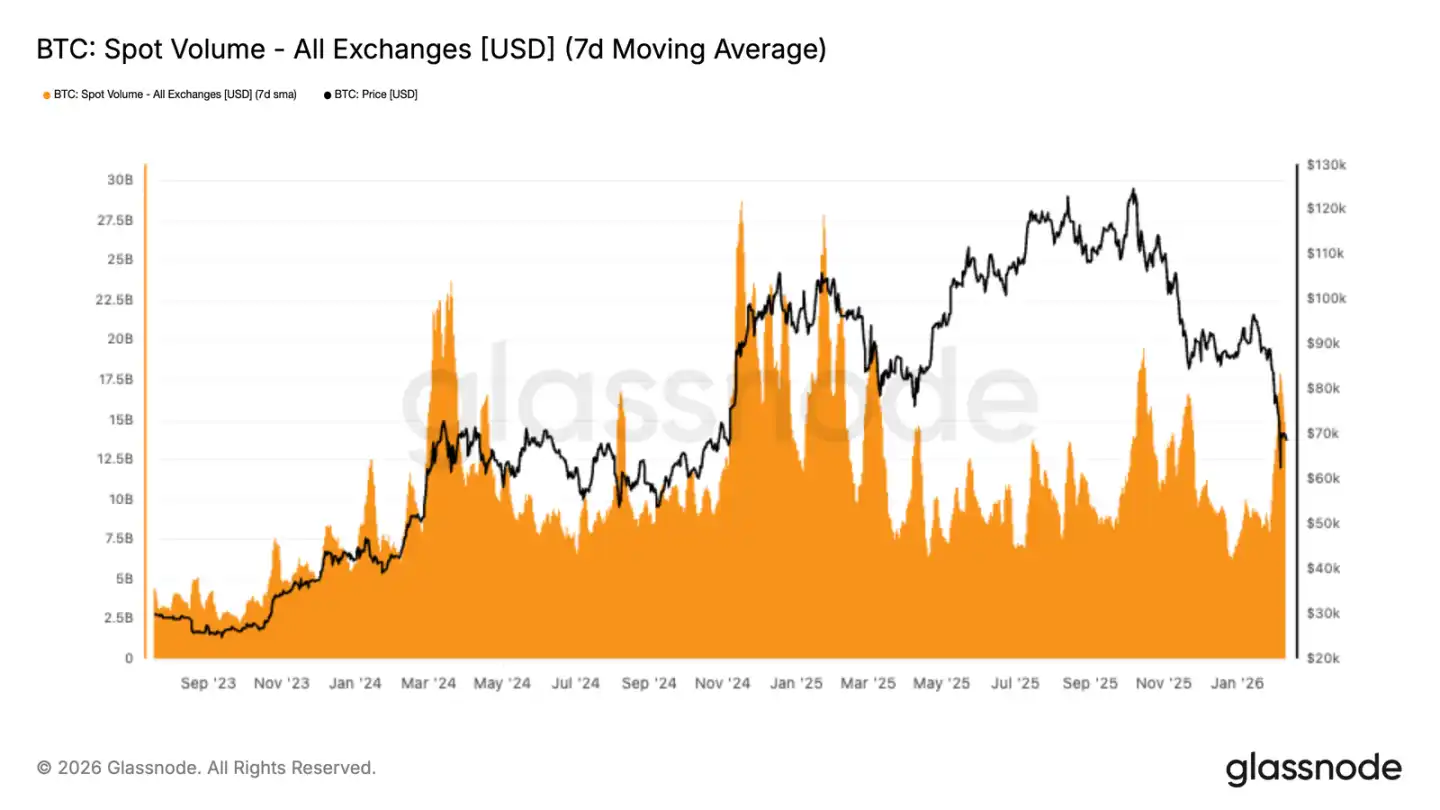
· Spot trading volume only spiked during the drop, then quickly shrank, indicating that participants are responding passively rather than actively bottom-fishing.
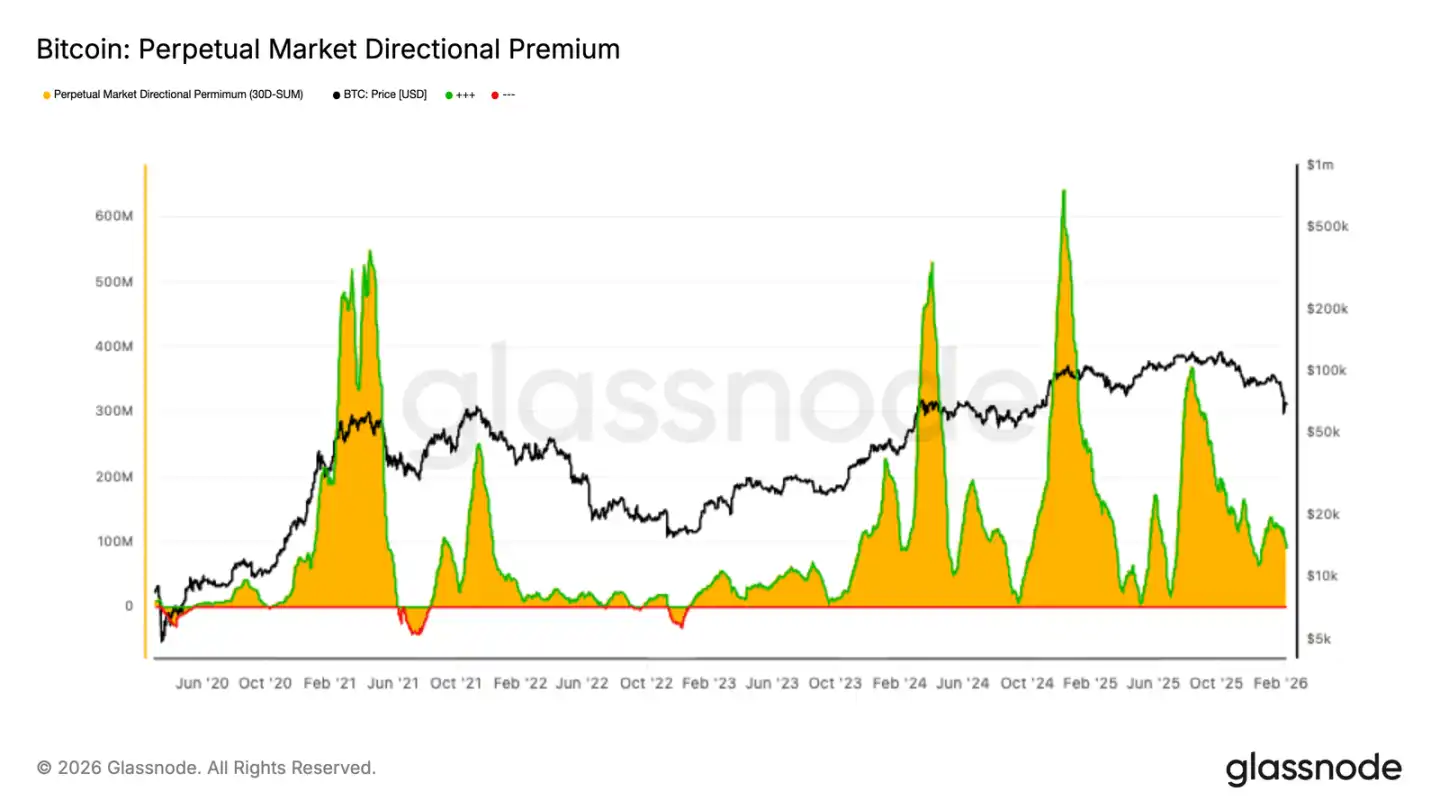
· Perpetual contracts have cooled, premiums have compressed, leveraged players have pulled back, and speculative sentiment has receded.
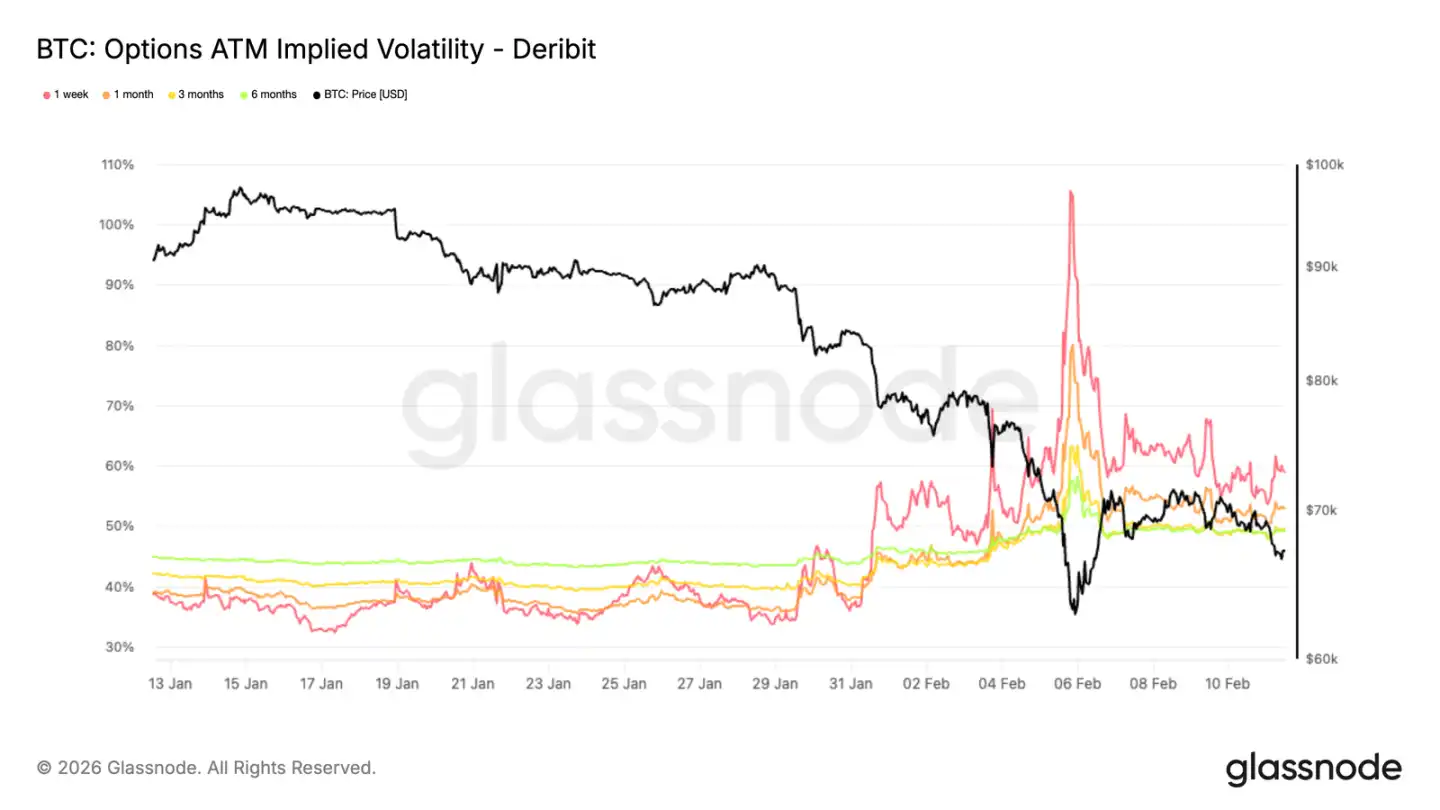
· Implied volatility shows that the market continues to buy protection, indicating a typical defensive posture.
· The option market's position structure makes it easy for prices to bounce back but hard to move far, as liquidity is already tight.
On-Chain Insights
After reaching a new high last October, Bitcoin went through three stages: first a sharp drop, repeatedly testing the real market average; then a sideways movement until late January this year; recently, the third phase—falling below the real market average and accelerating towards $60,000.
New Trading Range
The upper limit of the range in the third phase is the real market average of $79,200, and the lower limit is the realized price of $55,000, which resembles the structure in the first half of 2022.
Like in the second quarter of 2022, prices are likely to oscillate back and forth within this range, requiring time to磨, waiting for new buyers to gradually enter and take on inventory.
To break this situation in the short term, it must either be very strong—directly reclaiming the real market average of $79,200 and regaining strength; or very weak—experiencing an event on the scale of LUNA or FTX, breaking below the realized price of $55,000. Unless either extreme occurs, the most probable path for the market is to continue to grind within the range.
Holding Orders in the Range
So far, the range of $60,000 to $72,000 is still holding up against selling pressure. This range has been a dense trading area in the first half of 2024, and it is holding again, indicating that there are indeed buyers here.
The ideal situation would be if this level can continue to hold and absorb orders, similar to previous strong accumulation phases, which could lay a solid foundation for the next wave of increases.
However, this depends on how resolute the buying is. In the range of $60,000 to $72,000, how much real money buyers are willing to put in will determine whether the market stabilizes or fails to hold up under downward pressure.
Selling Pressure
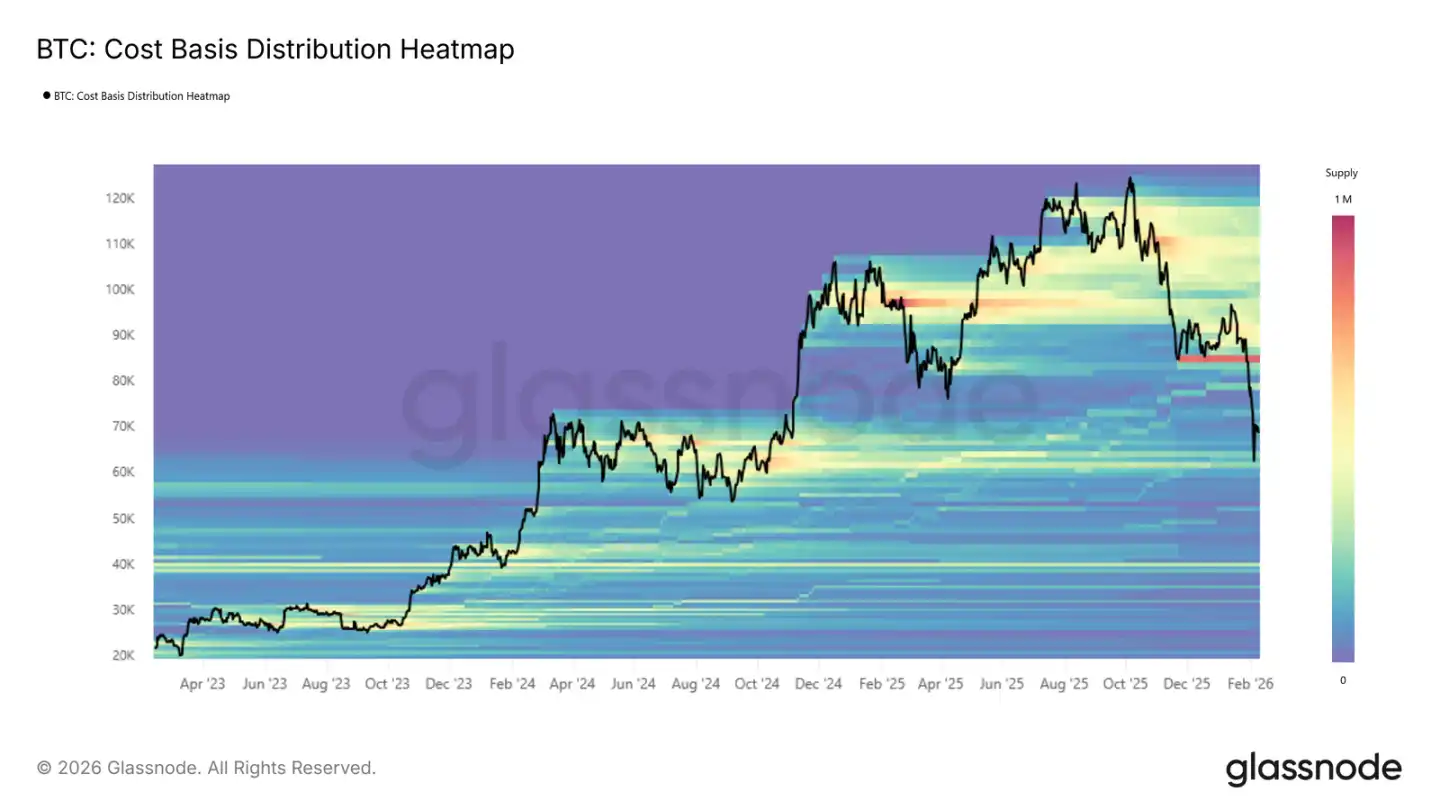
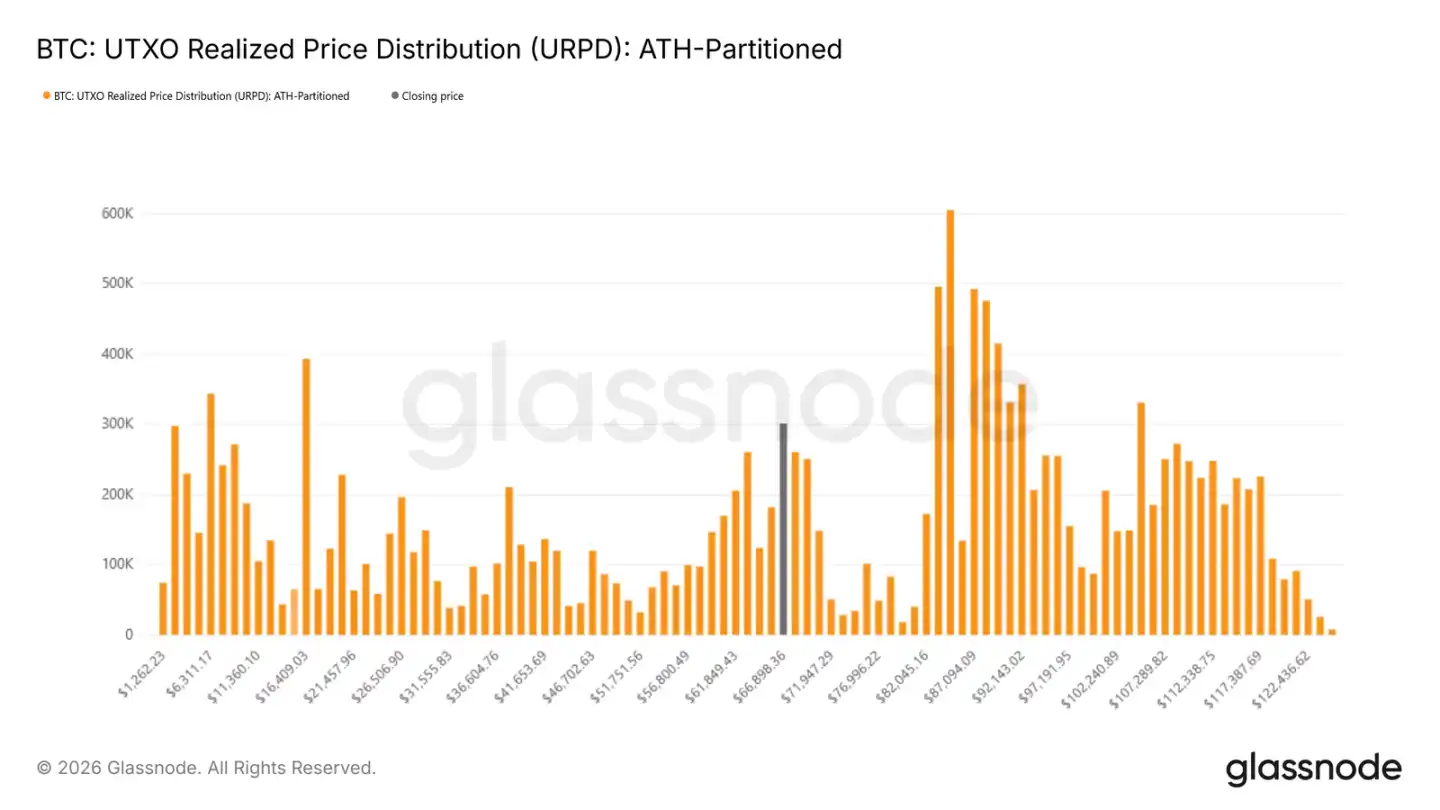
Whether the range of $60,000 to $72,000 is genuinely strengthening can be seen by the cost distribution. The UTXO realized price distribution reveals the concentration of chips at each price level. Currently, the prices in the dense area formed in the first half of 2024—$60,000 to $72,000—are supported, indicating that buyers from that time have not exited and are still holding orders.
However, the selling pressure remains heavy. The two ranges of $82,000 to $97,000 and $100,000 to $117,000 have a very dense trapped order. If prices struggle to rise for a long time or experience another wave of decline, these holders may not be able to withstand it and may cut losses, creating new selling pressure.
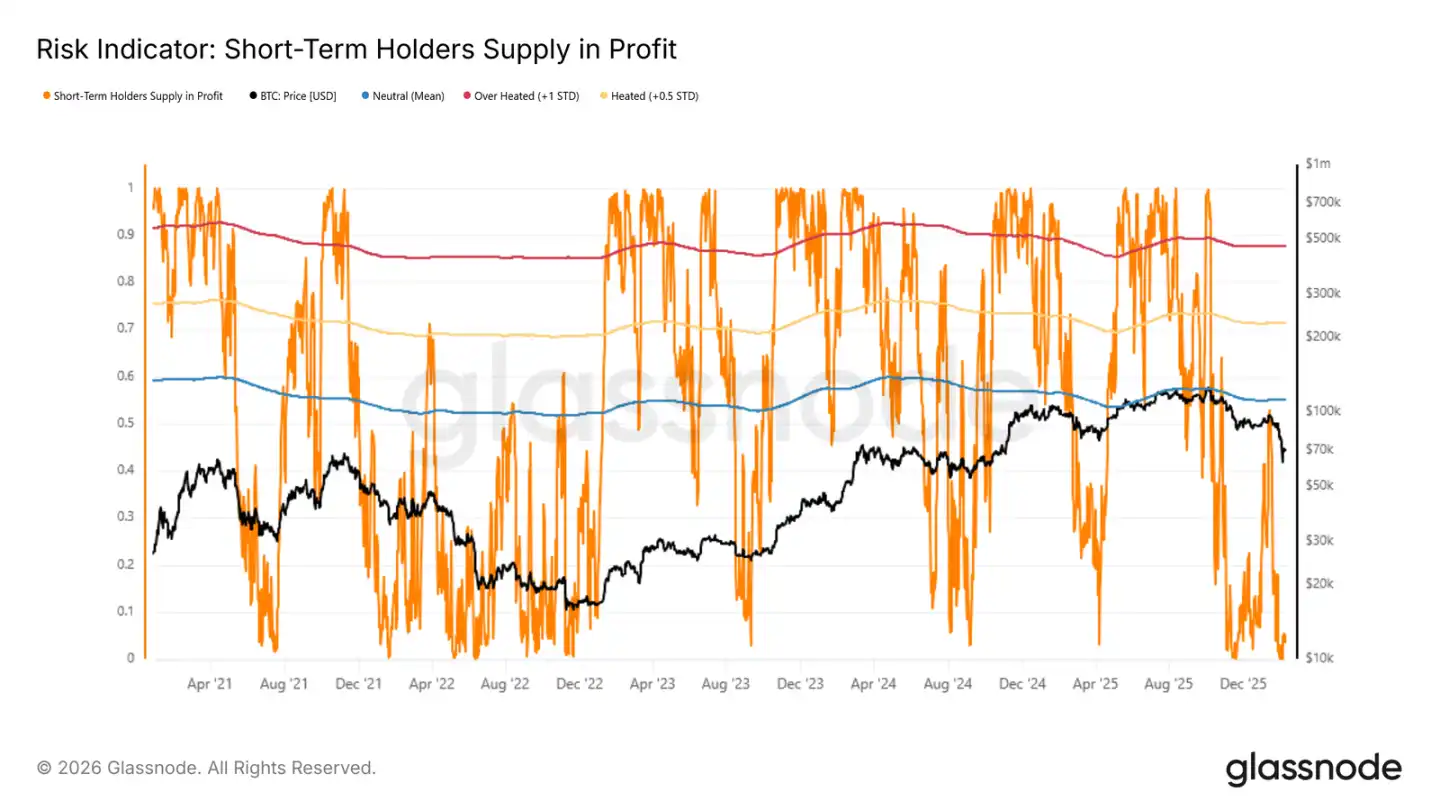
Bear Market Rebound Peak
Since the market is likely to grind within a range, identifying the phase peaks and troughs becomes crucial. In a bear market, rebounds are often seen by recent buyers as an opportunity to exit. Therefore, when these holders have significant unrealized gains, the local peak is often near.
The profit ratio of short-term holders is a suitable indicator to observe this. Historically, in bear market rebounds, when this indicator reaches the "mean to +0.5 standard deviations" range, it often struggles to continue rising. Currently, this number is only 4.9%, indicating that the vast majority of recent entrants are still trapped. Very few are in profit, making it difficult to rely on them for heavy selling, but it also reflects that the market is weak, with no new money coming in, making it hard for the rebound to last.
Off-Chain Insights
Institutional Funds are Withdrawing
The recent flow of funds into digital assets has turned negative very noticeably, with ETFs, corporations, and government institutions all experiencing net outflows, and Bitcoin has also hit a new low. ETFs are the main players, while corporations and governments are also reducing their holdings, indicating not just a single entity adjusting its positions but an overall contraction in the market.
The outflow volume is substantial, and spot markets cannot hold it. It is not a matter of some funds rotating; it is a comprehensive reduction in exposure. Unless these funds stabilize their outflows, prices will continue to be dragged by selling pressure, and the extent to which they decline will depend on when the willing buyers will enter the market.
Weak Spot Trading Volume
When it dipped to the lower range of $70,000, spot trading volume surged for a moment, and the 7-day average also increased. However, this volume resulted from the decline, with participants responding passively rather than actively bottom-fishing. Moreover, this volume shrank once it peaked, indicating that there are watchful eyes but no buyers.
This indicates that the strength of the order absorption is not keeping up with the selling strength. The current trading is not accumulation; it is turnover, it is liquidation. Without sustained buying orders in place, prices can easily be further driven down. The current spot volume is merely a panic response, not a stabilization signal.
Futures Premium Declined
The premiums for perpetual contracts have been compressed, essentially returning to neutral. This indicates that leveraged players have pulled back and are not as aggressive in chasing positions, regardless of direction. High premiums often reflect strong directional consensus, but now that the premiums are gone, it shows that the market has no ideas about direction.
The shrinking premiums reflect the overall inactivity in the derivatives market, and risk appetite has decreased alongside volatility. No one is opening short positions, and no one dares to chase longs; directional capital is very thin. Derivatives are no longer providing momentum, leaving the spot market to move on its own. The current futures market sends one signal: caution, no more trading.
Implied Volatility—Risk Pricing Has Changed
This drop signifies a distinct change in the volatility structure. Looking at the 1-month at-the-money implied volatility, it is evident that long-term volatility has been repriced: 6-month volatility has increased by 5 points, and 3-month volatility has increased by 9 points.
The most drastic jump occurred at the front end, with a direct spike of over 20 points in the 1-week implied volatility. Implied volatility is the market's expectation of future fluctuations, and such a significant spike cannot be temporary. The entire term structure is being repriced for risk.
Although it decreased a bit afterward, the volatility at various terms remains high, suggesting that the market believes uncertainty will persist, and it is not merely over after the drop.
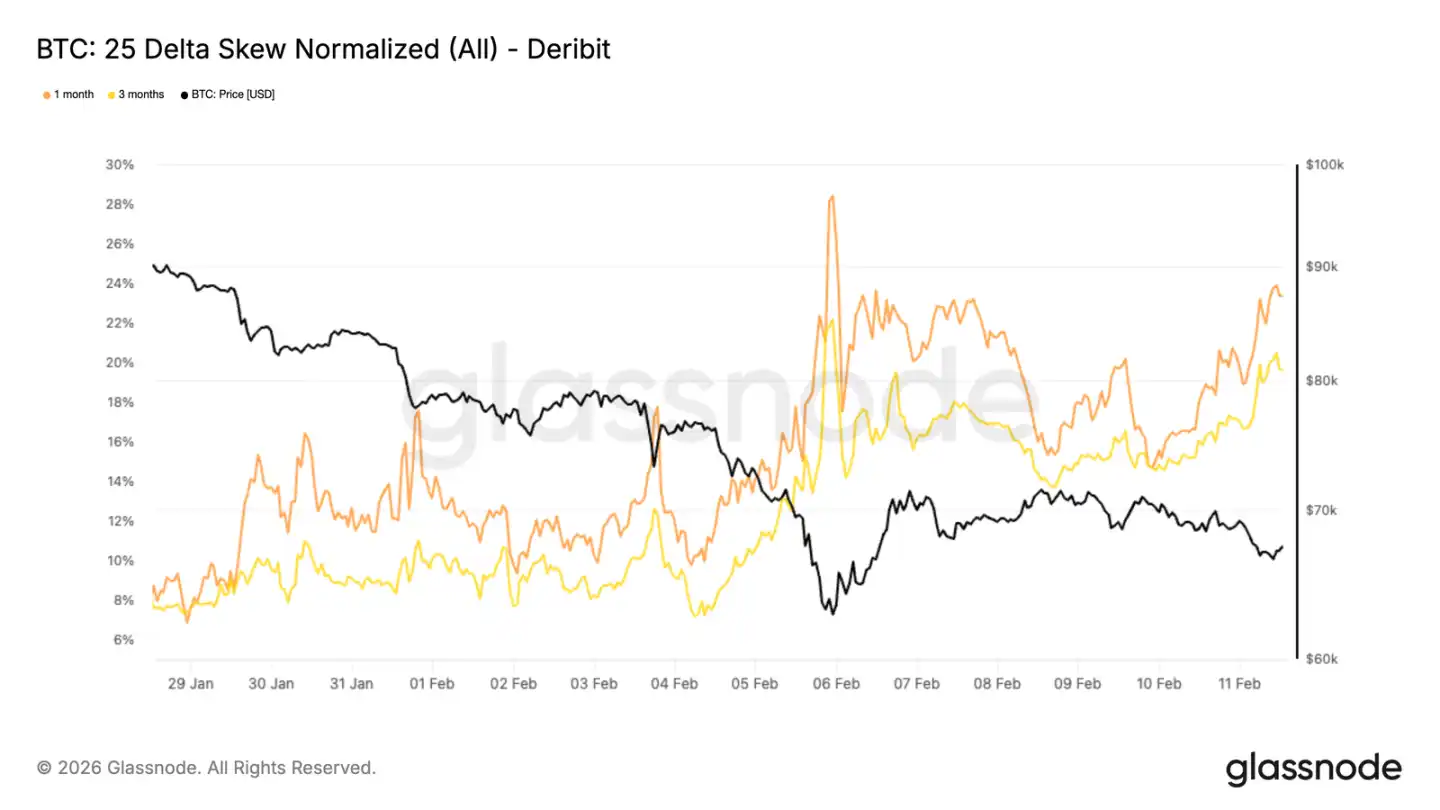
25 Delta Skew Indicates Continued Downward Demand
Overall volatility has stepped up, but to see where the money is flowing, we need to look at the skew. The 25 delta skew of the 1-month and 3-month options plunged sharply during the down days, indicating a rush to buy puts.
There was a rebound on Friday, but the premiums for put options remain high, essentially returning to the levels seen during the sharpest declines. The 25 delta skew compares the implied volatilities of out-of-the-money puts and calls, and being negative indicates that puts are more expensive than calls, meaning that participants are more willing to buy protection. On January 28, the 1-month and 3-month skew was about 8%, now it has risen to 23% and 19%.
The entire surface is still skewed towards puts; a rebound may occur, but fear remains unmitigated.
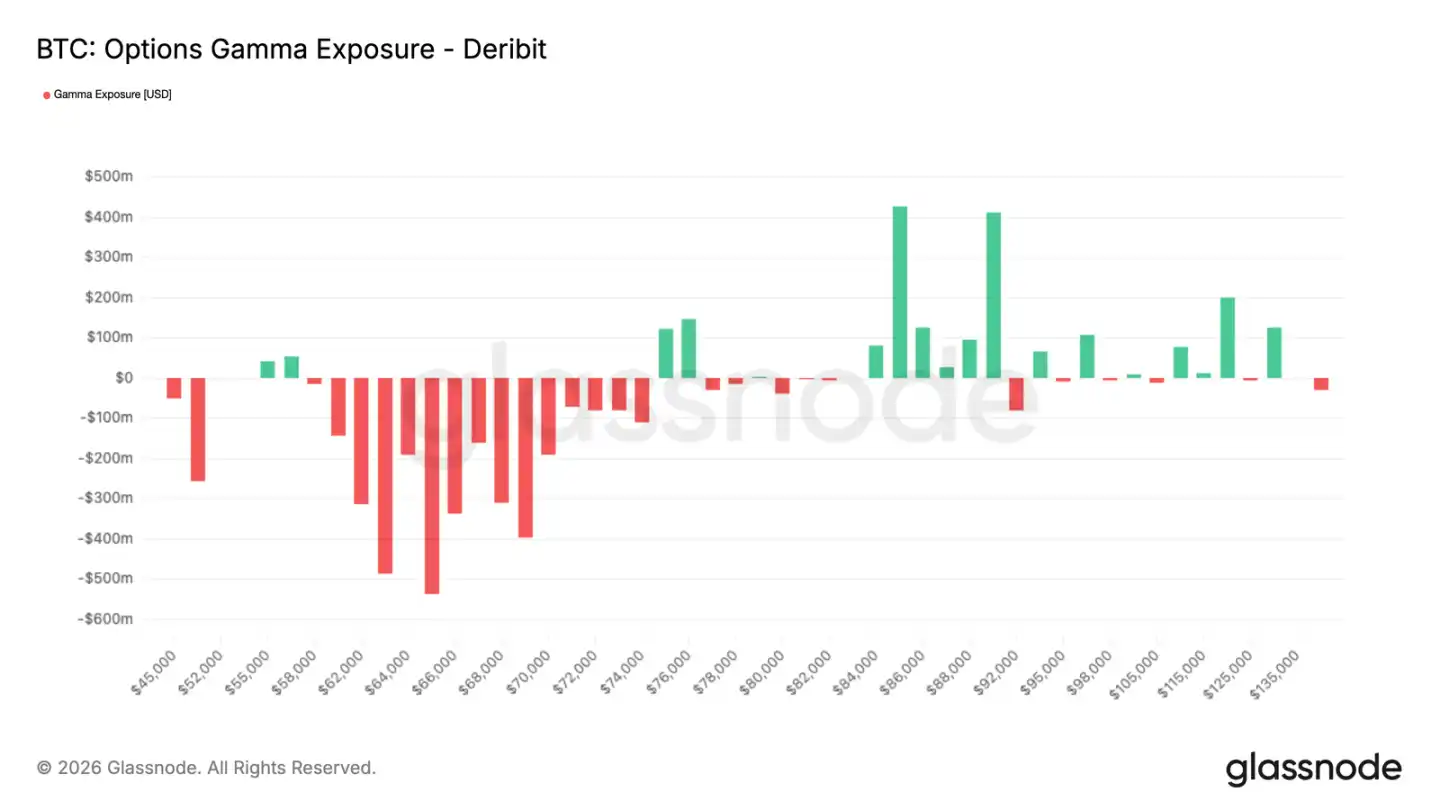
Market Maker Gamma—Price Rebound
This defensive option flow leaves traces on market makers' positions. When market makers are short gamma, they must chase buys when prices rise and chase sells when they decline, amplifying the volatility without dampening it.
The recent surge in put buying has left market makers' structures unable to recover since then. Although there has been a rebound over the past few days, this sensitivity has not been neutralized. The result is a very fragile market, which could be accelerated by hedge orders in either direction, with a greater probability of a downward plunge.
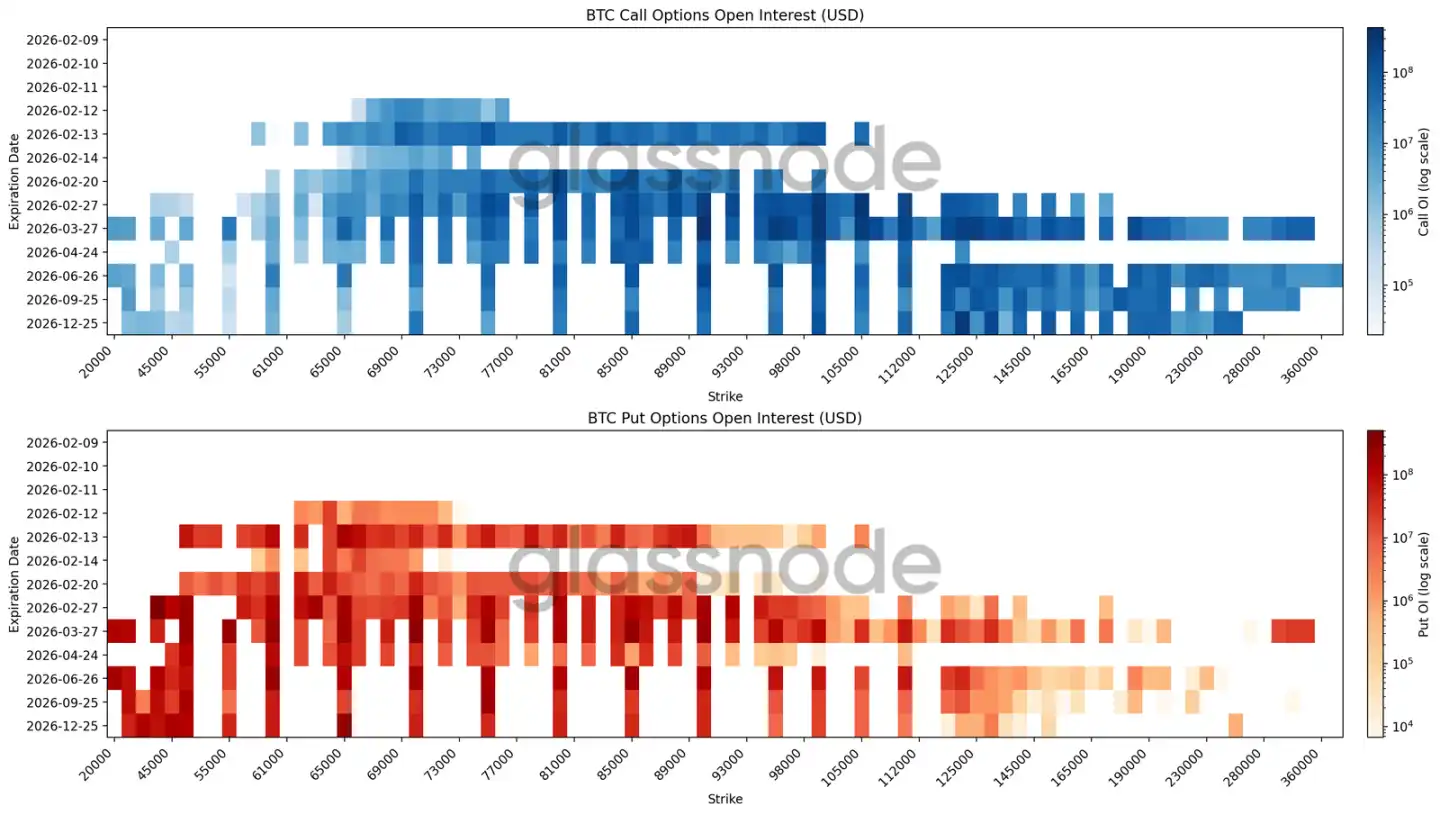
Open Interest Heatmap Shows Widespread Hedging
The latest heatmap overlays open interest in Bitcoin options at various strike prices and expiration dates, making it easy to see where money is concentrated and where pricing pressure may exist.
For February expiration, the largest buy orders are between $60,000 to $70,000. Looking further ahead, there are ample buy orders between $50,000 and $30,000 for contracts expiring at year-end and beyond.
This is not about betting on a specific point in time but rather providing downward protection across multiple timeframes. Moreover, it does not precisely target a specific level but fills a range, typical of range hedging. Call open interest is concentrated above $120,000 and in the second half of the year. Short-term bullish sentiment is being realized, while long-term bearish holders still keep it as tail risk, resulting in deep negative skewness.
The overall position structure is defensive, not betting on a reversal.
Conclusion
Bitcoin remains within a defensive structure, with prices trapped between several key cost levels, while the critical support area is being repeatedly tested. The range of $60,000 to $72,000 is still absorbing selling pressure, but the overhead selling pressure is heavy, short-term holders are losing money, and confidence is weak. In this state, the rebound is likely to get pushed back, needing sustained buying pressure to stabilize.
Off-chain data also supports this cautious assessment. Institutions are withdrawing, spot trading is passive rather than actively accumulating inventory. On the derivatives side, speculative sentiment has faded, hedgers continue to buy, and the structure of market makers has made prices very elastic, making it difficult to establish a direction.
Overall, the market is in a balance phase under pressure. Liquidity is thin, participation is scattered, and position structures are defensive. To change this situation, either the spot buying pressure must increase or risk appetite must return. Until then, volatility will still be dominated by short-term position games, not trends.
免责声明:本文章仅代表作者个人观点,不代表本平台的立场和观点。本文章仅供信息分享,不构成对任何人的任何投资建议。用户与作者之间的任何争议,与本平台无关。如网页中刊载的文章或图片涉及侵权,请提供相关的权利证明和身份证明发送邮件到support@aicoin.com,本平台相关工作人员将会进行核查。


