Core Summary: The current market shows a multi-cycle bearish resonance pattern, with a clear main downtrend on the daily and 4-hour charts. The rebounds on the 1-hour and 15-minute charts are technical corrections, not trend reversals. The news is filled with negative factors, and panic sentiment is spreading. Short-term operations should be cautious and wait for opportunities, acting in accordance with the trend.
Qinglan Crypto Class is now in session! BTC from four cycles + dual perspectives on news, guiding you to catch the rhythm of the crypto world.
I. Technical Analysis: Multi-Cycle Resonance, Bears Dominate the Market
Breaking down from long to short cycles, clarifying the trend characteristics and key levels of each cycle to provide references for operations:
1. Daily Chart (Long-Term Trend): Bear Market Structure Established, Trend Severely Damaged
The long-term trend on the daily chart has entered a deep bear market, with all technical indicators showing bearish dominance:
Trend: The current price is around 63,000, significantly below MA5 (around 70,000), MA20 (around 83,000), and all other moving averages, which are in a standard bearish arrangement, clearly diverging downwards, with no signs of stabilization.
Indicators: The MACD indicator formed a death cross below the zero line, with green bars (negative values) continuously expanding, and the downward momentum is weak; the RSI indicator has dropped to 17.39, entering a severely oversold zone, with no divergence signals currently, and oversold does not indicate a bottom has been established.
Key Levels: The previous bull market high of 69,000 has been effectively broken, turning into a strong resistance level, with clear pressure on rebounds; there is no clear technical support below, with only 60,000 and 58,000 serving as psychological support levels.
2. 4-Hour Chart (Medium-Term Trend): Main Downtrend Continues, Rebound Lacks Strength
The medium-term trend is in sync with the long-term trend, with the main downtrend continuing to push forward, and rebound momentum is insufficient:
Trend: The moving average system is in a bearish arrangement, with prices suppressed by moving averages across all cycles, showing no effective breakthrough momentum. A recent candlestick had a lower shadow, but the closing price was below the opening price, representing a typical continuation pattern of decline, with further downward space likely.
Indicators: The MACD green bars have reached new lows, with medium-term downward momentum continuing to accelerate; the RSI indicator has dropped to 15.13, lower than the daily level, indicating strong stability in the bearish trend.
Key Levels: Short-term resistance levels are 65,000 (previous low turned resistance) and 68,000; support levels to watch are the psychological level of 60,000, which, if broken, will further open up downward space.
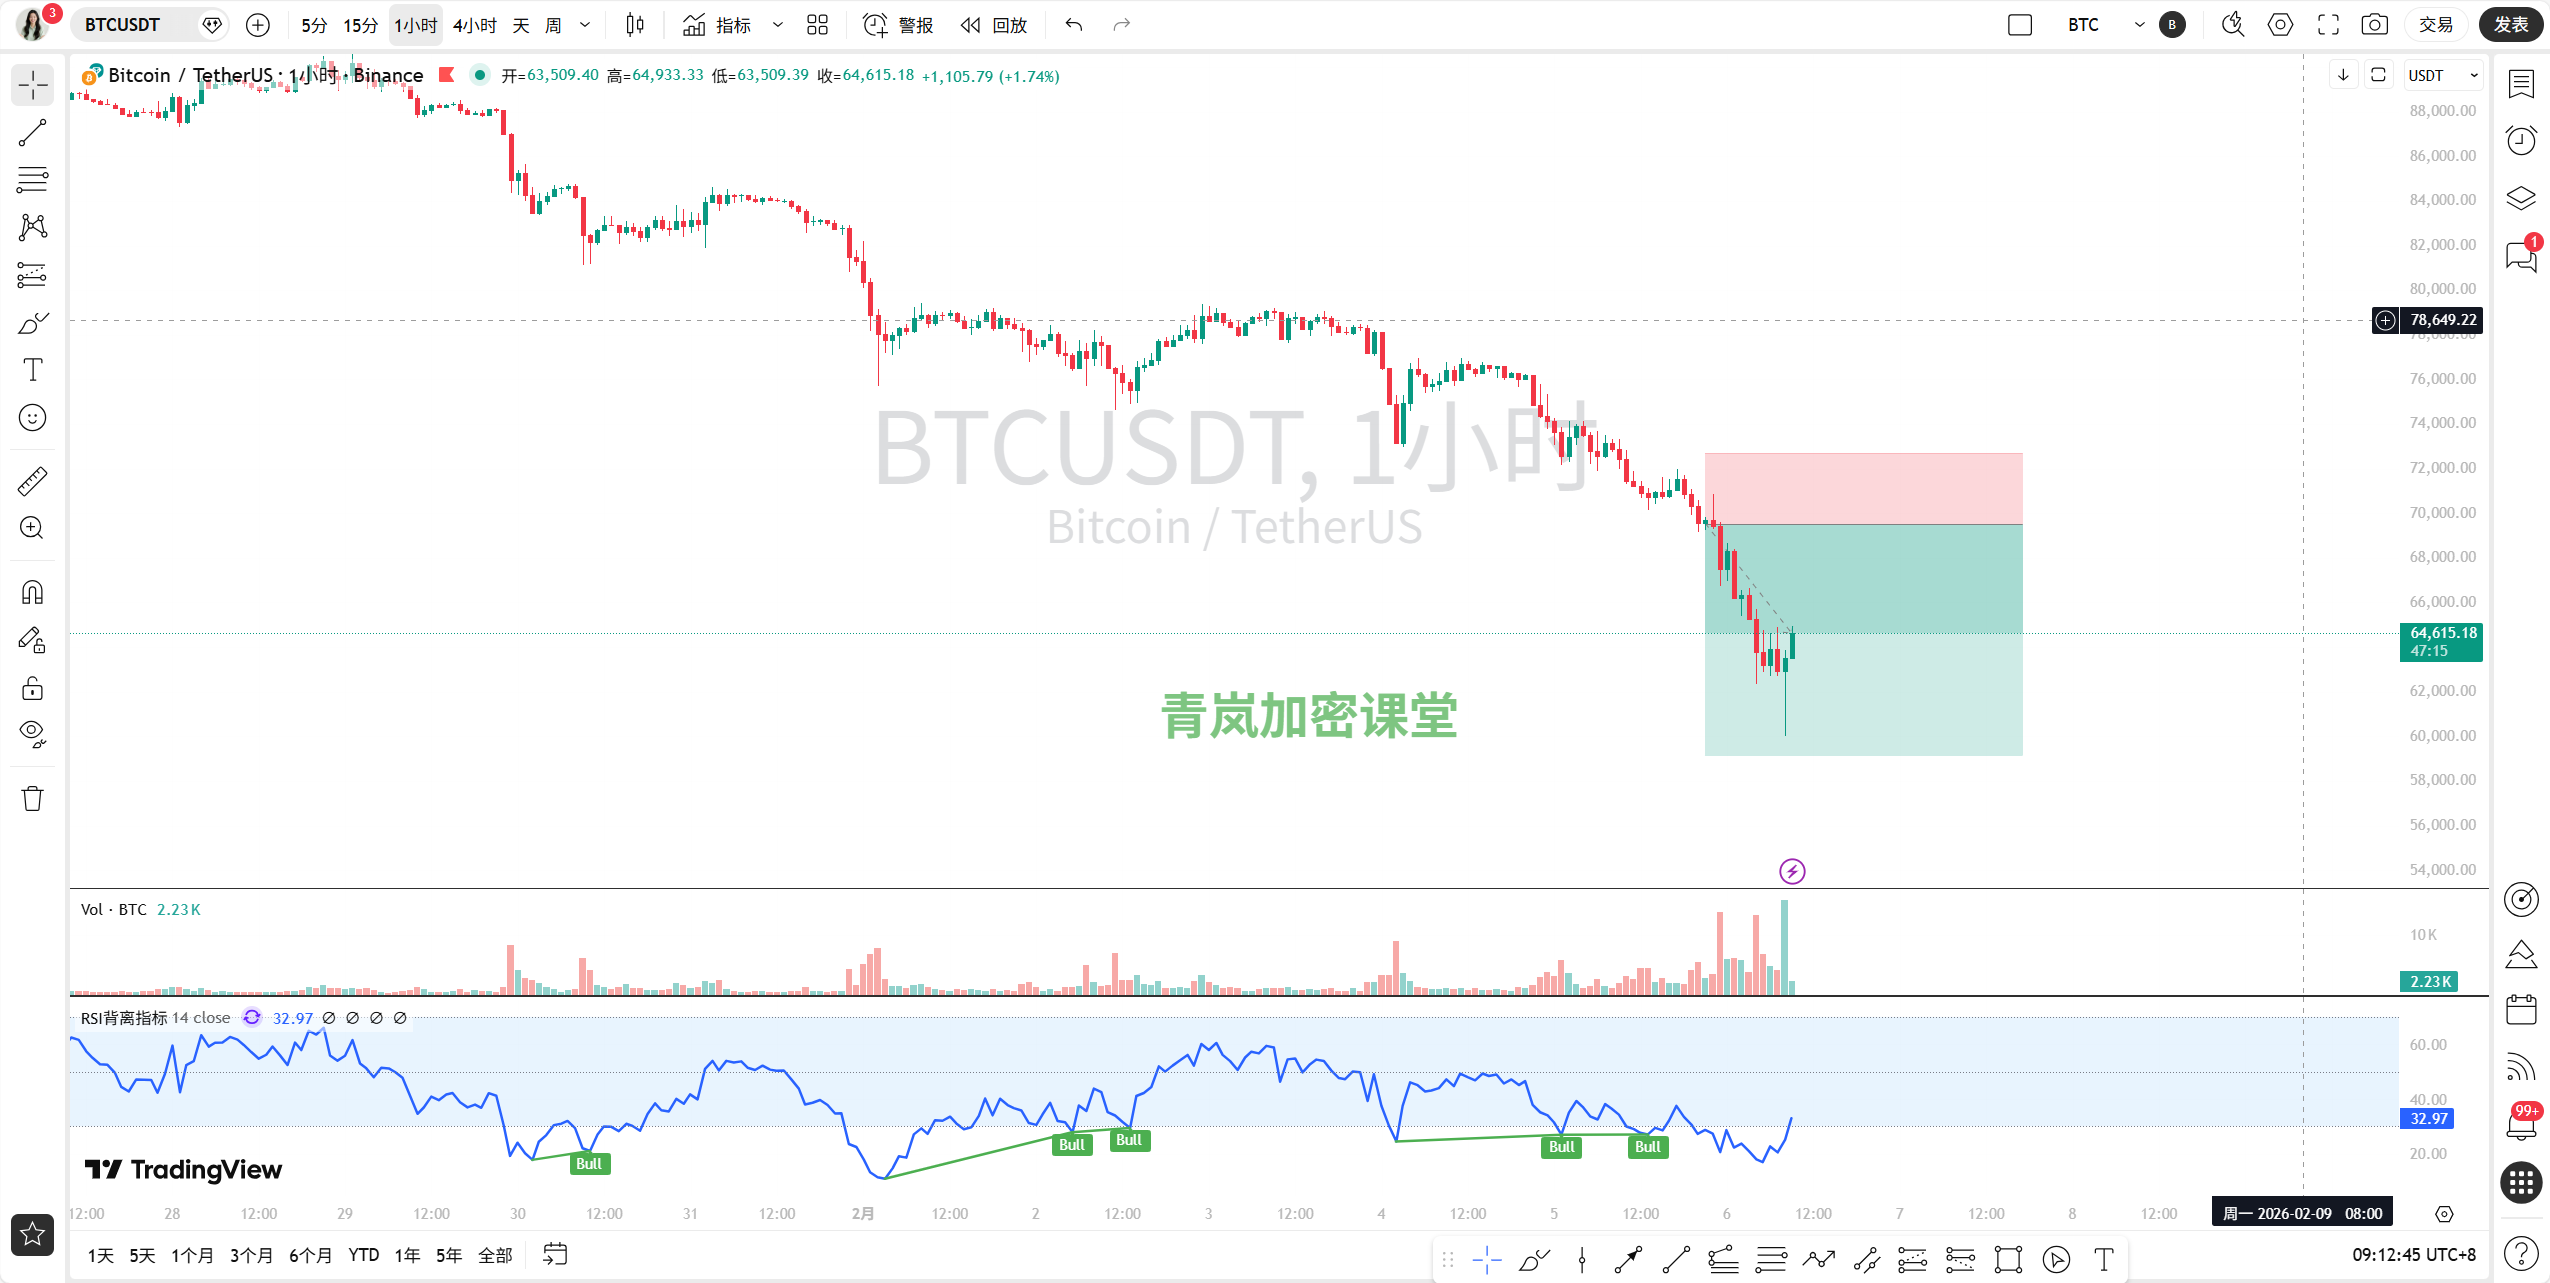
3. 1-Hour Chart (Short-Term Trend): Technical Rebound After Plunge, Clear Suppression
The short-term market has experienced a waterfall decline followed by a weak rebound, which is a technical correction after being oversold, with no change in trend:
Trend: After a waterfall decline from 71,000 to around 60,000, the price is weakly oscillating in the 61,000-63,000 range, attempting to build a consolidation platform. However, the short-term moving averages such as MA5 and MA10 are still in a downward trend, significantly suppressing the price, making it difficult for the rebound to sustain.
Indicators: The MACD green bars have slightly shortened, but the dual lines remain in deep water, with no signs of recovery; the RSI indicator has rebounded from a very low level to around 25, which is merely a technical correction and does not constitute a trend reversal signal.
Key Levels: Short-term resistance levels are 63,500 (early morning rebound high) and 64,500, with weak breakthrough potential likely leading to another drop; support levels are 61,000 and 60,000, and breaking these levels requires timely risk avoidance.
4. 15-Minute Chart (Ultra-Short Term): Severe Intraday Volatility, Rebound is a Retracement
The ultra-short term mainly reflects intraday volatility, with the rebound after the early morning flash crash being a technical retracement within the downtrend, requiring caution against "escape wave" traps:
Trend: After the price broke below 60,000 in the early morning, a V-shaped rebound occurred, currently hovering near the rebound high, with severe short-term fluctuations, but it has not changed the medium to long-term bearish pattern.
Indicators: The MACD indicator formed a golden cross below the zero line, and the RSI indicator has risen to around 46, indicating weak short-term rebound momentum that is difficult to sustain.
Key: This cycle's rebound is a technical retracement within a larger downtrend, with the core observation being whether the 63,000 key level can hold; if it cannot hold, the downtrend will continue; if it does hold, it will only be a short-term oscillation adjustment, unable to change the dominant bearish pattern.
II. News Analysis: Panic Sentiment Spreading, Divergence in Bullish and Bearish Signals
The news and technical analysis are highly resonant, with negative factors dominating market sentiment, while some contradictory signals appear, requiring objective assessment:
Concentration of Negative Factors: Over 2.1 billion USD in liquidations across the network in 24 hours, with leveraged liquidations triggering a chain reaction; Aave's founder and institutions like World Liberty Finance have seen whales selling off; mainstream mining operations are shutting down, and the Gemini platform is laying off staff and shrinking operations, leading to a collapse in market confidence and accelerating price declines.
Bullish and Bearish Divergence Signals:
Panic Indicator: USDT has a premium of 7.1, indicating some funds are looking to bottom fish or hedge, but the scale of funds is limited and cannot change the market trend;
Whale Divergence: During the ETH crash, the whale "E Guardian" increased its position by nearly 7,000 ETH against the trend, indicating that some large holders believe the current price has entered a value range, but this is individual action and does not represent market consensus;
Official Statements: The founder of MicroStrategy calls for "HODL," and Bitwise's CIO states that the current pullback is a good buying opportunity, with related statements aimed at soothing market sentiment, but with limited impact on market movements.
III. Comprehensive Forecast and Operational Strategy (For Educational Reference Only, Risk is Self-Borne)
Based on the comprehensive assessment of technical and news analysis: The current market is in a main downtrend on the daily and 4-hour charts, with rebounds on the 1-hour and 15-minute charts being technical corrections. Do not misinterpret them as trend reversals; overall, it is a "rebound market under a bearish trend," with the core logic being to look bearish in accordance with the trend.
Trend Direction Forecast
Long-Term (Daily): Downward trend, bear market structure established, no reversal signs;
Medium-Term (4-Hour): Downward trend, main downtrend continues;
Short-Term (1-Hour/15-Minute): Oscillating rebound, limited strength, essentially a continuation of the decline.
Summary of Key Levels
Upper Resistance: 63,500 (short-term) → 64,500-65,000 (strong resistance) → 68,000 (extremely strong resistance);
Lower Support: 61,000 (weak support) → 60,000 (key psychological level) → 58,000.
Operational Thoughts
Trend-Following Bearish Strategy: If the price rebounds to the 63,500-64,500 resistance range, and the 15-minute chart shows signs of stagnation (long upper shadow, RSI divergence, etc.), a light short position can be attempted; set a stop-loss above 65,000, with targets sequentially at 61,000 and 60,000, strictly controlling position size and avoiding prolonged battles.
Counter-Trend Bullish Strategy (High Risk): Participation is limited to short-term professional investors. If the price retraces to the 60,000-61,000 range and quickly recovers, a very small position can be taken to bet on a short-term rebound; set a strict stop-loss below 59,500, with a target of 63,000, taking profits quickly to avoid liquidation risks.
Optimal Strategy: Wait and See: The core principle of trend trading is "not to catch falling knives." Currently, it is necessary to manage positions, preserve capital, and wait for the 4-hour chart to show a clear bottom structure (double bottom, MACD divergence, etc.), or a significant breakthrough of the 65,000 key resistance level before reassessing whether the trend has reversed, avoiding blind bottom fishing.
Core Viewpoint: In a downward trend, all rebounds are a preparation for the continuation of the trend; in an upward trend, all pullbacks are a buildup for trend acceleration. The current market is in the former.
For more quantitative breakdowns of how real-time news affects market sentiment, updates are available in my Qinglan Crypto Class, www.qinglan.org.
Qinglan's Message: Market opportunities never cease; the core is to preserve capital during the storm and have the patience to wait for opportunities. Only by preserving capital can one seize the next market opportunity.
免责声明:本文章仅代表作者个人观点,不代表本平台的立场和观点。本文章仅供信息分享,不构成对任何人的任何投资建议。用户与作者之间的任何争议,与本平台无关。如网页中刊载的文章或图片涉及侵权,请提供相关的权利证明和身份证明发送邮件到support@aicoin.com,本平台相关工作人员将会进行核查。