Bitcoin is now down ~40% from its all-time high.
The question is whether this is the start of something structural or a correction within a broader macro regime that remains intact.
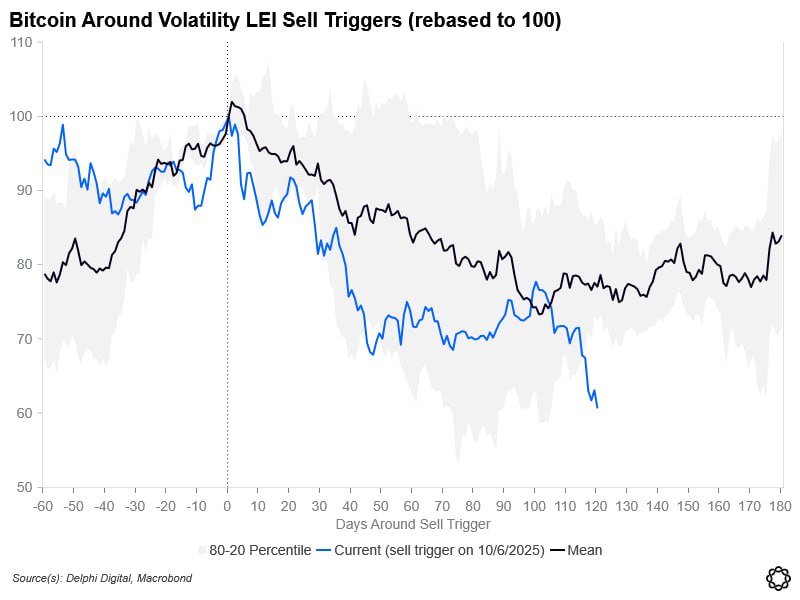
Our market strategist @scotttfreeman volatility framework offers a useful lens.
When implied volatility trades significantly below its fundamental fair value while Bitcoin sits at ATH, history suggests a drawdown follows.
But historically, the severity has largely depended on the state of Leading Economic Indicators (LEIs).
When LEIs were deteriorating (Apr-21, Nov-21), drawdowns were severe, ranging from -52% to -77%, with recovery timelines of 191 to 847 days.
When LEIs were healthy (Dec-24, Jul-25, Aug-25), drawdowns were shallow, ranging from -6% to -28%, with new highs reached within 33 to 168 days.
The current vol sell signal triggered in late October. This drawdown has now exceeded the historical range for healthy LEI periods, but remains short of the drawdowns seen when LEIs were deteriorating.
免责声明:本文章仅代表作者个人观点,不代表本平台的立场和观点。本文章仅供信息分享,不构成对任何人的任何投资建议。用户与作者之间的任何争议,与本平台无关。如网页中刊载的文章或图片涉及侵权,请提供相关的权利证明和身份证明发送邮件到support@aicoin.com,本平台相关工作人员将会进行核查。


