Yesterday's operations were overall quite good, focusing around the key integer levels of 90000 and 3000. There were two short positions taken; during the day, the shorts were timely reduced, and in the evening, another opportunity to enter was provided, with the lowest points at 87200 and 2864. In the early morning, the market was pulled back up again. This market truly rewards those who are diligent, and it serves as a reminder that one should never chase after rising prices or panic sell during declines. If last night the Nasdaq rebounded and Bitcoin reached 90000, chasing the rise would have been painful. Alternatively, if one had chased a short when it dropped to over 97000, that would have been unfortunate as well. The market is never about chasing after rises or falls; rather, after a rise, one should analyze previous trends to identify resistance areas to consider shorting, or if there is a strong breakout, to see if one can chase the rise!
Bitcoin's daily chart shows six consecutive bearish candles followed by a bullish one yesterday, closing with a candlestick that has upper and lower shadows. The price has returned above the lower band, with the middle and lower bands flattening out, while the upper band continues to open downwards. The MACD bearish momentum is still increasing, indicating that the overall direction remains bearish. On the 4-hour chart, the lower Bollinger Band is opening upwards, with the MACD bearish momentum decreasing. The KDJ and RSI indicators are turning upwards, suggesting a need for a rebound. On the hourly chart, both the middle and upper bands are opening upwards, and the MACD bullish momentum has not decreased, indicating a need for upward correction. For intraday operations, the focus remains on shorting at high levels!
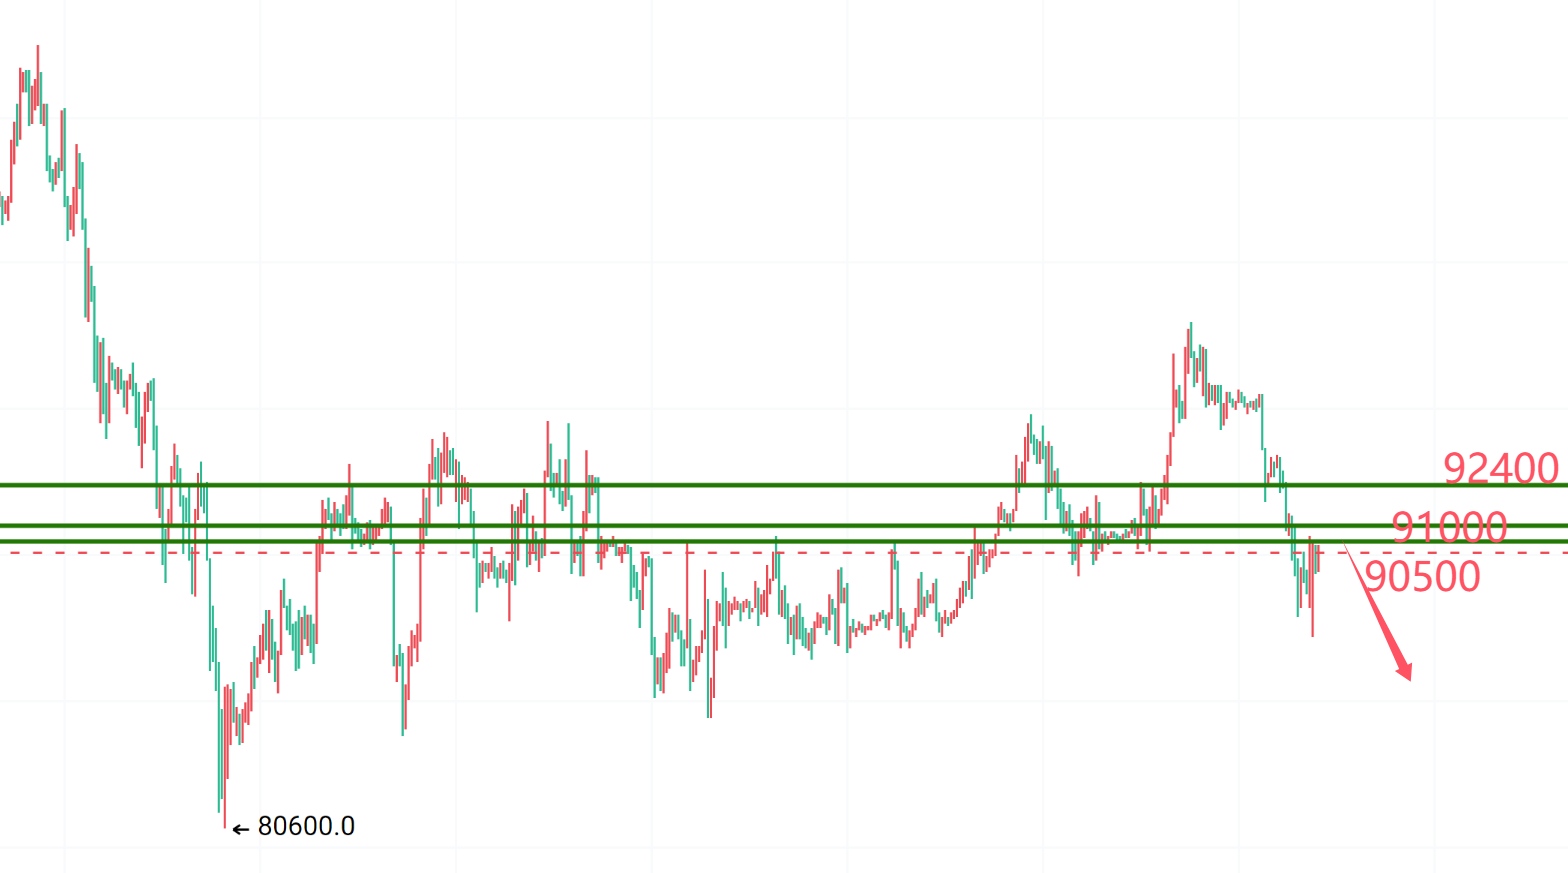
The upper resistance is around the high point of last night's rebound at 90500, followed by the upper band on the hourly chart at 91000, which also serves as resistance from the middle band on the 4-hour chart. Finally, pay attention to the middle band on the daily chart at 92400. High shorts should be positioned around these levels, with targets looking down at 89000, 88000, and 87000.
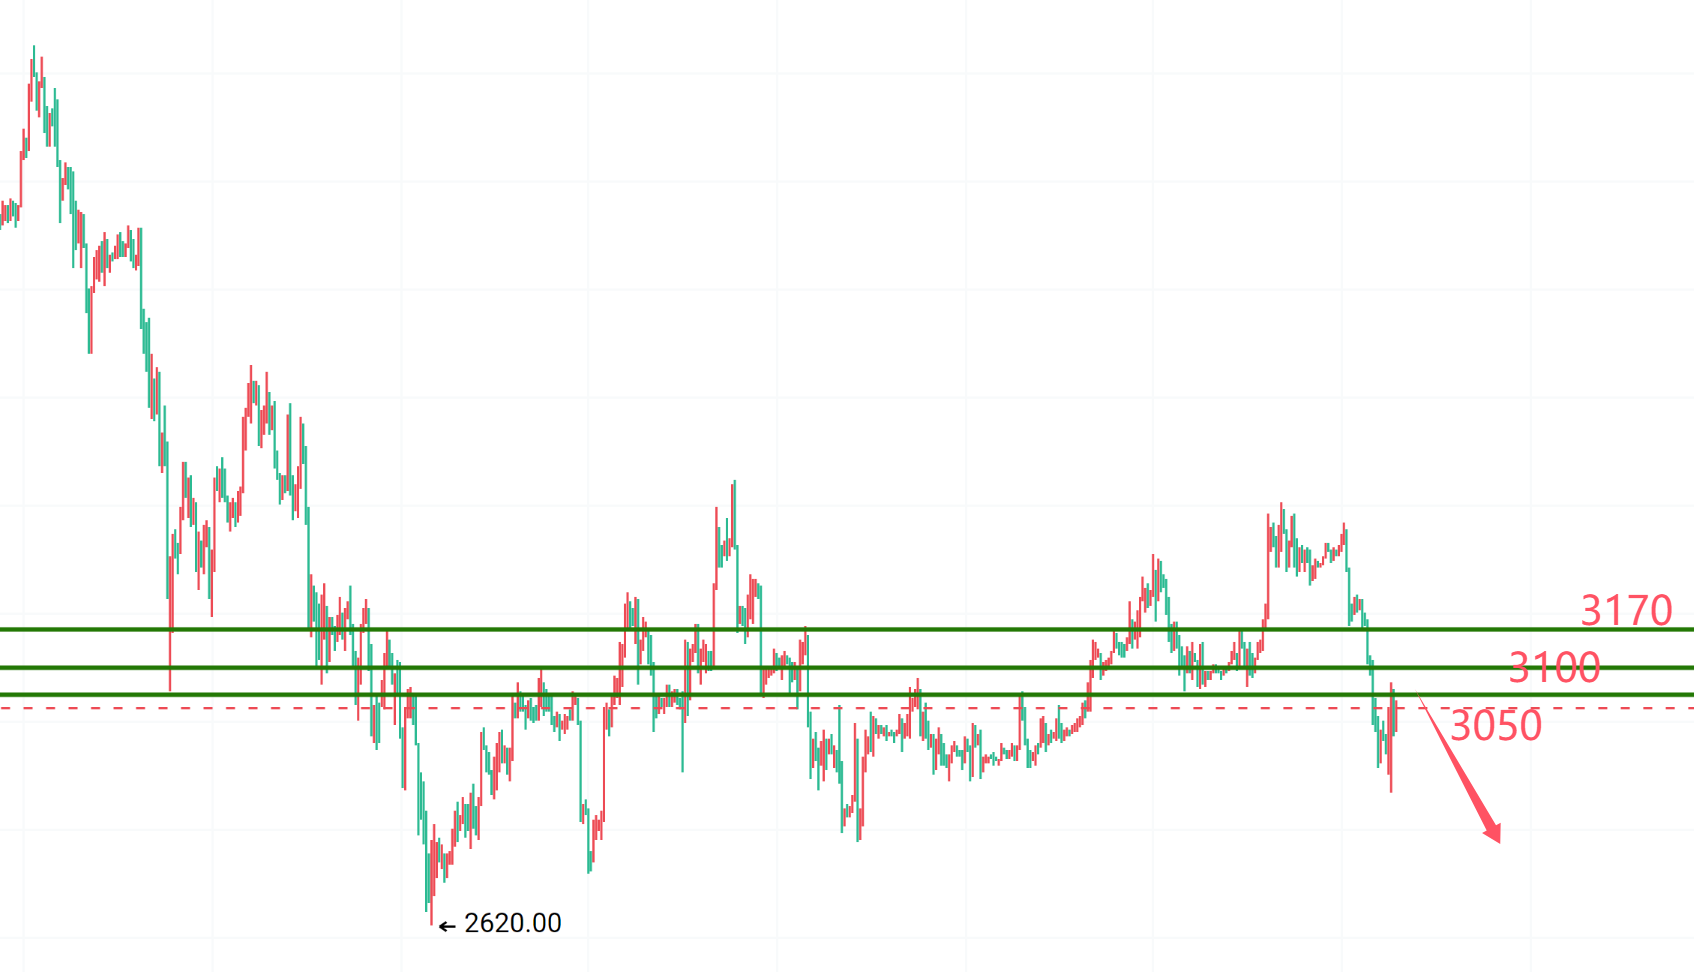
For Ethereum, the upper resistance to watch is around 3050, followed by the middle band on the 4-hour chart at 3100, and the middle band on the daily chart at 3170. High shorts should be positioned around these levels, with targets looking down at 3000, 2900, and 2800.
Real life always teaches us many lessons. In life, if you are not adequately prepared, you will face the heaviest rain; in work, if you are not adequately prepared, you will endure the harshest criticism; in family, if you are not adequately prepared, you will suffer the greatest hardships… In many cases, we may not realize this until we are faced with challenges, at which point we find ourselves in a dilemma. This may be human nature, as well as inertia…

免责声明:本文章仅代表作者个人观点,不代表本平台的立场和观点。本文章仅供信息分享,不构成对任何人的任何投资建议。用户与作者之间的任何争议,与本平台无关。如网页中刊载的文章或图片涉及侵权,请提供相关的权利证明和身份证明发送邮件到support@aicoin.com,本平台相关工作人员将会进行核查。


