How long has Bitcoin been in a sideways trend?
On Monday, there was a rise that directly broke through the consolidation range, and the price stabilized above the upper band on the four-hour chart, showing clear bullish behavior. Now that the price has broken above, the previous prediction of an upward trend aligns with the actual price movement. The bullish momentum still exists, and there is a potential U-shaped trend forming. Currently, there are not many pressure points above, indicating signs of filling the gap above.
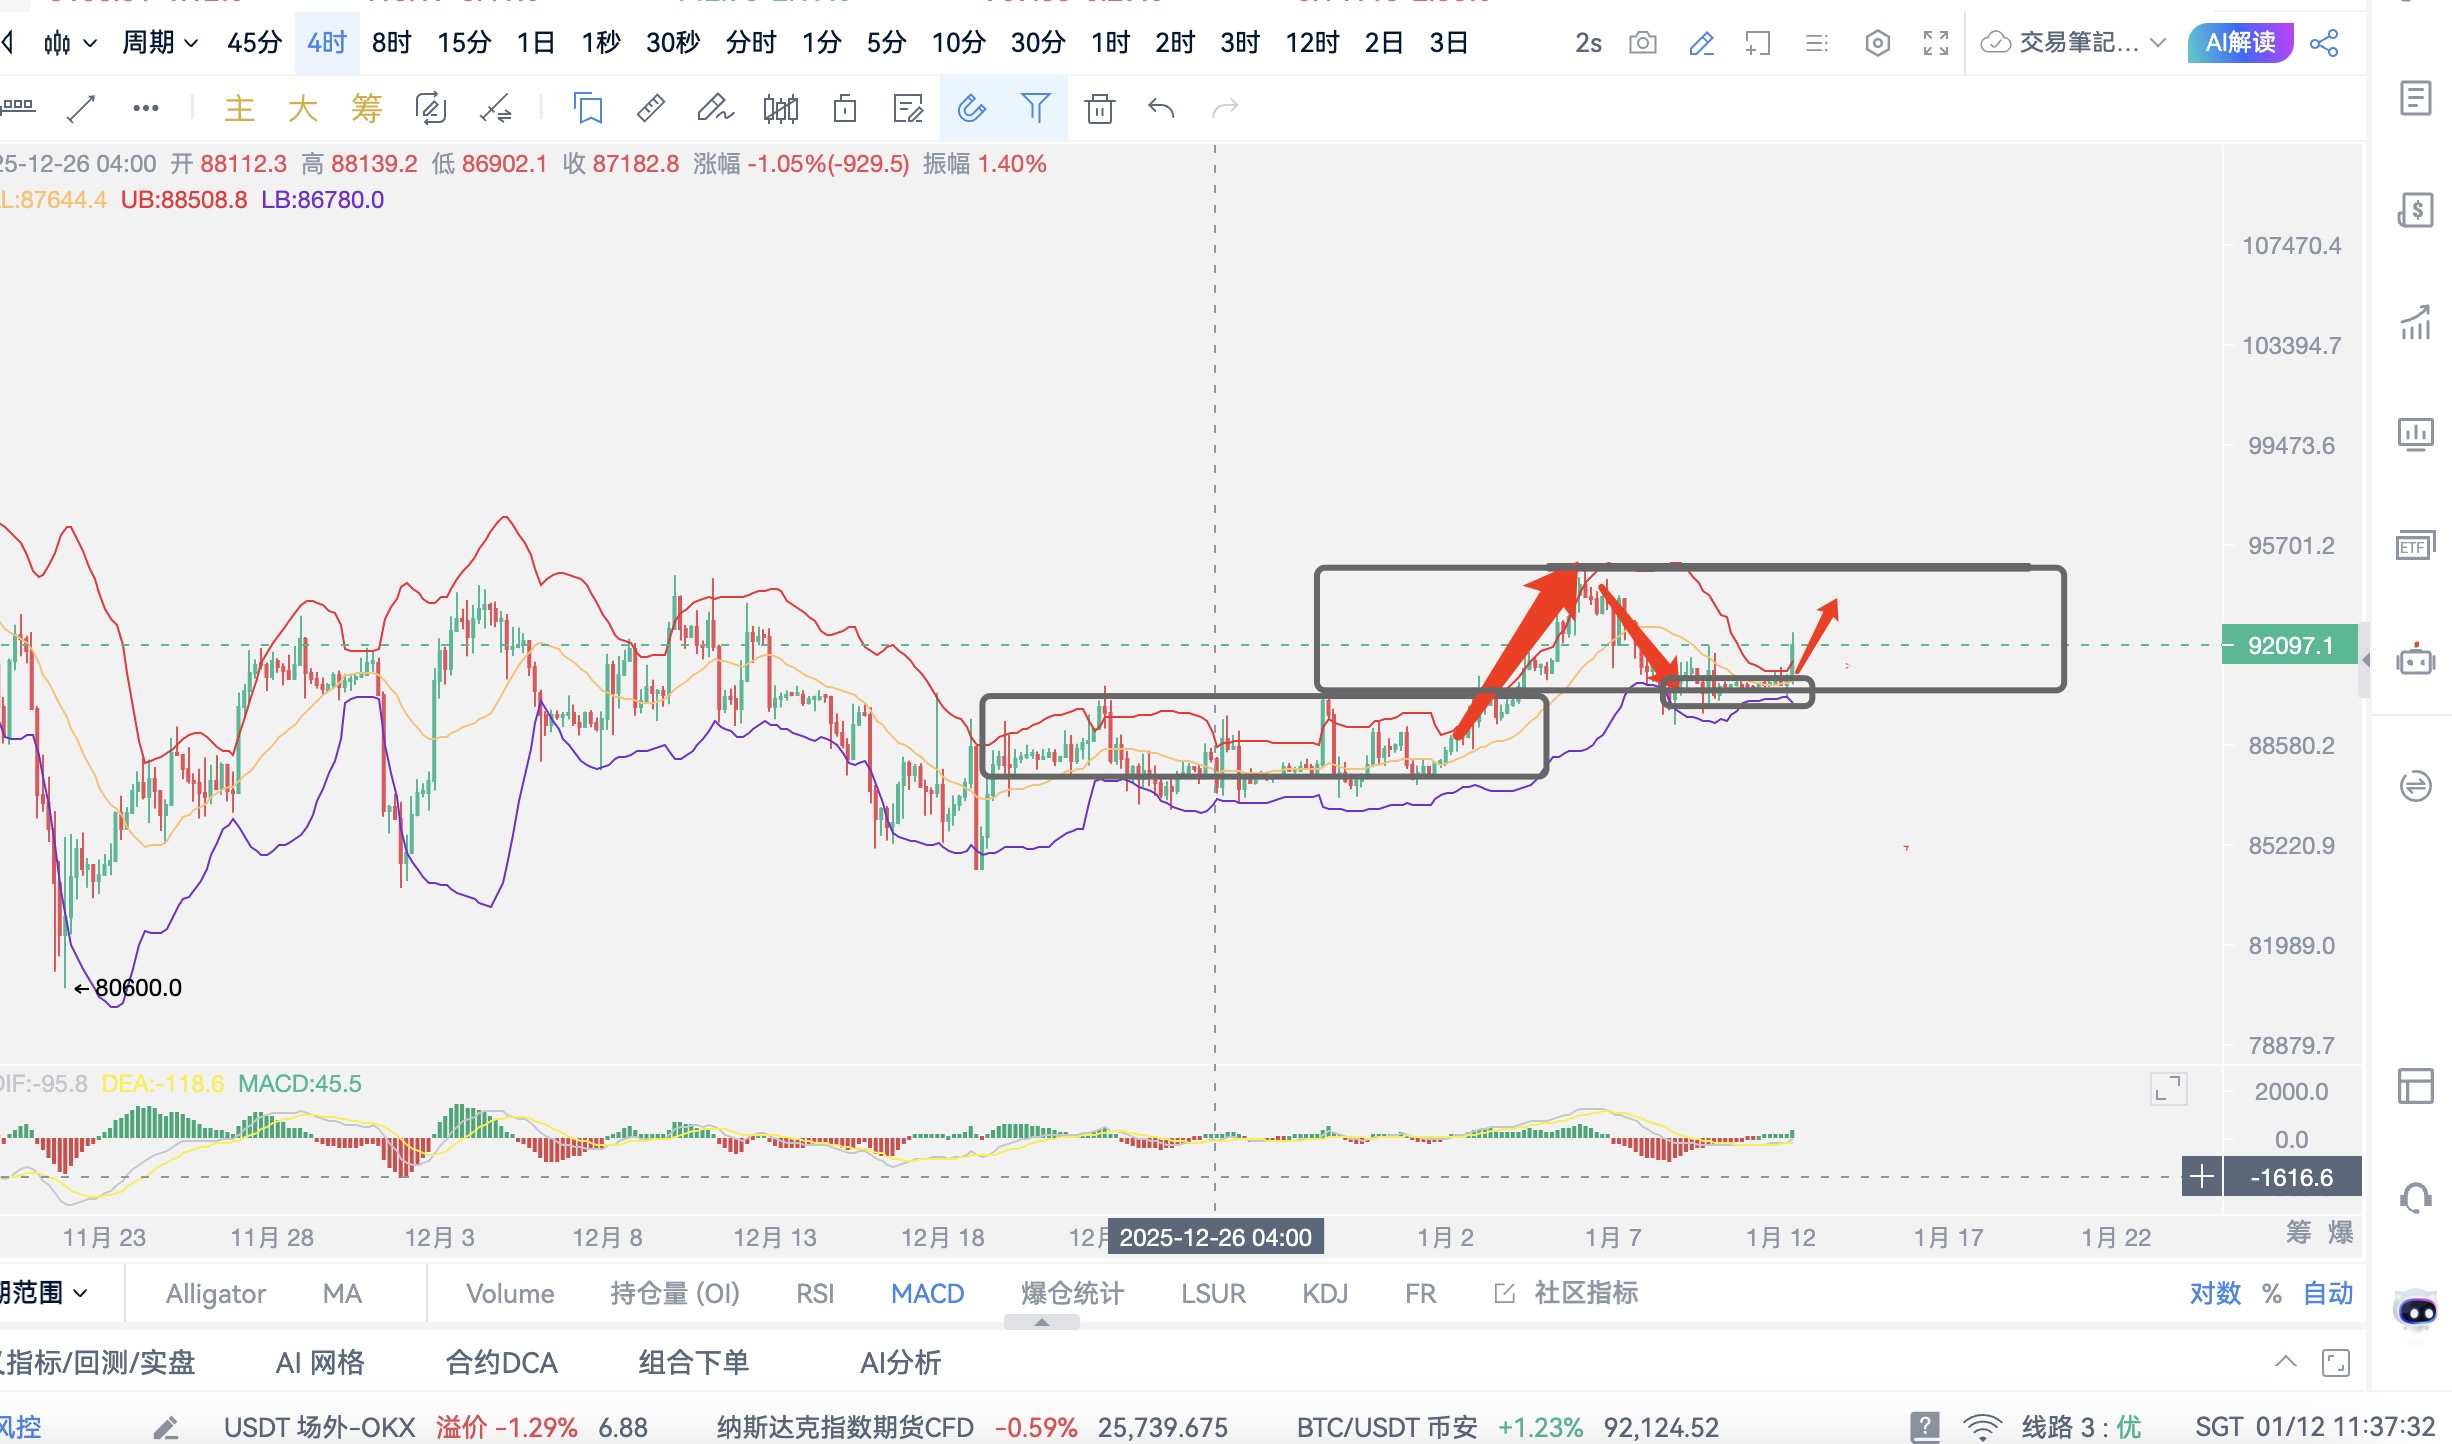
On the daily chart, the upper band is under short-term pressure. Although it is a pressure point, the bottom support level is continuously rising, and the upper space is being opened up by the candlesticks. Additionally, the MACD indicator is showing bullish momentum starting to expand. In summary, the price is expected to continue rising, and any pullbacks are seen as bullish.
Therefore, a pullback to the 92000-91800 range during the day can be viewed as bullish, with a target of 95000.
Ethereum is also expected to pull back to around 3150-3140, with a target of 3200-3240.
Follow the public account, "How to Relieve Worries, Only Jiang Wei," a treasure analysis blogger with high emotional value, offering free trading education. Bringing stability and clear guidance in the volatile trading market, with experience through three cycles of bull and bear markets and years of practical trading experience, specializing in naked K, trends, Dow theory, Gann, harmonics, Chande theory, wave theory, and other technical analyses, culminating in unique personal insights.

免责声明:本文章仅代表作者个人观点,不代表本平台的立场和观点。本文章仅供信息分享,不构成对任何人的任何投资建议。用户与作者之间的任何争议,与本平台无关。如网页中刊载的文章或图片涉及侵权,请提供相关的权利证明和身份证明发送邮件到support@aicoin.com,本平台相关工作人员将会进行核查。


