Today is January 1, 2026.
At this point in time, I would like to share some of my views on the overall market trends for this year, which can be considered a phase-based projection.
Many fans are concerned about two points:
First, how to position in the spot market;
Second, what is the overall direction for Bitcoin this year.
- In October 2025, I indicated that the major cycle might have peaked.
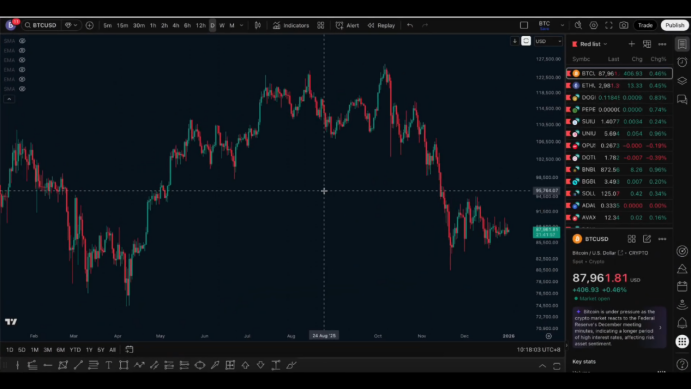
Let’s start with the weekly chart.
As early as the beginning of October 2025, specifically on October 8, I made a judgment: Bitcoin has likely peaked in the major cycle and may enter a correction period.
The most direct basis for this was price action.
In the daily structure, the price kept making higher highs, but the last high failed to break through the previous high. This kind of structure often corresponds to trend exhaustion in history.
Of course, this alone is not enough to fully confirm a peak, as wide fluctuations could also be a continuation of the upward trend. Nevertheless, I was still relatively firm in my judgment of "entering a correction period" and provided a reference range: from 70,000 to 50,000.
Looking back now, the market has basically followed the expectations I had at that time, having already experienced a drop of several thousand points, confirming that we have entered a major cycle correction, which is the bear market phase.
- Time cycles, an easily overlooked signal.
Another reason I didn’t emphasize at that time was the time cycle.
Historically, each bull market for Bitcoin has lasted between 1,000 to 1,100 days from bottom to top.
This round, counting from the very bottom, also exceeds 1,000 days by early October 2025.
When combined with the price failing to break through at the high point, the overlap from both time and structure dimensions is quite high.
Some in the market believe that Bitcoin no longer follows a four-year cycle and will enter a long-term upward structure similar to a slow bull market. However, I personally still believe that the risk attributes and volatility of the crypto market make it difficult to simply compare it to the S&P 500. Once it enters a downward cycle, the magnitude will still be significant.
- 50-week average: An important confirmation signal for the bear market.
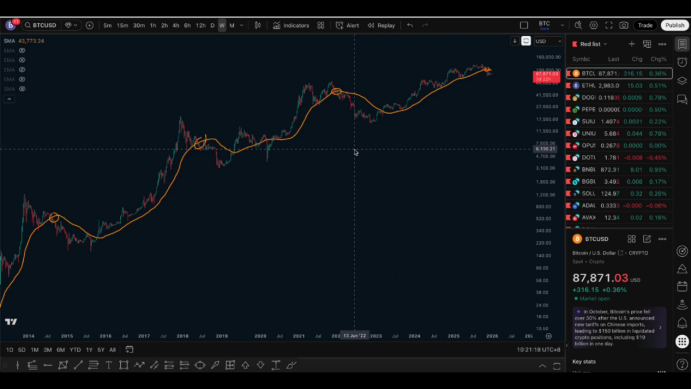
Next is a very critical reference indicator: the 50-week moving average on the weekly chart.
In the past few cycles, whenever the price effectively falls below the 50-week moving average, it has generally meant entering a bear market phase. This round is no exception.
In November 2025, the price effectively fell below the 50-week moving average. At that time, I repeatedly emphasized that this was a secondary confirmation signal for entering a correction period.
So far, this judgment has not changed; the overall structure is still operating in a bear market.
- Where will the bear market drop to? Let’s discuss the principles first.
Many people are concerned about where this bear market will drop to.
But my principle has always been clear:
Do not try to catch the bottom in advance, and do not preset a "must-buy price."
Even though I previously mentioned 70,000 to 50,000, it was only a reference range, not a guarantee that one should buy when it reaches that level.
A more rational approach is to wait for the price to finish dropping, and then look for a reversal on multiple time frames before considering spot positioning, even if it means missing the very bottom, it is still more prudent.
- An extreme scenario based on historical declines.
From historical data, in the past few bear markets, after the price fell below the 50-week moving average, it usually continued to drop by 60% to 70%.
If we simply calculate:
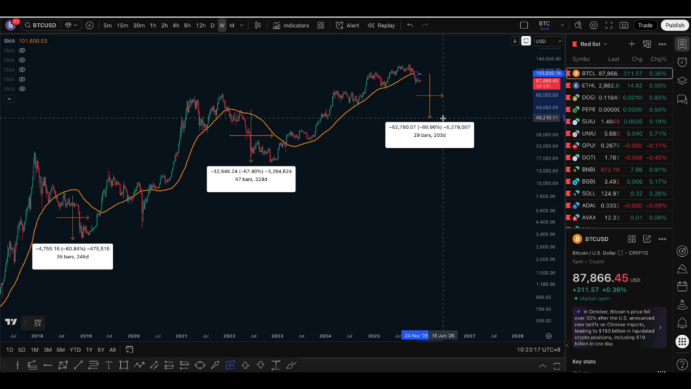
The current 50-week moving average is around 100,200. If it drops 60%, the price would roughly be around 40,000.
This is a rather extreme projection.
The probability of this round of decline completely replicating the previous round is not high, as the institutionalization of Bitcoin has clearly increased, making it different from the past.
- The spot reference range I am more concerned about.
Compared to simply looking at the decline, I pay more attention to two indicators:
The Vegas channel on the weekly chart.
The 200-week moving average on the weekly chart.
The 200-week moving average is currently around 56,000 to 57,000, and it is also close to the second line of the weekly Vegas channel.
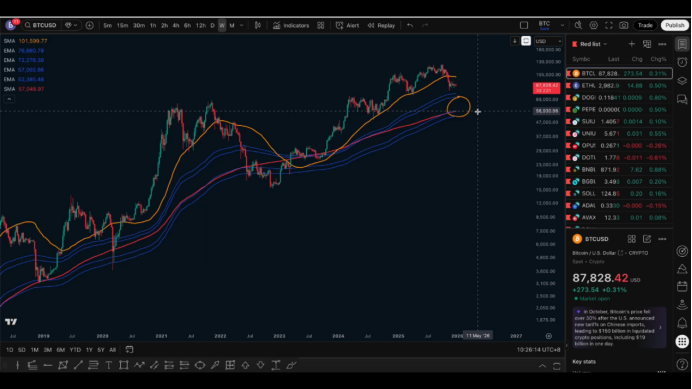
From historical experience, the 200-week moving average can generally be seen as Bitcoin's "super bottom line."
If the price reaches this area, the cost-effectiveness of spot positioning is relatively high.
Even if it briefly drops below the channel later, as long as the long-term moving average structure on the weekly chart does not completely deteriorate, spot positioning is still acceptable, but the premise is: do not use leverage.
- Looking at the bear market cycle from a time dimension.
Historically, Bitcoin bull markets usually last about 1,000 days, while bear markets mostly last around 360 days.
If the peak of this round was in early October 2025, then projecting one year forward, the time point would roughly fall around October 2026.
This means that from the third quarter to the beginning of the fourth quarter this year, it may be a phase where prices gradually approach the bottom, followed by entering a new round of upward cycle in 2027.
- Short-term view: No change for now.
Recently, the market has shifted from wide fluctuations to narrow fluctuations, which is related to the New Year holiday; historically, this period tends to have smaller volatility.
The structure is still bearish, and the direction naturally remains bearish.
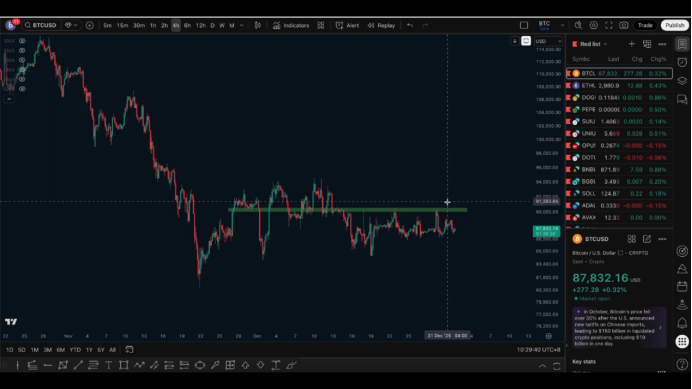
The key defensive level for Bitcoin is at 91,000, and for Ethereum, it is at 3050.
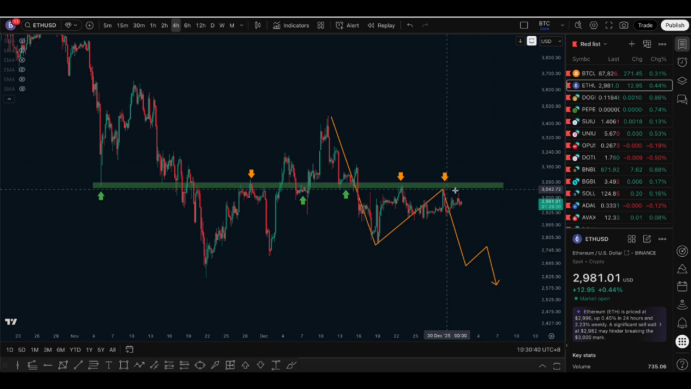
As long as these levels are not effectively broken, the overall view remains unchanged.
Follow me, join the community, and let’s progress together.

免责声明:本文章仅代表作者个人观点,不代表本平台的立场和观点。本文章仅供信息分享,不构成对任何人的任何投资建议。用户与作者之间的任何争议,与本平台无关。如网页中刊载的文章或图片涉及侵权,请提供相关的权利证明和身份证明发送邮件到support@aicoin.com,本平台相关工作人员将会进行核查。


