币圈资讯
12月29日热点;
1.白银早上期货开盘,直接继续突破历史新高,最高碰击83美金
2.WLFI:已开启使用部分财库资金加速 USD1 采用的治理投票
3.CoinWarz:比特币挖矿难度预计将在 1 月继续上调至 149 T
4.日本央行会议意见:未来需保持数月一次的稳定加息节奏
5.Hyperliquid:120 万枚 HYPE 将在解锁后于 1 月 6 日分配给团队成员
交易心得
交易心得——别侥幸!风控做得好,行情来了才抓得住在交易这条路上,谁都有运气好的时候,虽然我这几次侥幸对了,但千万别迷信任何人——包括我。交易的本质就是有对有错,既然一定会出错,那我们能做的,就是提前想好:如果错了,怎么办?答案很简单:做好风险控制。风控不是为了每次都赢,而是为了在做错的时候,不会“失血过多”。只要本金还在,等大行情真正来了,你才有能力抓住它。否则,本金亏太多,机会来了也只能干看着,白白错过。
LIFE IS LIKE
A JOURNEY ▲
下方是大白社区本周实盘群单子,恭喜跟上的币友,如果你操作不顺,可以来试试水。
数据真实,每一单都有当时发出的截图。
搜索公众号:大白论币
B站油管账号:大权777
BTC
分析
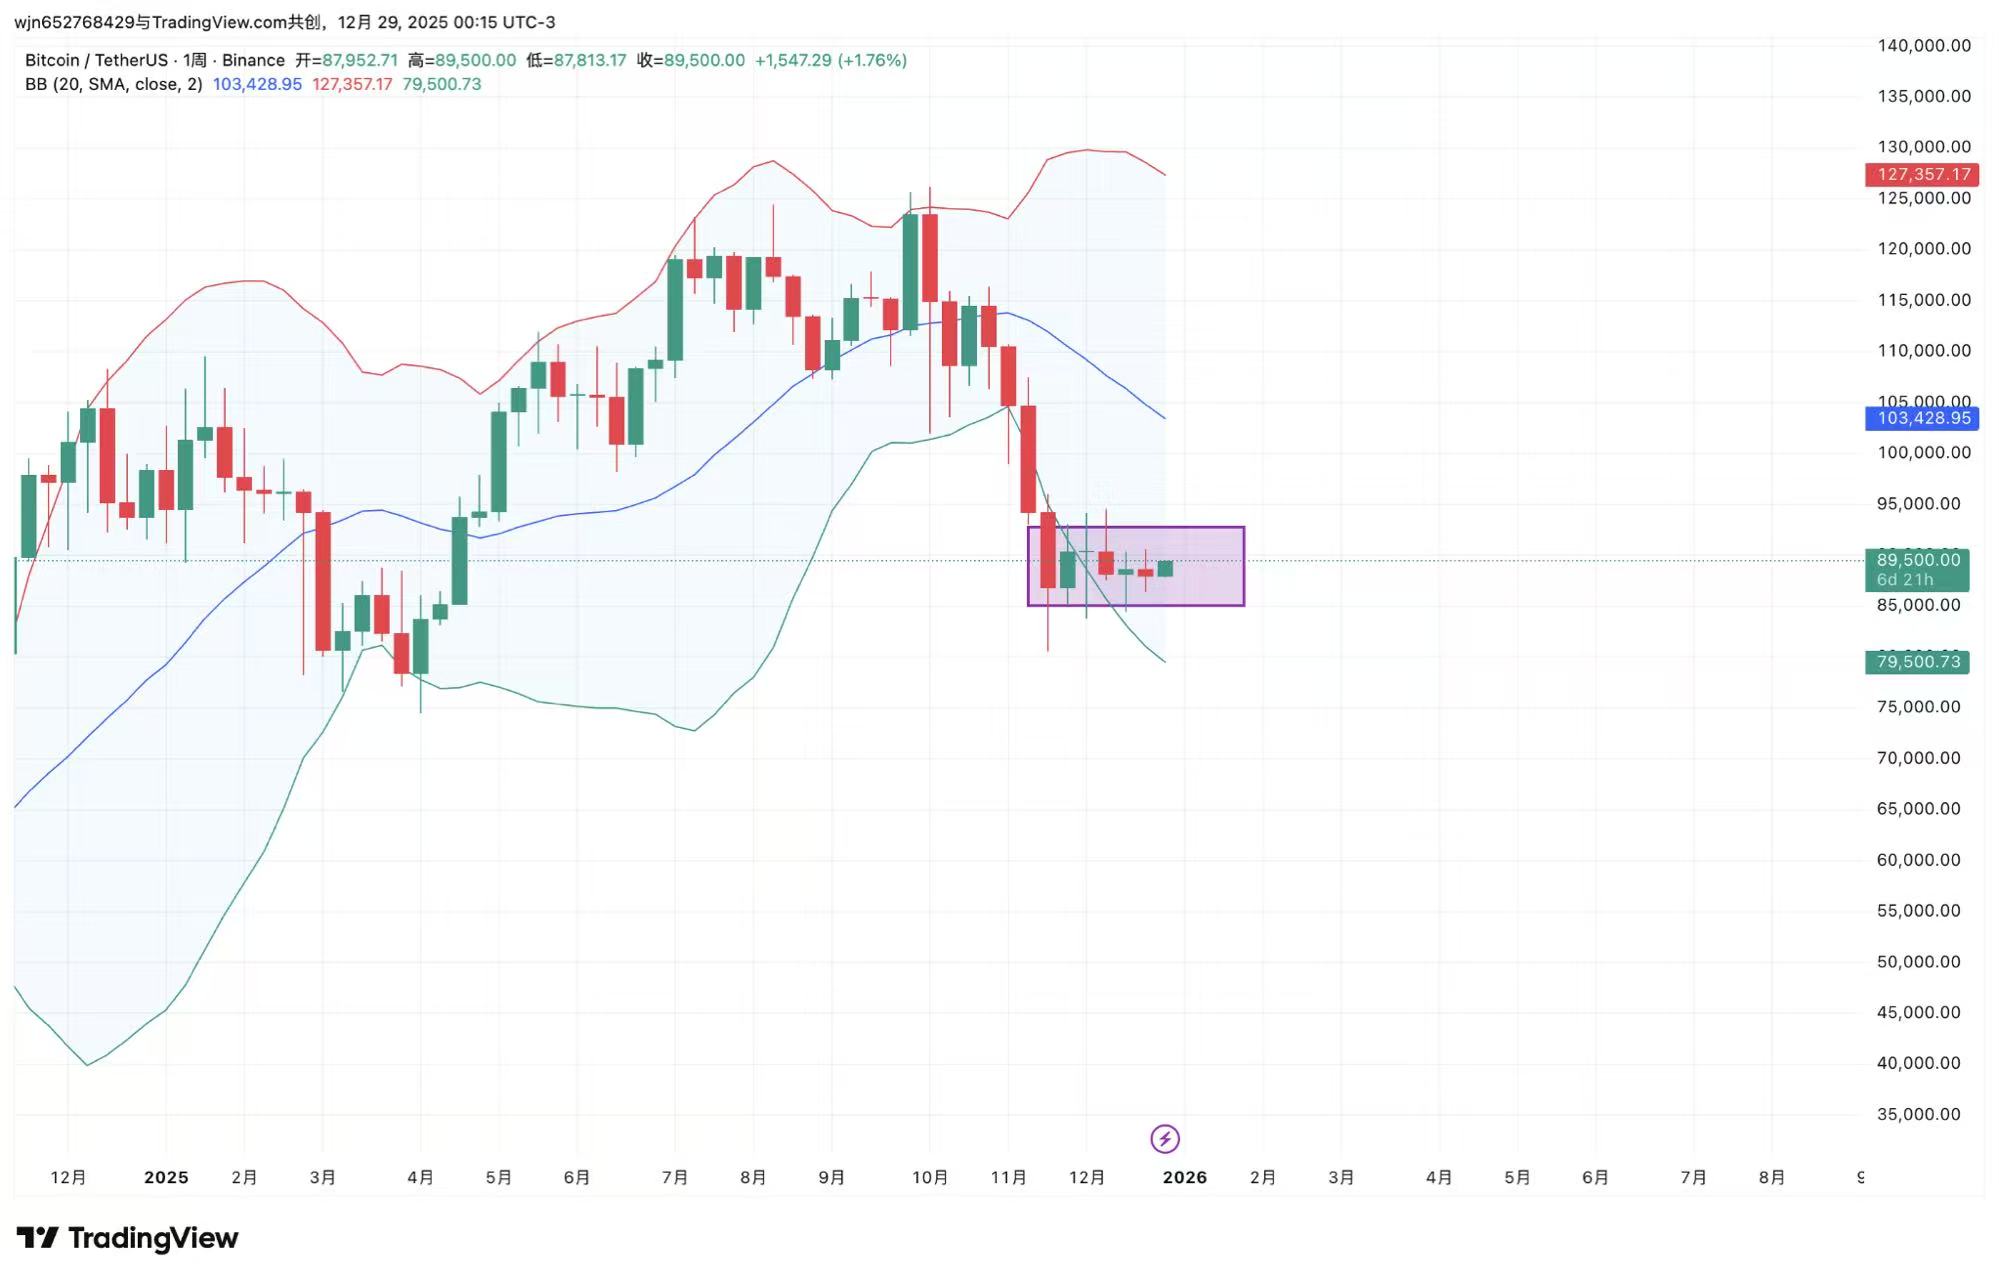
大饼月线级别:价格即将收月线,K线方面本月为震荡月,整体涨跌幅度不大,且价格在布林中轨的上升通道上支撑有效,未跌破也未强反弹,大行情还需关注本月收线后下个月的走势
周线级别:价格已经连续7周在布林的喇叭口形态内进行横盘震荡,上周继续收十字星,整体波动幅度较小,且无明确趋势方向
由于当前仍然属于顶部形成后的下跌趋势,且当前价格为横盘震荡形态,属于下跌中继,在日线级别有机会短期上涨,但是周线级别趋势仍然为震荡结束后的看跌行情
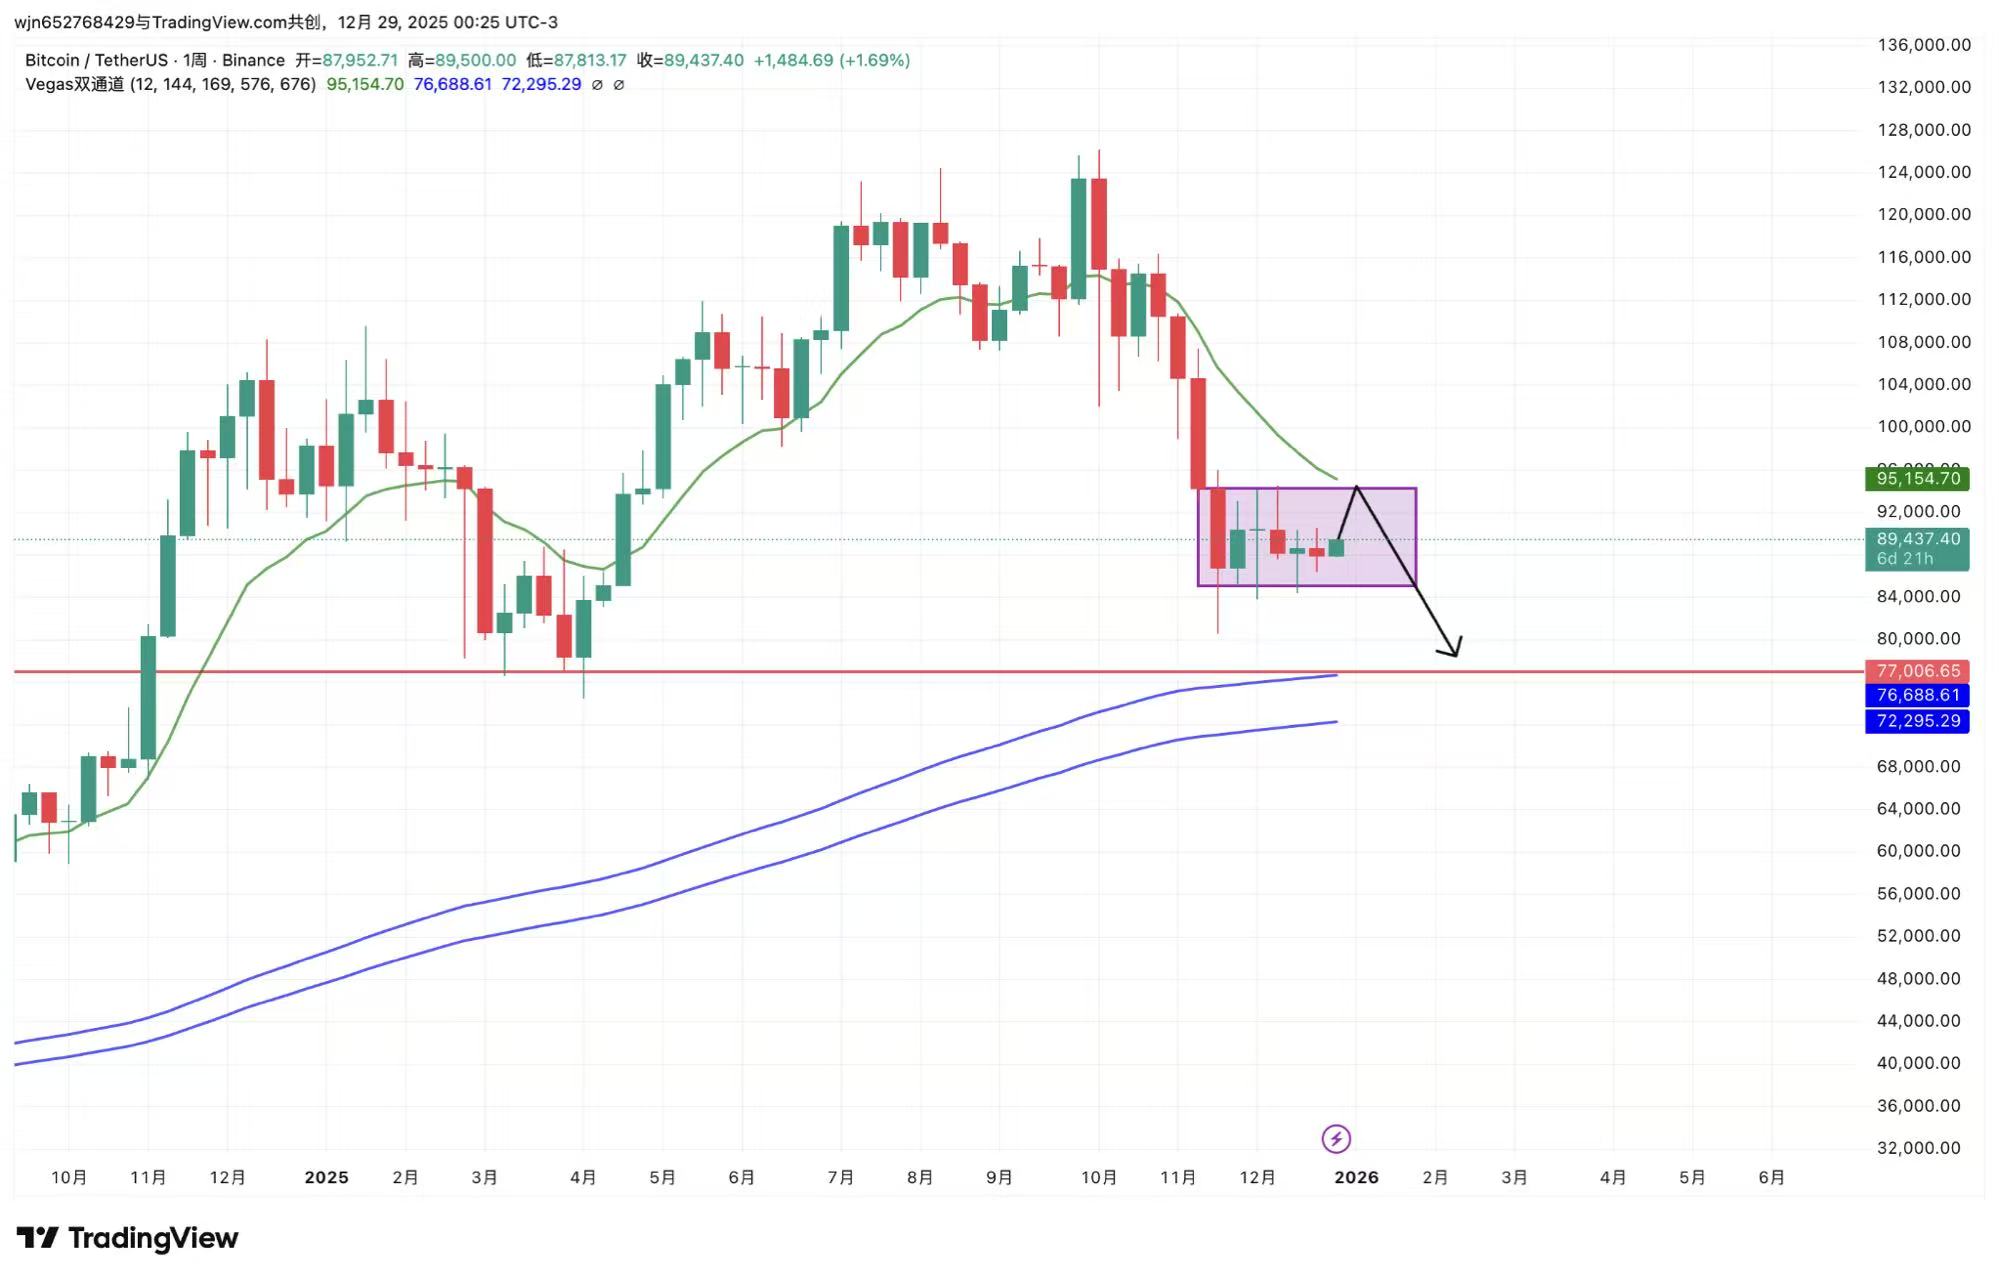
支撑方面,下方周线维加斯提供了下一个关键支撑位:77000
日线级别:价格当前在向上反弹,能反弹到哪?
当前有两大关键阻力位:第一重是99000附近(最多看到99000),这里是中长期行情出现强反弹的预测最高点(顶部颈线位阻力+日线维加斯阻力)
第二重阻力为当前震荡结构高点的阻力94000附近,由于周线是来回震荡,所以价格到达此位置可开空
日内阻力91800:当前日线整理结构方面,低点不断抬高,高点不断降低,且逐步收敛,价格与收敛三角整理相似,所以当前价格在向上确认次高点,而布林方面价格一直围绕布林上下轨震荡,上轨高点+三角上边线高点会形成日内阻力
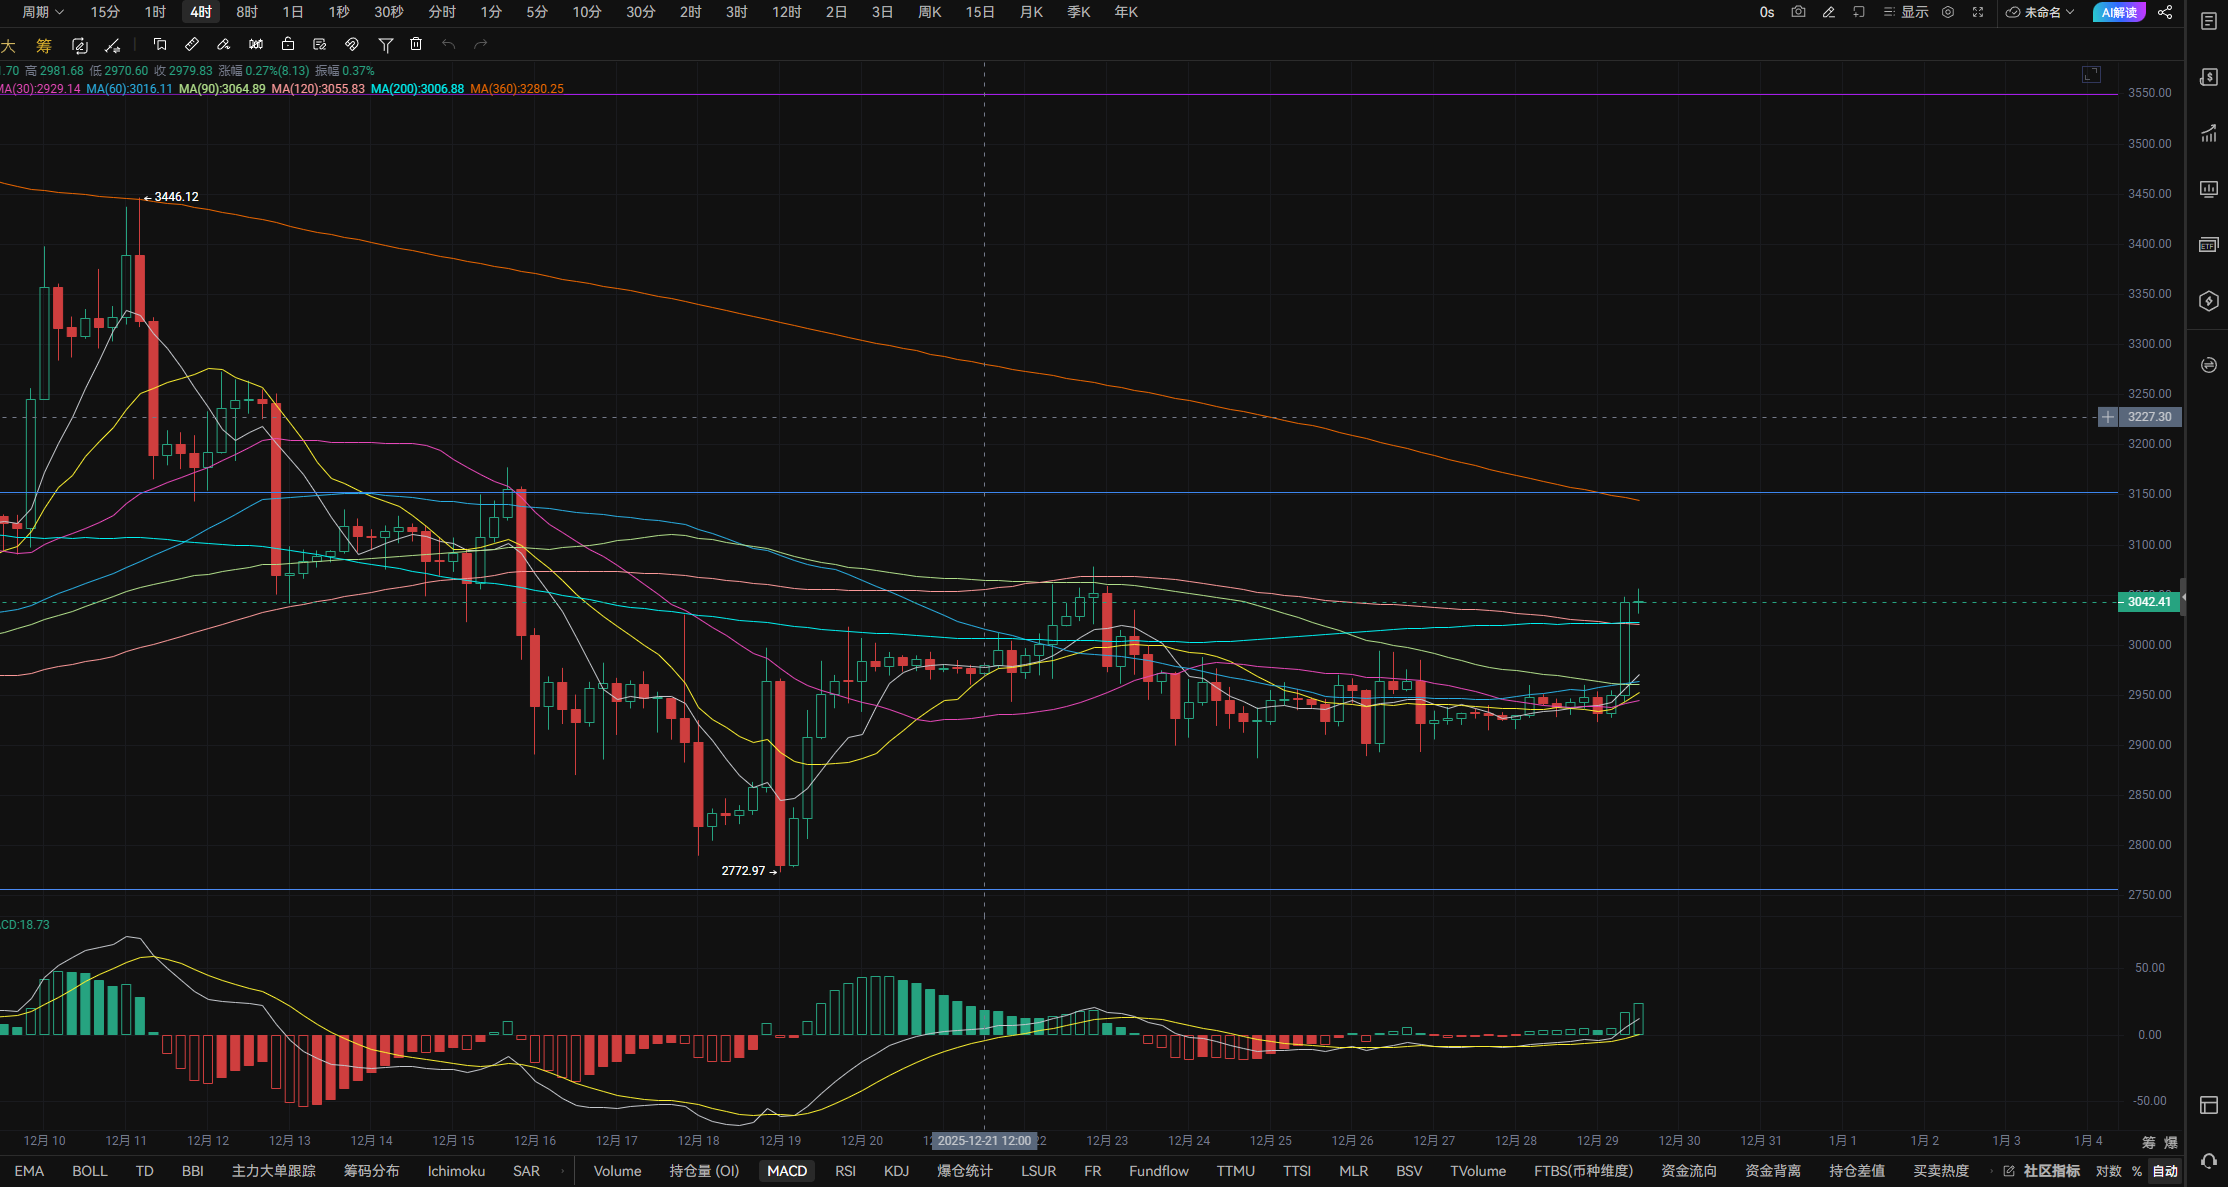
4小时级别:价格一直受维加斯压制,当前价格方面在经过了周六末的震荡后,冲破维加斯阻力,若12点4小时k线形态收在维加斯上方,即可在日内阻力和第一重关键阻力区域:91800-94000附近布局空单
当前价格到达阻力区域,仍然看小级别的震荡下跌,随后在震荡区域内逐步收敛等待月线收线,收线完成后下月初看跌破下跌中继结构,到达77000支撑区域
副指标方面,伴随着价格到达指定阻力区域,RSI将到达超买区域,KDJ已经到达超买区,副指标偏空
ETH
分析
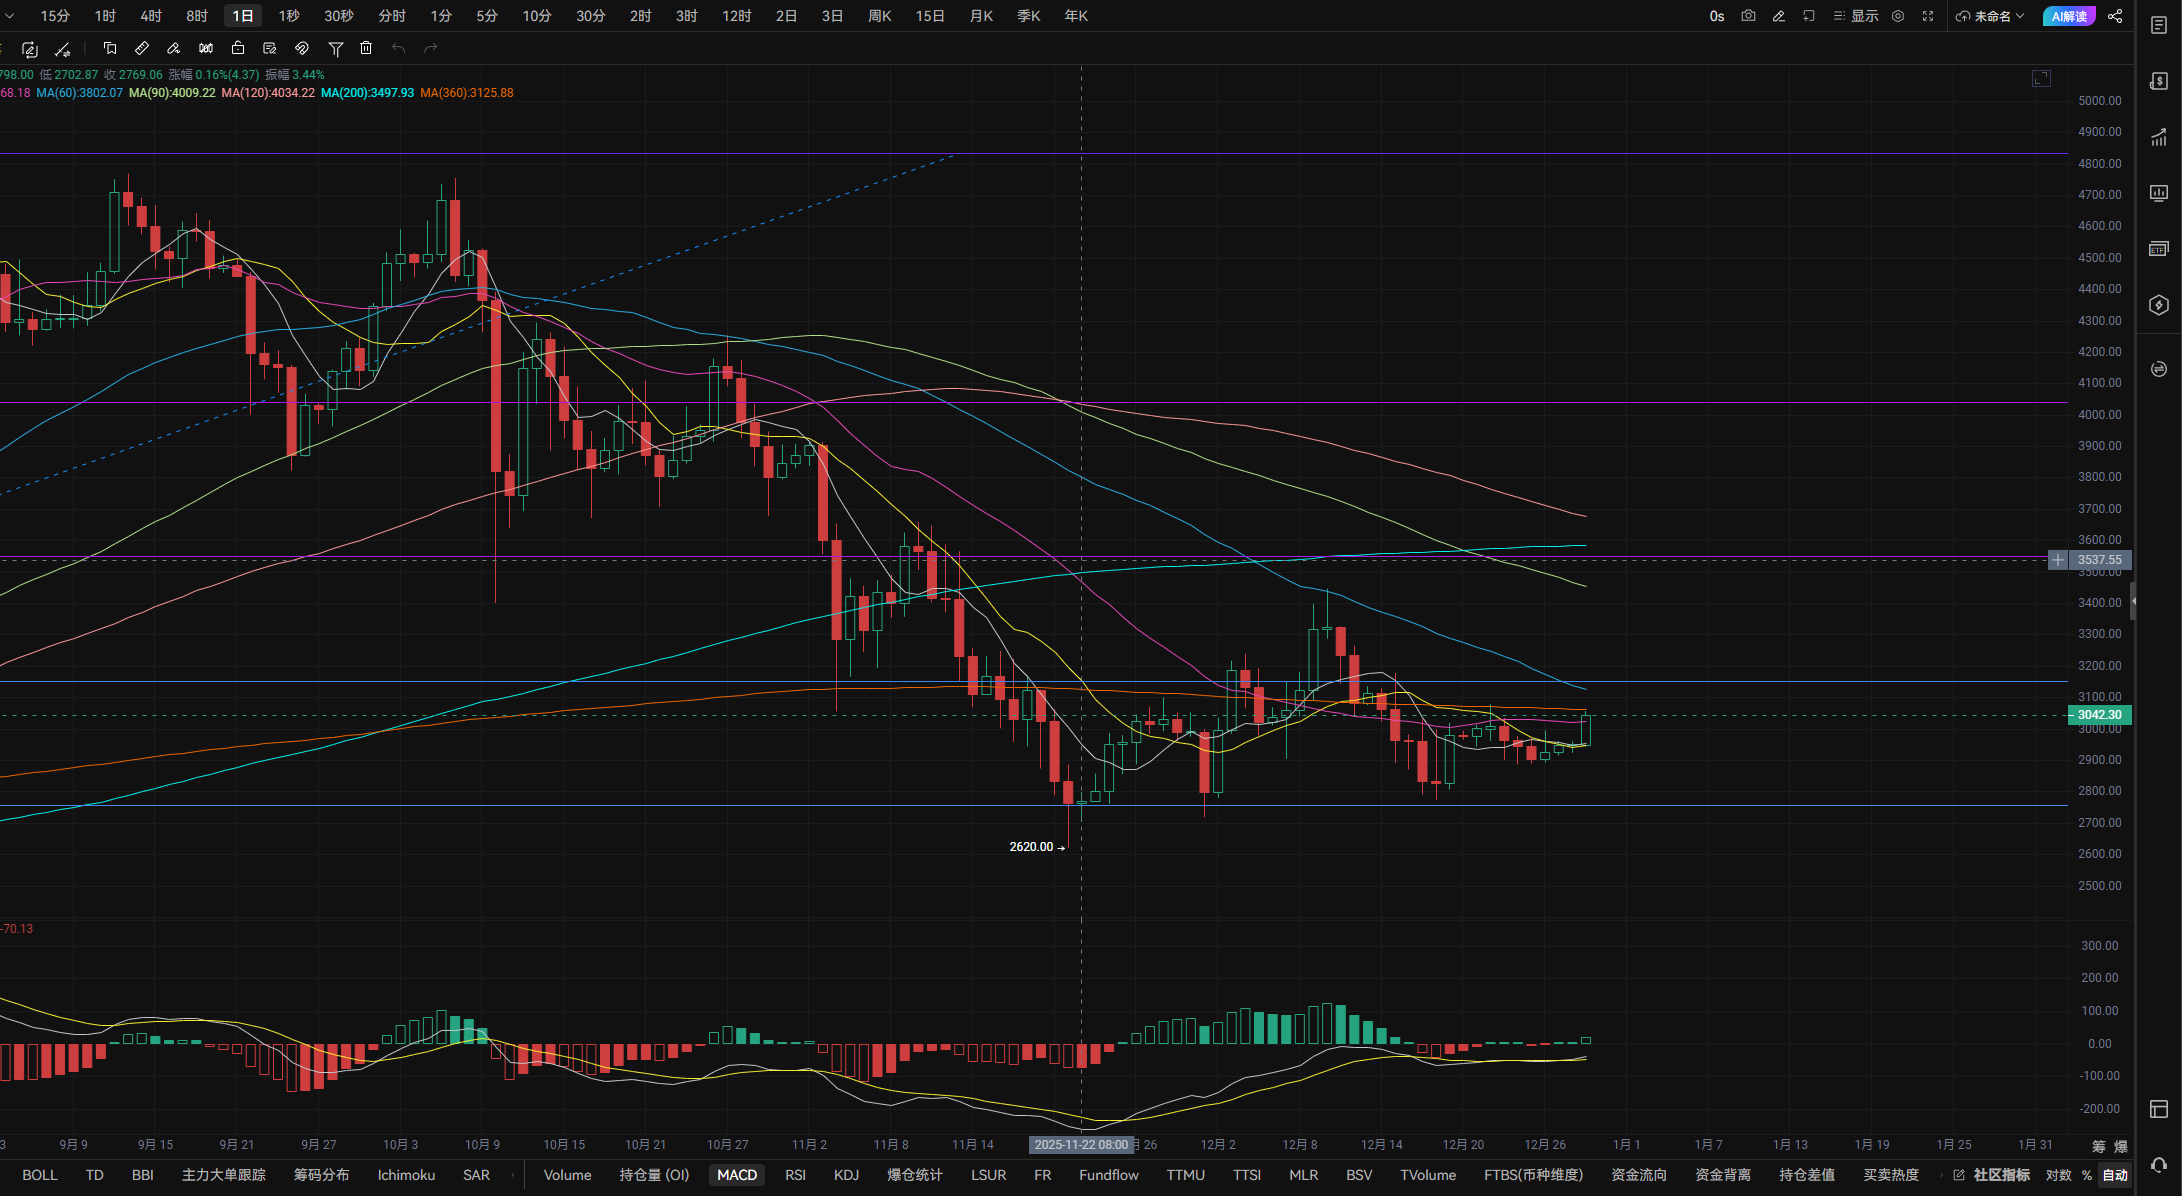
周日和预期的一样,没有太大的变动。Bitcoin维持小幅波动的趋势已经是不错了,接下来的一周成交量和流动性仍然不会太好,下周也没有什么重要的数据,如果不出幺蛾子2025年大概率就会这么过去了,希望2026年的预期能准确一些。
在2026年前不知道川普会不会宣布美联储主席的继任人选,虽然短期对市场的影响可能不会太大,但起码能让投资者有个念想,但最大的问题还在于川普能不能通过这位主席以及美联储的席位来掌控货币政策。如果不能,谁上位都没用。下方回踩3006-2996附近可进行接多。
免责声明:以上内容均为个人观点,仅供参考!不构成具体操作建议,也不负法律责任。市场行情瞬息万变,文章具有一定滞后性,如果有什么不懂的地方,欢迎咨询
免责声明:本文章仅代表作者个人观点,不代表本平台的立场和观点。本文章仅供信息分享,不构成对任何人的任何投资建议。用户与作者之间的任何争议,与本平台无关。如网页中刊载的文章或图片涉及侵权,请提供相关的权利证明和身份证明发送邮件到support@aicoin.com,本平台相关工作人员将会进行核查。


