Master Discusses Hot Topics:
Following last week's interest rate hike in Japan, the US stock market and the cryptocurrency market saw a rebound. This is not surprising; it would be strange if there was no rebound after bad news.
However, the problem is that some people start dreaming as soon as they see a rebound, as if the bear market has ended and Bitcoin is about to return to 100K and set new highs… Let's first discuss the existing reality: the expectation for the Federal Reserve to cut interest rates in January next year is only 24.8%, less than 30%, which does not constitute easing.
The high interest rate environment has not changed, and liquidity has not fundamentally improved. The interest rate hike in Japan is just the first domino to fall, with more lined up behind it. Not to mention that the effects of Japan's interest rate hike are never felt immediately; what really gets under your skin is often that painful needle that comes about a week later.
Wasn't it the same on January 23? There was a rebound that day, and a week later, it delivered a piercing long needle. Now these people are selectively blind, only seeing the rebound and ignoring history.
Back to the market, I have already seen some people daring to shout that Bitcoin will hit 100K this week. The upper band of the Bollinger Bands on the daily chart is around 93K, and the technical analysis has clearly set the ceiling; insisting that it can be pulled straight to 100K is unrealistic.
At this stage, there is a huge divergence between bulls and bears. The essence is not that a trend is coming, but that emotions are pulling in different directions, making everyone uncomfortable. In the coming days, there will be information such as the Japanese meeting minutes, comments from Trump, and CPI data, any of which could be used to hammer the market.
As for this week's Christmas rally, don't expect too much; declining trading volume and liquidity mean that the market is more easily manipulated. If the market still cannot move under the so-called seasonal benefits, emotional vacuum, and gradually recovering liquidity, then there is only one explanation: high interest rates have pressed the American economy down to the ground.
On the weekly chart, the price has tested above 80K four times, showing some support, but don't think this is a solid bottom. Even if it rebounds to 100K, it will still likely drop below 80.6K and wander around in the 70s.
This round from 15K to 126.2K has completely ended; we are now in a rebound phase within a downtrend. On the daily chart, 84.4K can be considered the starting point for a rebound if it holds, while 89.5K is a hard resistance; whether it can break through depends entirely on the main players. Even if it breaks, 94K is also a wall, not the endpoint.
Currently, the weekly chart resembles the sideways movement at the beginning of 2022, with three lower shadows indicating that buyers are still present. However, the MACD's low-level golden cross only indicates reduced selling pressure, not a return of the bull market. History has played out once already, rebounding to the Fibonacci 0.618 level before a sharp drop.
Following this script, this wave of fluctuations is likely to drag on until mid to late January next year, with the rebound peak probably around 98K. If it really reaches that position, not aggressively shorting Bitcoin would be disrespectful to my wallet.
As for Ethereum, it has been manipulated too obviously recently. I still see 3000 as a critical level; if it holds, it could go to 3160, but if it doesn't hold, it will slide directly into the vacuum below 2940, with basically no one buying before 2775.
A positive December close is not strong; it is preparing for further declines in January. Four months of consecutive declines have indeed provided some room for a rebound in February, but the premise is to first clean up the bubbles. If it doesn't break 2600, there won't be any decent rebound.
Master Looks at Trends:
The current market situation is simply that it has fallen enough to start trying to climb up, but it is still far from a true reversal. From a technical perspective, the 20-day moving average has completed a breakthrough of the long-term moving average; whether the golden cross can hold is the key observation point in the coming days.
If this golden cross fails, then all current rebound expectations will turn into a joke. The price consolidating over the weekend is not necessarily a bad thing; consolidating to digest floating positions is much healthier than being pushed up hard only to be slammed back down.
The ideal market movement now is a stair-step pattern, gradually moving up, rather than a single bullish candle that tricks bulls in only to bury them collectively.
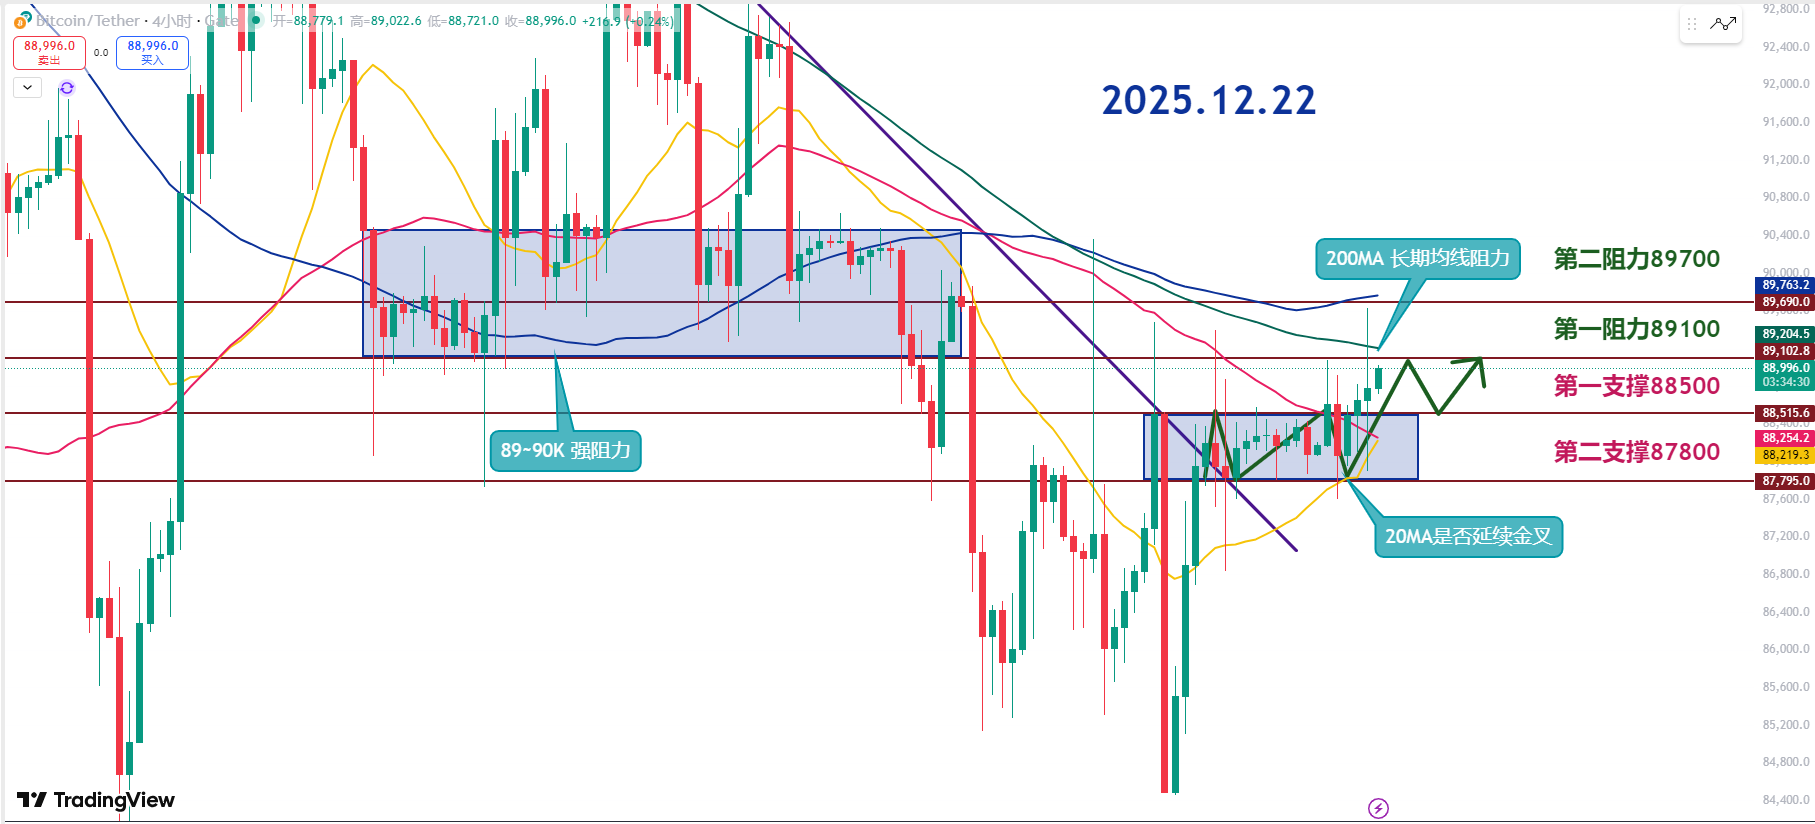
The position at 88.5K is very critical; this is the breakout point of the previous high, and it has now changed from being unable to rise to a point where it is hard to drop back down. In the short term, it can be seen as the first line of defense.
The entire range from 87.8K to 88.5K is currently the most critical support area with dense trading volume; as long as this area is not directly broken, the rebound structure can still be temporarily extended.
However, looking upwards is not optimistic; the range from 89K to 90K is the most troublesome area for trapped positions. Moreover, it coincides with the 200-day moving average, making it a position where bulls will lose a layer of skin with each attempt. This area will definitely be tested repeatedly and will not be passed through in one go.
But let me be clear: once this hard nut can be chewed down, market sentiment will immediately turn, and the probability of a short-term violent rally will significantly increase.
On the indicators, the RSI is currently around 57, having fallen back to around 50. If the indicators cool down while the price stabilizes, that would actually be a good thing, indicating that it is not being pushed up by emotions but that there are real buyers below.
In terms of operations, the short-term rebound strategy can continue to be maintained, focusing on the range of 87.7K to 88.5K. Don't go all in at once; take it in batches. In this market, those who are anxious are the easiest to be harvested.
At the same time, I must remind you that the current volatility is still significant, and there could be an unreasonable drop at any time; do not treat defense and position risk as mere formalities.
12.22 Master’s Band Strategy:
Long Entry Reference: Buy in the range of 87800-88500; Target: 89100-89700
Short Entry Reference: Not applicable for now
If you truly want to learn something from a blogger, you need to keep following them, rather than making hasty conclusions after just a few market observations. This market is filled with performers; today they screenshot their long positions, and tomorrow they summarize their short positions, making it seem like they "catch the top and bottom every time," but in reality, it’s all hindsight. A truly worthy blogger will have a trading logic that is consistent, coherent, and withstands scrutiny, rather than jumping in only when the market moves. Don’t be blinded by exaggerated data and out-of-context screenshots; long-term observation and deep understanding are necessary to discern who is a thinker and who is a dreamer!
This content is exclusively planned and published by Master Chen (WeChat public account: Coin God Master Chen). For more real-time investment strategies, solutions, spot trading, short, medium, and long-term contract trading techniques, operational skills, and knowledge about candlesticks, you can join Master Chen for learning and communication. A free experience group for fans and community live broadcasts are now available!

Friendly reminder: This article is only written by Master Chen on the official public account (as shown above); any other advertisements at the end of the article and in the comments section are unrelated to the author! Please be cautious in distinguishing between true and false, and thank you for reading.
免责声明:本文章仅代表作者个人观点,不代表本平台的立场和观点。本文章仅供信息分享,不构成对任何人的任何投资建议。用户与作者之间的任何争议,与本平台无关。如网页中刊载的文章或图片涉及侵权,请提供相关的权利证明和身份证明发送邮件到support@aicoin.com,本平台相关工作人员将会进行核查。


