师爷聊热点:
周五了,本周的市场宏观现在依旧还是一潭死水,所有人都在等美联储12月怎么出牌。市场表面平静,底下全是暗涌。美股也好,大饼也好,都在窄道里磨来磨去。
包括昨天的一些数据,也没有啥意义。连水花都翻不起来,市场基本上都在盯着下次的降息,到底是 25bp还是会搞惊喜或者是惊吓。
而这周估计也翻不起什么浪花了,大概率苟过去。那下周就要看点阵图和老鲍讲话、数据一串串往外砸,同时也会是我中线的埋伏点。
说到降息啊,我特么甚至真心希望这次别降。拖到明年一次性丢个50bp,让这群资本狗继续吊着预期炒、继续发骚。
市场就是要预期不断、噱头不断才有波动,有故事才会有散户往里冲。一次降爽了?行情可能直接宣布药效结束,现在这个节骨眼搞50bp,真可能会是这波行情的最后一舞,跳完全体下去。
还有老鲍这人,千万别换。真的,换了就是美股跳水、大饼瀑布的节奏。那种You jump,i jump 的剧情谁爱看?反正我不爱看。
现在好多的多头选手都被套得不像话,行情要是能再往上拱一段。好歹让这帮人先喘口气解个套,再去明年一季度抄底,而不是死等到回本位等着心累。
回到市场,大饼这两天的感觉说白了就是要出事但还没出的那种诡异安静。92K到93K反复摩擦,上不去、下不来,像在憋一口大招。
每次测试95K都被卖盘按回去,那抛压是真实的。可是90.5K到91K的支撑也是真扛着,谁都没占到便宜,就是硬耗。
周线结构我也看了,大区间上沿124.5K被掠夺之后一路向下。回踩了大区间下沿的周OB,现在是反弹,反弹最关键的就是摸99K,也就是年度的重要阻力。
能站上去才有戏,否则继续给你往8字头赶。小区间也是,几周都在箱体里晃。日线更扯,本周把上周低点掠夺了,又把上周高点掠夺了,这就是典型的洗人下车。
上面94.5到95K一直压着,现货连续在砸,合约硬撑着把震荡撑住。想往上,就必须放量站稳93.1K,否则还得下去做三探,目标直接看到88.8K。
中长期的看法我也不藏着掖着,偏空大于偏多。126.2K是顶,这轮上涨结束了。80.6K虽然是阶段底,但不是大底。
反弹到99K或107K都可能反转,然后往7开头的大饼走。现货一直卖,你跟着做多就是玩命,除非现货突然开始怼着买、价格带量站稳93.1K,不然多头又是送福利。
师爷看趋势:
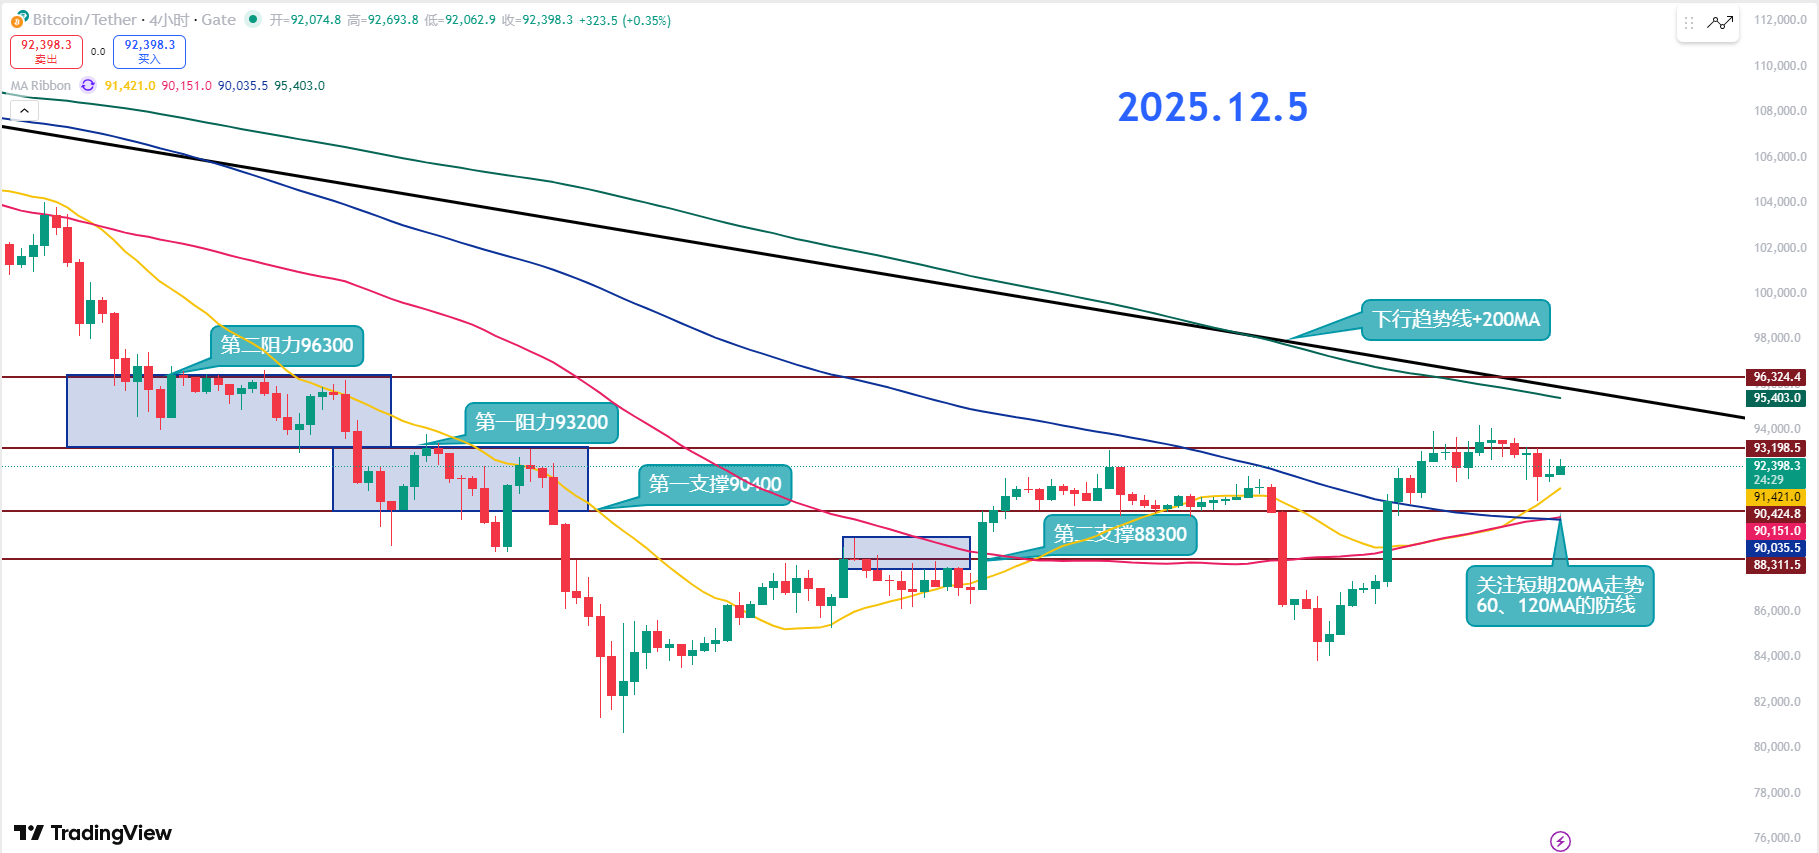
阻力位参考
第二阻力位:96300
第一阻力位:93200
支撑位参考:
第一支撑位:90400
第二支撑位:88300
短期的比特币就是典型的冲一脚、歇半天、磨死人。反弹完又开始横着走,现在基本贴着20MA在晃荡。
现在的价格完全卡在90.4K到93,2K这个老区间,想往上,不破93.2K就不会希望。想往下,只要 90.4K不丢,空头也不会突然下砸。
如果短线能重新推上93.2K,则有机会再去碰下行趋势线和200MA,也就是上方那条大级别压着市场脖子的线。但如果连20MA都守不住,那就看后面的60MA、120MA补位支撑,不然又得向下。
第一支撑90,4K是非常关键的支撑,跌破这里,多头短期无望。不破则可继续按反弹思路做,跌下去可以分批接点低位。这位置还和60、120MA重叠,算是多头最后的底裤。
第二支撑88.3K,真跌下去就看到这里,这里再破就是麻烦。第一阻力93,2K,这是短线必须突破的压力区间上沿,不突破就看震荡。
第二阻力96.3K,冲破93K后上面就开空间了。96.3K是下一个强压,但到这基本会来一波像样的回踩,别冲动追高。
12.5师爷波段预埋:
做多入场位参考:暂不参考
做空入场位参考:93200-93900区间空 目标:92000-91500
如果你真心想从一个博主那里学到东西,那就得持续关注,而不是看几次行情就妄下定论。这个市场充斥着表演型选手,今天多单截图,明天空单总结,看起来“次次抓顶抄底”,实际上全是马后炮。真正值得关注的博主,交易逻辑一定是前后一致、自洽且经得起推敲的,而不是行情动了才来跳大神。别被浮夸数据和断章截图迷了眼,长期观察、深度理解,才能分辨谁是思考者,谁是造梦人!
本文内容由师爷陈(公众号:币神师爷陈)独家策划发布,师爷陈全网同名。如需了解更多实时投资策略、解套、现货,短、中、长线合约交易手法、操作技巧以及K线等知识可以加到师爷陈学习交流,现已开通粉丝免费体验群,社区直播等优质体验项目!

温馨提示:本文只有专栏公众号(上图)是师爷陈所写,文章末尾及评论区其他广.告均与笔者本人无关!!请大家谨慎辨别真假,感谢阅读。
免责声明:本文章仅代表作者个人观点,不代表本平台的立场和观点。本文章仅供信息分享,不构成对任何人的任何投资建议。用户与作者之间的任何争议,与本平台无关。如网页中刊载的文章或图片涉及侵权,请提供相关的权利证明和身份证明发送邮件到support@aicoin.com,本平台相关工作人员将会进行核查。


