Cryptocurrency News
December 2 Hot Topics:
1. Cambodia's Huibang Payment has suspended operations until January 5 due to a temporary run on the bank and has initiated a delayed payment plan.
2. The FDIC will release the first regulatory proposal for stablecoin issuers under the GENIUS Act this month.
3. Google expands Gemini 3 and Nano Banana Pro AI search features to nearly 120 countries/regions.
4. SEC Chairman Paul Atkins will speak at the New York Stock Exchange tonight, focusing on his outlook for the 250th anniversary of U.S. capital market reform.
5. Solana announces a partnership with Kalshi to fully tokenize all of Kalshi's prediction markets.
Trading Insights
If you are engaged in contract trading, the following 5 tips may help you; remember to save and like!
- Technical Analysis: Pay attention to daily candlestick patterns and compare them with the previous day's characteristics; focus on tracking changes in resistance and support levels. If unchanged, maintain the original strategy; if there are fluctuations, adjust your trading approach accordingly.
- Market Strength Assessment: Continuous rises or falls often indicate a trend reversal; however, if key levels are not broken, so-called "rockets" or "waterfalls" are usually short-term fluctuations. In this case, high selling and low buying are preferred.
- Operational Principles: Stick to short-term trading; both long and short positions can participate, but the overall trend must be clear. If in a long-term downtrend adjustment period, be particularly cautious when going long; if in a long-term uptrend, remain vigilant when going short.
- Direction Identification: Whether going long or short, closely monitor the day's high and low points. If the day's high and low points break the previous day's range, it often indicates a shift in market forces, which can serve as a simple basis for directional judgment.
- Volatility Signal Interpretation: When volatility is within the previous day's high and low points, the market is relatively stable; however, if it shrinks to an extreme with low trading volume, it often signals an impending change. If the day's high and low points break the previous day's range and volatility expands, focus on the breakthrough of key support and resistance levels; if not broken, it indicates range-bound fluctuations, but there is still room for operation.
LIFE IS LIKE
A JOURNEY ▲
Below are the real trading group orders from the Big White Community this week. Congratulations to the friends who followed along; if your trades are not going well, you can come and test the waters.
Data is real, and each order has a screenshot from the time it was issued.
**Search for the public account: *Big White Talks Coins*
Bilibili and YouTube account: Daquan 777
BTC
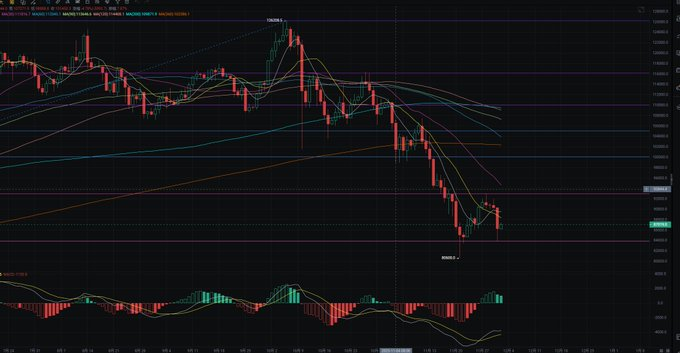
Analysis
Today's turnover rate has surprisingly continued to rise, but the data for inflows and outflows from exchanges has not changed significantly. It is likely an internal adjustment within the exchanges. From the structure of URPD, it appears that only the price of $90,000 has seen a transfer, with other turnover rates remaining low. Overall, the current chip structure is still quite healthy, and the gathering of investors is very evident. There are no signs of a significant exit from either loss-making investors or those who are profiting around $80,000; investor sentiment remains quite stable. The next key point is the Federal Reserve's interest rate meeting in December.
ETH
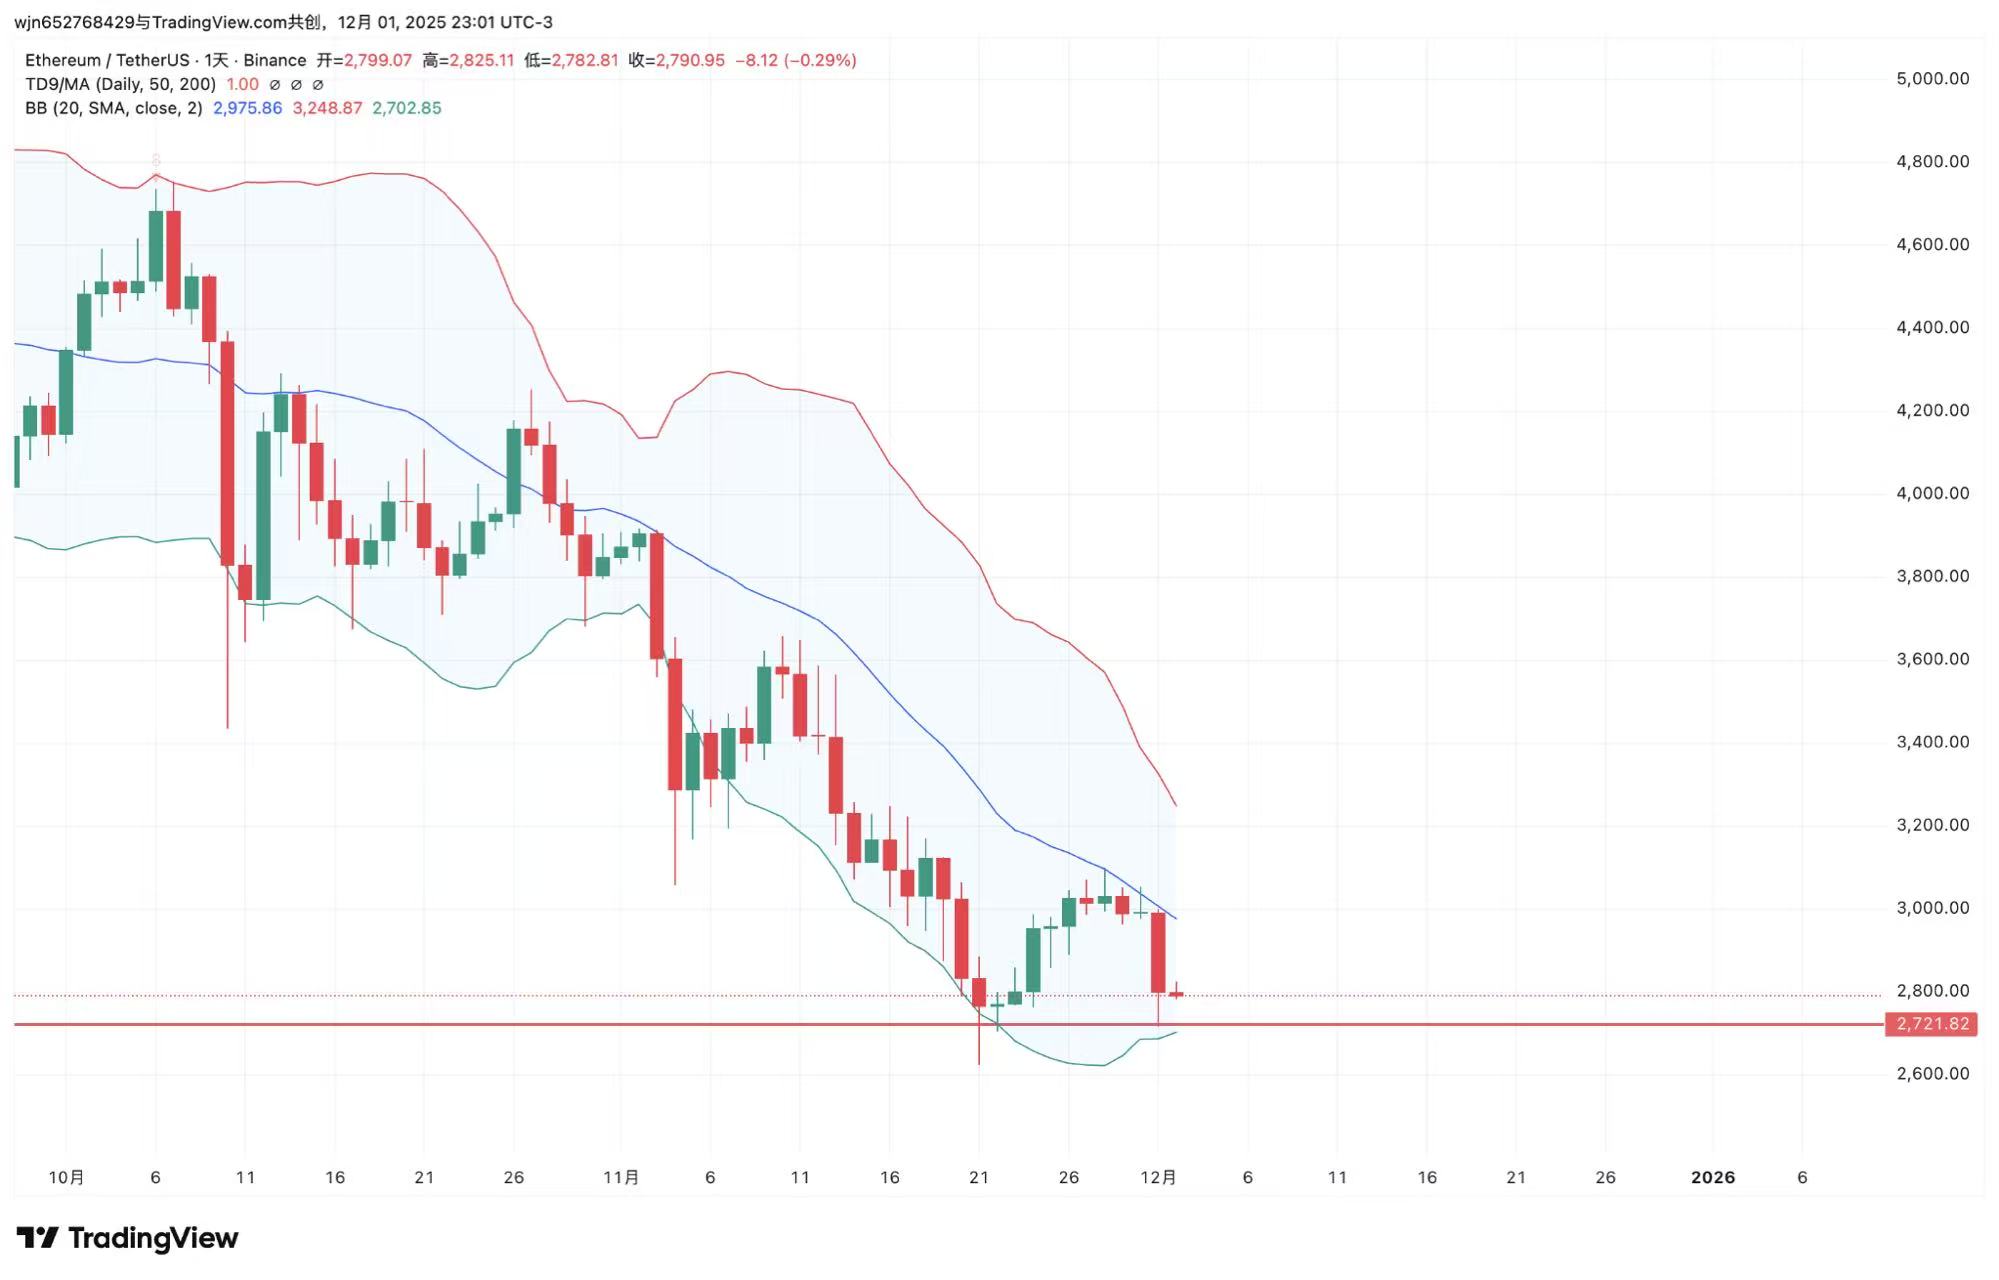
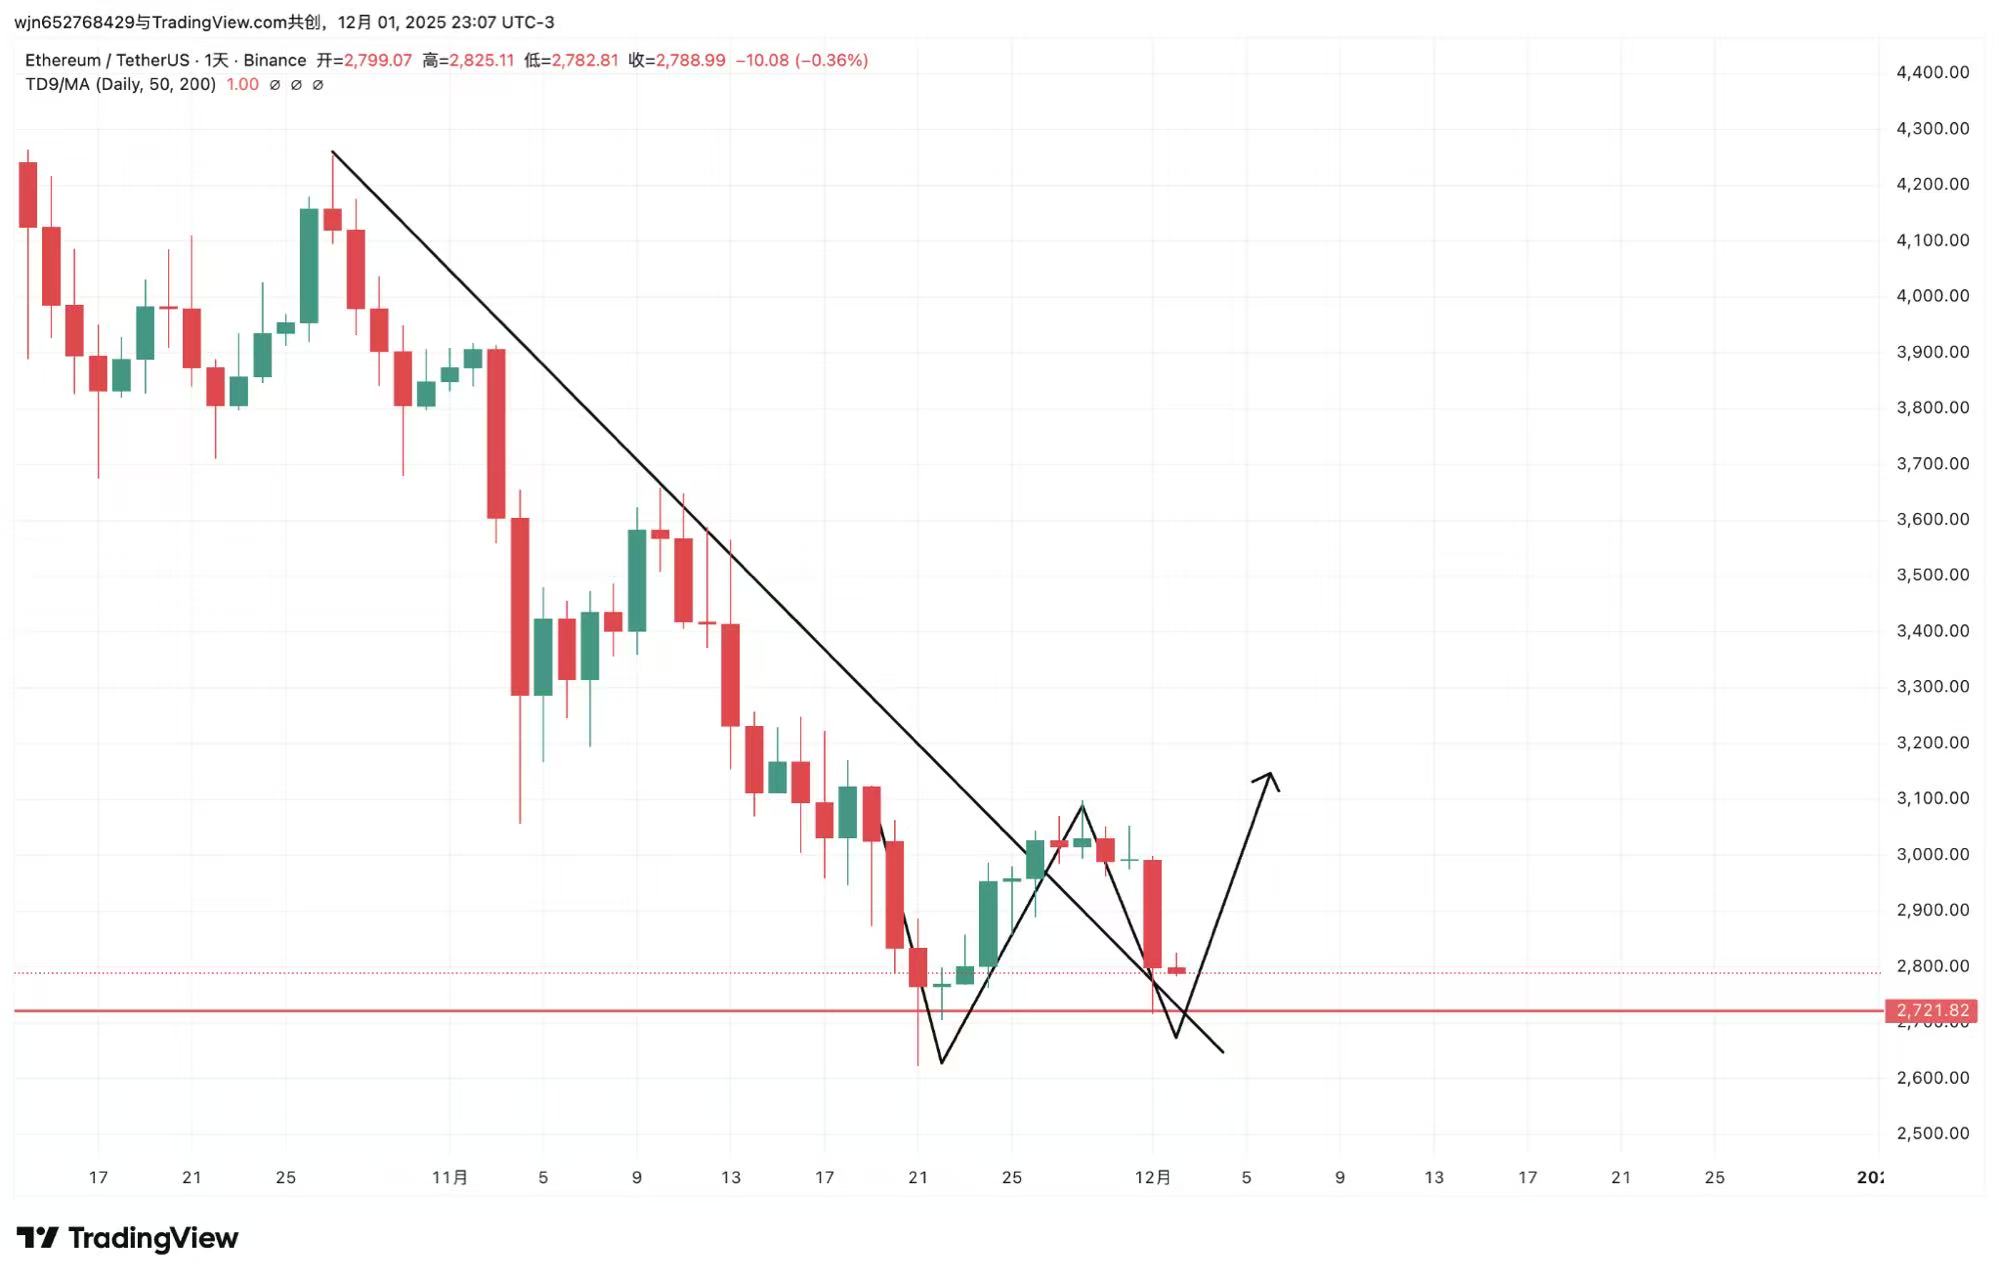
Analysis
Ethereum Weekly Level: Bearish trend not reversed, short-term shows weak stabilization signs.
In terms of candlesticks, the current trend remains a downtrend, and last week's candlestick did not show an effective rebound structure (such as a strong engulfing or double bottom). The candlestick has started to form a "small body + lower shadow" near the lower Bollinger Band, indicating a weakening of downward momentum, so there are signs of weak stabilization, but the overall direction still needs to wait.
In terms of key support levels, the current candlestick area is near the lower Bollinger Band support. If it breaks down, this will become an acceleration point for the next downtrend. The key support at the weekly level below is around 2230, and the half-dead middle track MA20 is turning down. After the oscillation is completed, the probability of a downward acceleration remains high.
4-hour level: Weak rebound fails, bearish structure complete. 2620-2720 becomes a key watershed again. From the Vegas perspective, the price is always running below Vegas, all moving averages are in a bearish arrangement, and Vegas has formed a death cross. Each rebound only reaches near Vegas before being pushed back, which is a typical "rebound selling point in a downtrend."
Disclaimer: The above content is personal opinion and for reference only! It does not constitute specific operational advice and does not bear legal responsibility. Market conditions change rapidly, and the article has a certain lag. If you have any questions, feel free to consult.
免责声明:本文章仅代表作者个人观点,不代表本平台的立场和观点。本文章仅供信息分享,不构成对任何人的任何投资建议。用户与作者之间的任何争议,与本平台无关。如网页中刊载的文章或图片涉及侵权,请提供相关的权利证明和身份证明发送邮件到support@aicoin.com,本平台相关工作人员将会进行核查。


