价格波动的背后是人群意愿的分离,选择了不同的路而已,这世界哪有对错,有的只是立场。交易是一场修行,市场就是你的道场,经历和时间不会让我们成长,只有反思与总结才会慢慢看清不足的自己,一点点往好的方向努力,登顶终将是我们一起奔赴的远方。
大家好,我是交易员格格。大饼近日迎来了一波还算不错的反弹,目前维持在90000上方震荡,上文说过90000-91000是第一个关键分界,是否能够完全企稳还有待观察。今天28号,周线和月线收线会是在同一天,马上进入周末,月线的形态不会有很大的变化,格格先聊聊周线。
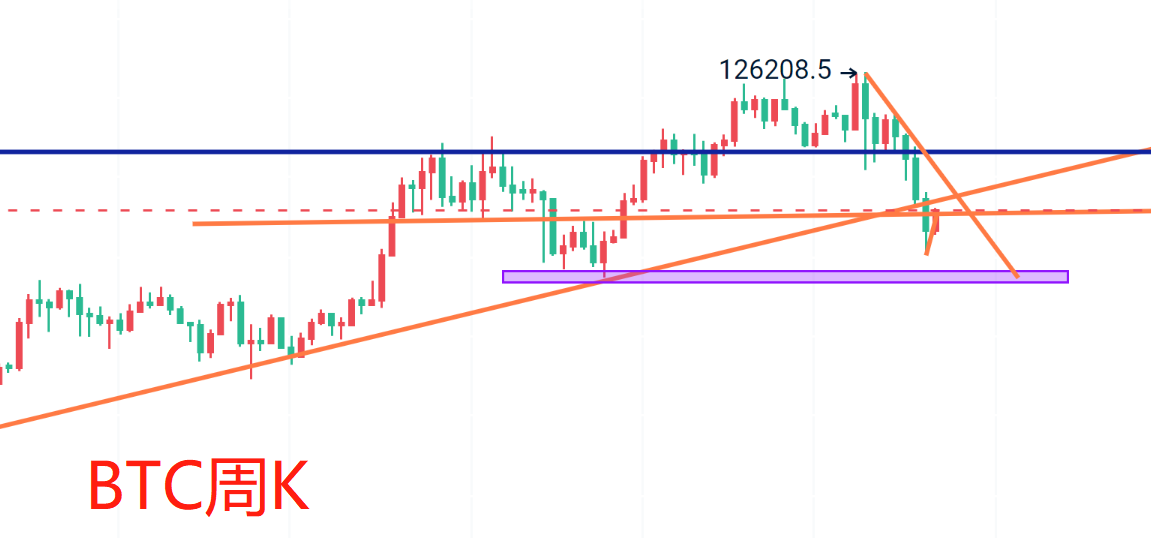
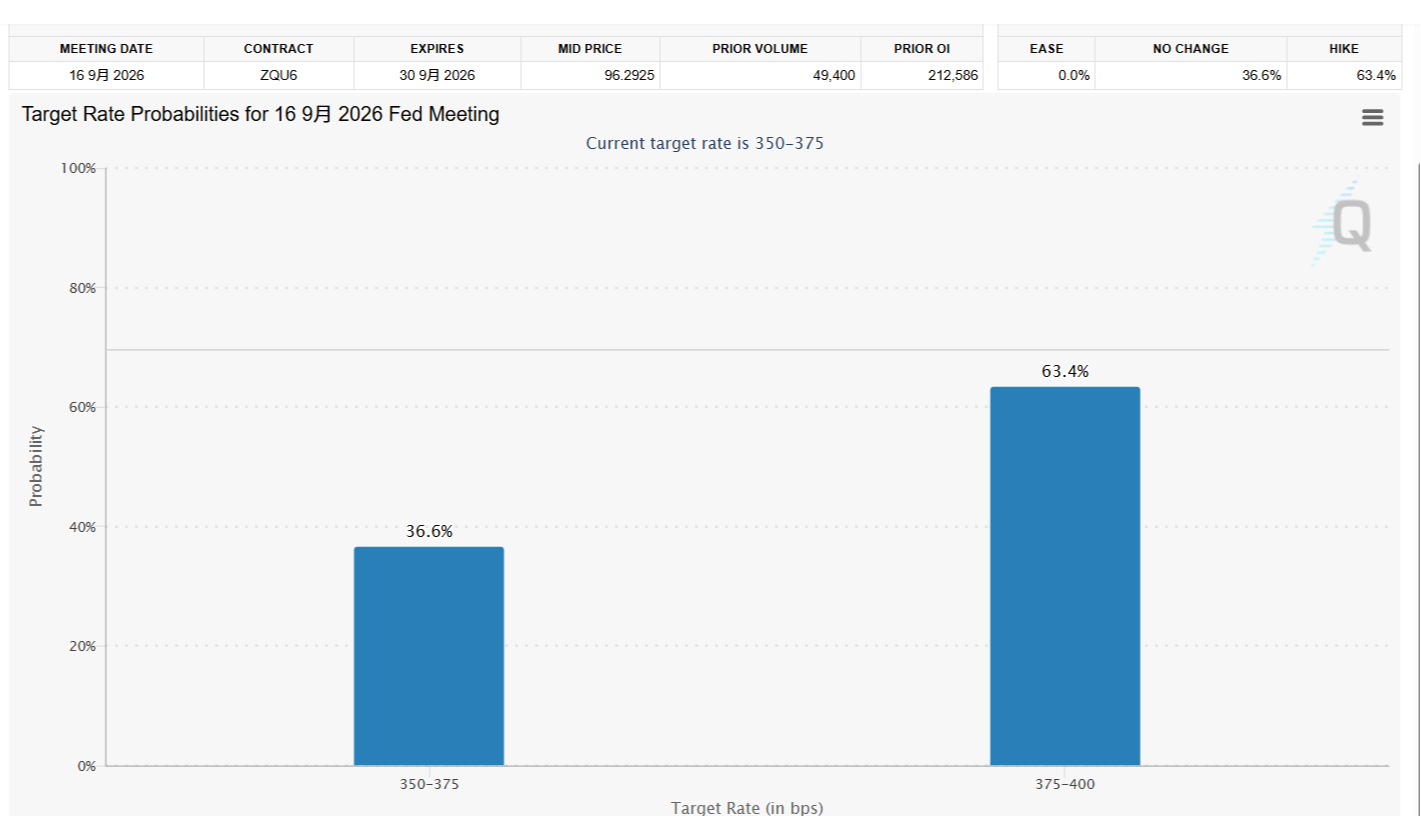
周线级别从本周开盘之后行情都是处于震荡向上的,如果能企稳90000上方,接下来短期的关键点就是前K的开跌口附近,也是趋势线附近,对应的价格在95000一线。现下的K线要维持阳线,那么收线之前价格不能跌破87000一线,这样下周维持震荡不深跌的概率会大一些。还有就是要继续关注MACD双线,目前有跌破0轴的迹象,如果行情继续维持震荡向上,快线出现拐头向上,这也是短期利好多头的信号,同时,上文关于月线的预估(下月如果再出现探底都是比较好的建仓机会)也是成立的。
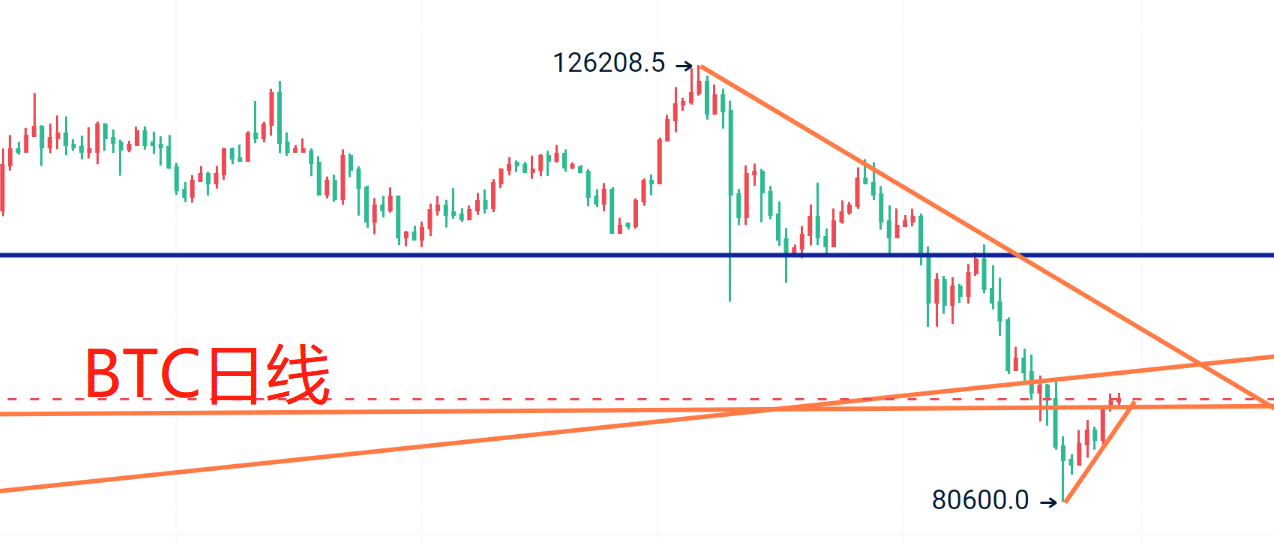
日线级别行情虽然突破MA7,BOLL也处于缩口的状态,只是表明行情经过连续下跌之后的调整,而不是真正的反转,整体的结构还是处于下跌通道。短线如何去做?目前90000关口的短期支撑,大家都可以通过K线看到,或许会有虚破的动作,上方可以通过趋势线由支撑转换压力的思路去参考,以95000一线为分界。综上,大饼短线89300-88500一线接多,93500-94300一线接空。今天就酱紫,有时间会保持日更,感谢关注阅读!
建议仅供参考,进场做好风控,利润空间止损空间自行把握,具体策略临盘为主可咨询。
好了,朋友们,我们要说下期再见了,祝大家越做越好,在币圈前程似锦一帆风顺!更多的实时建议在内部发送。今天的简更到此结束。大饼姨太更多实时建议找到格格。
文/我是交易员格格 一个愿意陪你东山再起的朋友

免责声明:本文章仅代表作者个人观点,不代表本平台的立场和观点。本文章仅供信息分享,不构成对任何人的任何投资建议。用户与作者之间的任何争议,与本平台无关。如网页中刊载的文章或图片涉及侵权,请提供相关的权利证明和身份证明发送邮件到support@aicoin.com,本平台相关工作人员将会进行核查。