Bitcoin's recent performance has been weak, dropping to $80,600 on Friday night, a 36% decline from its October peak. The overall market capitalization of the cryptocurrency market has fallen below $3 trillion, and the Fear and Greed Index remains at an extreme fear level. However, reports of the Federal Reserve potentially lowering interest rates and U.S. officials allowing Nvidia to sell AI chips to China have boosted Bitcoin's price over the weekend, which briefly rose above $88,000 this morning, while Ethereum also saw a slight increase above $2,800.
This week coincides with the Thanksgiving holiday, which may lead to lighter market trading but could also result in significant volatility. As the U.S. government resumes normal operations, key data such as the Producer Price Index (PPI), GDP, and Personal Consumption Expenditures Price Index (PCE) will be released this week.
Bitcoin Four-Hour Chart
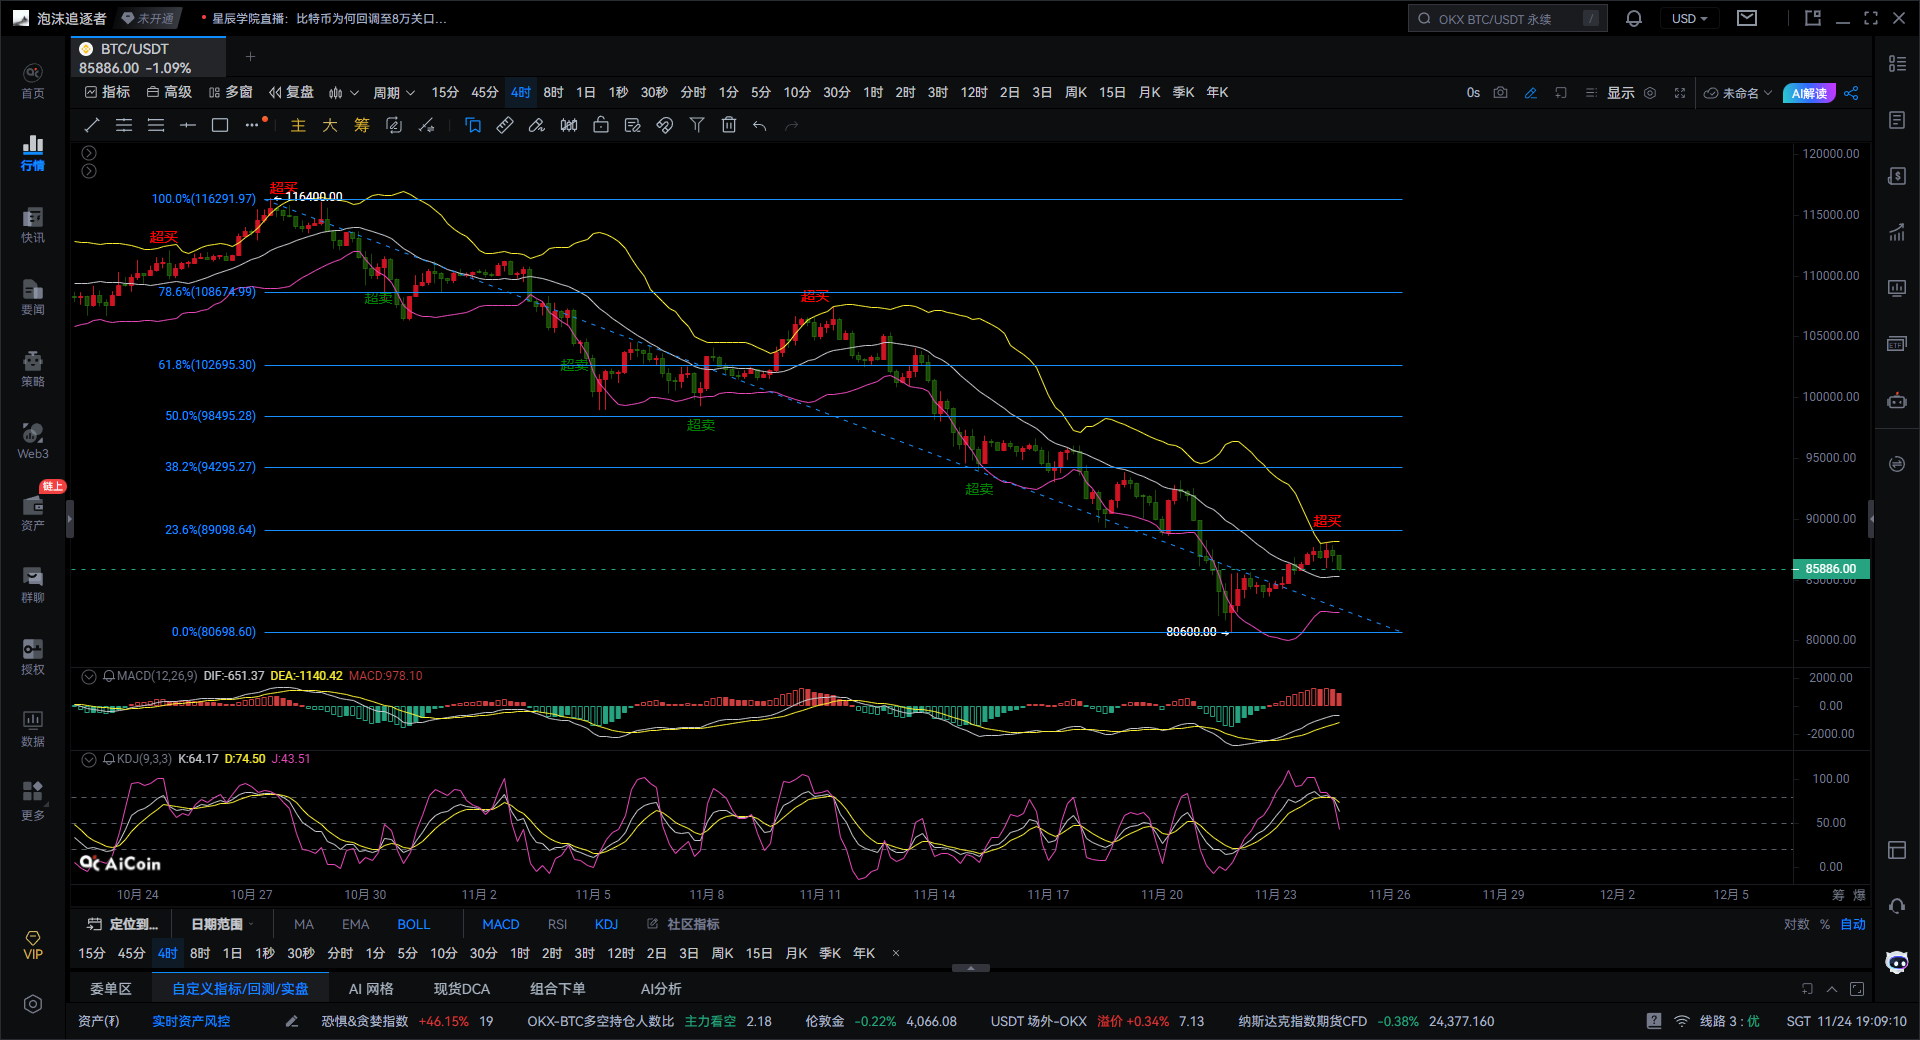
First, let's look at the Fibonacci retracement levels. Key positions are: 0% around $80,689, 23.6% at $89,098, 38.2% at $94,925, and 50% and 61.8% close to $98,500 and $102,700, respectively. Currently, Bitcoin's price is fluctuating around $86,000, stuck in the low range between 0% and 23.6%. This means that if the price cannot recover above $89,000-$90,000, the rebound cannot be considered strong and will still be in a weak consolidation phase.
On the Bollinger Bands, the lower band has been repeatedly tested, indicating that there is buying support at the bottom; the middle band is still suppressing the price, and the rebound strength is insufficient; the Bollinger Bands are gradually narrowing, suggesting that the market is about to choose a direction, with decreasing volatility typically indicating that a significant move is imminent.
The MACD currently shows a shortening green histogram, with the DIF line approaching the DEA, but a golden cross has not yet formed, and it is still operating below the zero line. This indicates that the bearish strength is weakening, and bulls are beginning to attempt a counterattack, but a reversal is still a way off. As long as the MACD does not form a golden cross, the current rise can only be considered a pullback.
The KDJ indicator shows that both the K and D values are around 70, and the J line has started to decline, indicating an overbought signal. This suggests that the recent rise has been a bit too fast, and a pullback may be needed before choosing a new direction.
Overall, the major trend is still downward, but there are signs of stabilization at smaller levels. Bitcoin has dropped from a high of $116,000, and several attempts to break through the upper boundary of the descending channel have failed, indicating a typical bearish market. Recently, it hit a low of around $80,600, just at the end of the descending structure, with multiple pin bar formations indicating that buying orders below are starting to absorb selling pressure.
There are roughly three potential market movements ahead:
1. A strong rebound, requiring a stable position above $90,000, with initial targets at $94,900, then $98,500, and if strong, pushing towards $102,600. The probability is about 30%.
2. A weak consolidation, continuing to oscillate between $83,000 and $89,000, with the Bollinger Bands continuing to narrow and the KDJ fluctuating. This scenario is the most frustrating, with a probability of around 40%.
3. Continued decline; if it breaks below $83,000, it may retest the previous low of $80,600, or even drop to the $78,000 to $75,000 range. However, the current bearish strength has clearly weakened, and unless there is significant negative news, the probability of a direct drop is not high, around 30%.
In summary, the market is currently waiting for a showdown between bulls and bears. The narrowing of the Bollinger Bands combined with the weakening MACD momentum suggests that a significant market move could happen at any time. In the short term, attention should be paid to the pullback pressure from the KDJ's overbought condition; the $83,000-$85,000 range is the last line of defense for the bulls, and only a rise above $90,000 can be considered a true bullish start. Overall, it feels like a spring compressed to its limit; the longer it is pressed, the more explosive the release will be, leading to either a significant rise or a significant drop, so everyone should stay alert.
Here’s a 100% accurate suggestion: rather than giving you a guaranteed profit, I’d rather provide you with the right mindset and trend. Teaching someone to fish is better than giving them fish; learning to earn will benefit you for a lifetime!
Written on: (2025-11-24, 19:10)

(Article by - Daxian Talks Coins) Disclaimer: Online publication may have delays; the above suggestions are for reference only. Investment involves risks; proceed with caution!
免责声明:本文章仅代表作者个人观点,不代表本平台的立场和观点。本文章仅供信息分享,不构成对任何人的任何投资建议。用户与作者之间的任何争议,与本平台无关。如网页中刊载的文章或图片涉及侵权,请提供相关的权利证明和身份证明发送邮件到support@aicoin.com,本平台相关工作人员将会进行核查。


