数字货币k线入门基础知识图解(一)
K线图是一种源于日本德川幕府时代的图表形式,最初被米市商人用于记录行情与价格波动,后因其细腻独到的标记方式而被引入股市及期货市场。其图形状似蜡烛,且有黑白之分,故也称为阴阳线图表。通过K线图,能够完整记录每日或某一周期的市场表现,股价经过一段时间的运行后形成特定形态,从中可摸索出有规律的市场信息。
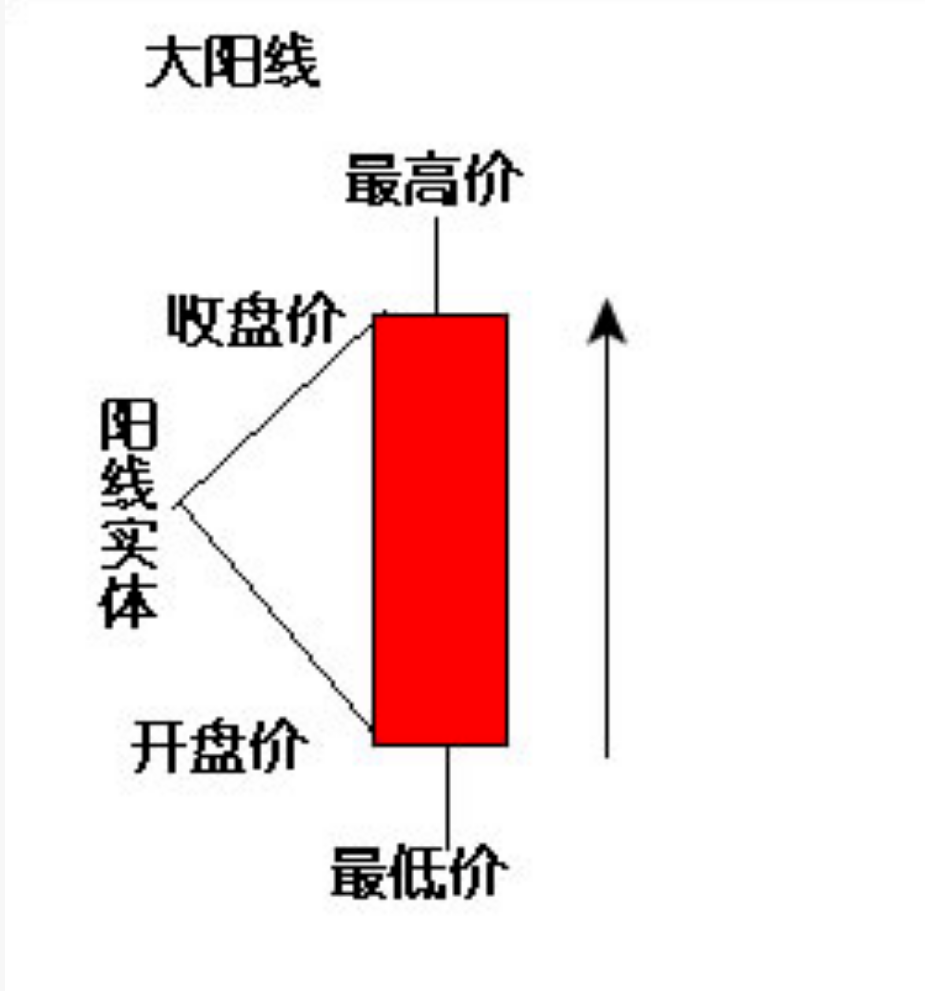
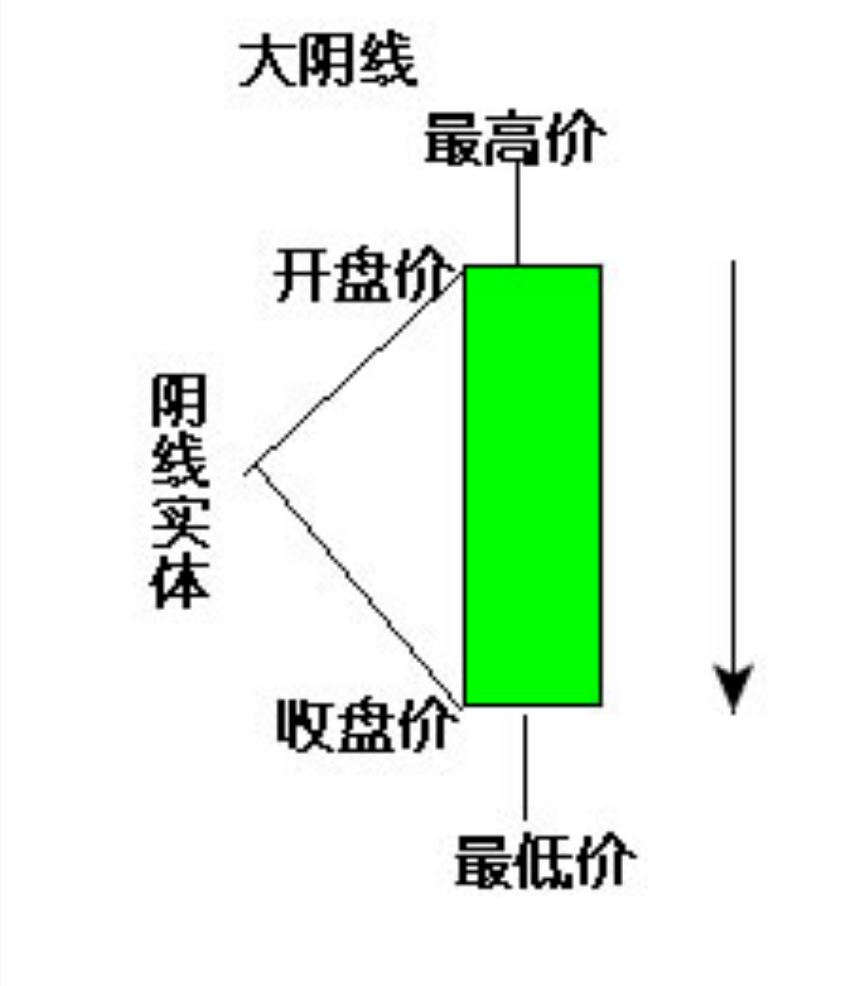
K线图以每个分析周期的开盘价、最高价、最低价和收盘价绘制而成。以日K线为例,开盘价与收盘价之间的部分绘制为矩形实体:若收盘价高于开盘价,称为阳线,通常用红色实体表示(开盘价在下、收盘价在上);反之则为阴线,常用绿色实体表示(开盘价在上、收盘价在下)。此外,用细线连接最高价和最低价与实体,分别形成上影线和下影线。需注意的是,在数字货币、欧美股票及外汇市场中,颜色习惯与国内相反,常用绿色表示阳线、红色表示阴线。
根据分析周期不同,K线图可分为1分钟K线、日K线、月K线等。例如,日K线的一根K线代表一天,而1分钟K线的一根代表1分钟。不同周期的K线之间存在包含关系:日K线由24根60分钟K线综合形成,60分钟K线则由60根1分钟K线波动综合形成。
1.什么是阳线?
阳线
阳线根据影线与实体的不同组合,可细分为多种形态,各自预示着不同的市场含义:当阳线无下影线且上影线很长时,表明股价上涨途中遭遇了强劲的抛压;反之,若无上影线且下影线很长,则意味着买方力道强劲,股价下跌时获得有力支撑。没有上下影线的长红柱(又称太阳线),标志着一路上涨,买方力量占据绝对主导。若上影线长、下影线短,显示多空交战激烈但多方稍占上风,这常是趋势反转的信号——值得注意的是,若此形态出现在大涨后,可能预示后市将下跌,而若出现在大跌后,则可能预示触底反弹。当上影线短、下影线长时,代表上涨力道强劲,即使下跌也能迅速收回失地。最后,如果上下影线都很长而红色实体很短,则表明多空双方力量趋于均衡,后市行情显得扑朔迷离。
2.什么是阴线?
阴线
阴线的不同种类:无线影线,上影线长表示先涨后跌,反弹无力,空头强势;无上影线,下影线长,表示跌势强劲但下面有支撑;上下影线短,绿柱体长下跌趋势中出现,表示下跌力道仍然强劲,大涨后出现,表示翻转试探,表示后市可能急速下跌;无上下影线,也叫大阴线,表一跌到底,卖方强劲;下影线短,上影线长,表示多空交战,空方较强势,反弹无力;上影线短,下影线长,表多空交战,空方较强势但下跌时强劲支撑;上下影线长,绿柱短,表多空力量均衡,行情不明
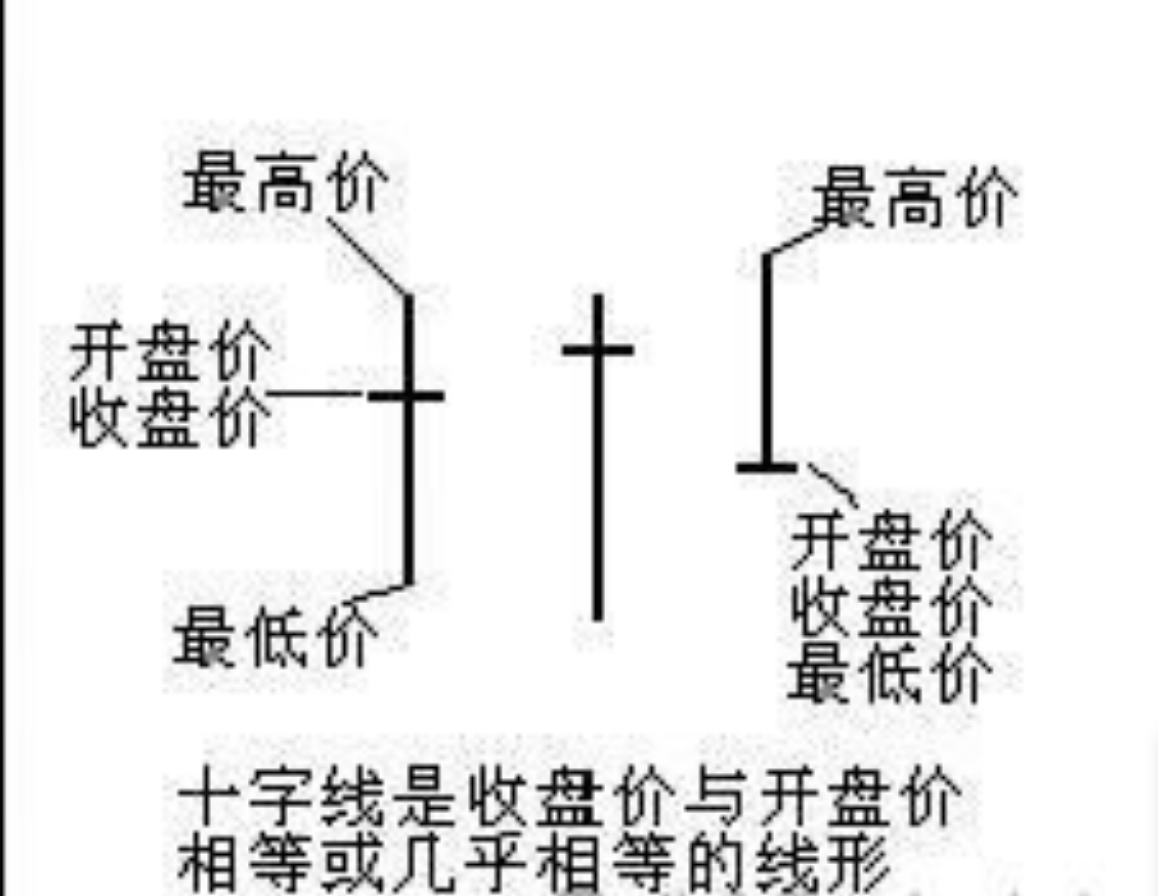
什么是十字线?
十字线的不同种类:上影线长,无下影线,即倒T形,表买方虽强但卖方将价格拉回,空方较强势;下影线长,无上影线,即T形,表卖方虽强但买方将价格拉回,多方较强势;上下影线长,即大十字,多空两方势均力敌,后市需观察;上影线长,下影线短,表开盘后上涨但收盘却被打回平盘,空头较强势;下影线长,上影线短,表先跌后涨,买方较强势
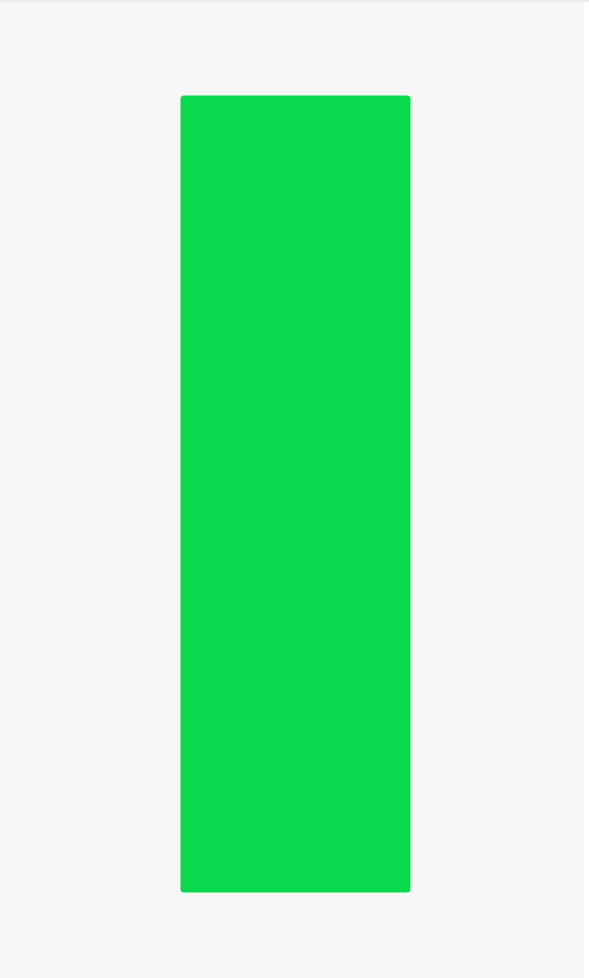
光头光脚阴线
特征:光头光脚阴线为逐波下跌的行情。表明空方在盘中完全占优,多方无力抵抗,股价下一交易日大多出现跳空低开
出现位置:在下跌行情中出现说明股价将会加速下跌
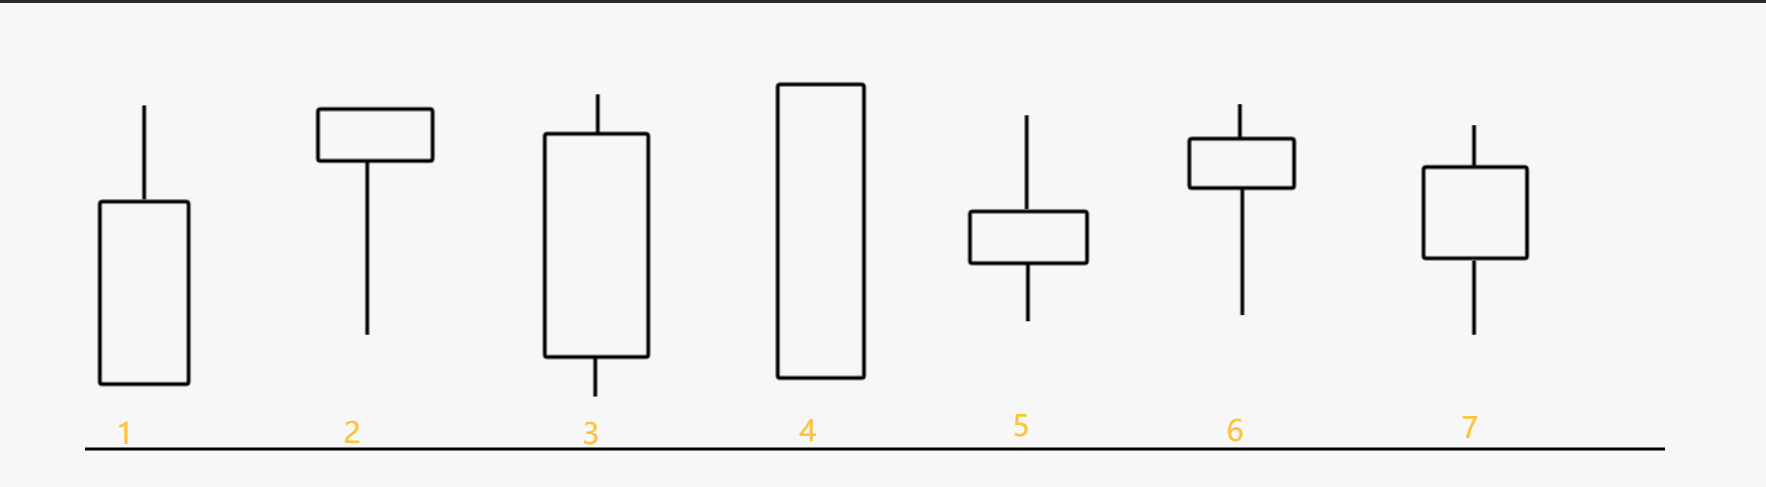
3.阳线
阳线的不同子类
无下影线,上影线长,表示股价上涨时遇到强劲反压力道,如上图1)所示;
无上影线,下影线长,表示买方力道强劲,下跌时有支撑,如上图2)所示;
上下影线短,实体红柱长,表示涨势强劲,股价坚挺,如上图3)所示;
无上下影线,长红柱,也叫太阳线,表示一路上涨,买方力道强劲,如上图4)所示;
上影线长,下影线短,表示多空交战,多方更强势,常表反转信号。需要注意的是,大涨后出现,常代表后市可能下跌,而大跌后出现,常代表后市可能触底反弹,如上图5)所示;
上影线短,下影线长,代表上涨力道强,下跌后收回,如上图6)所示;
上下影线长,实体红柱短,代表多空交战,力道均衡,行情扑朔不明,如上图7)所示
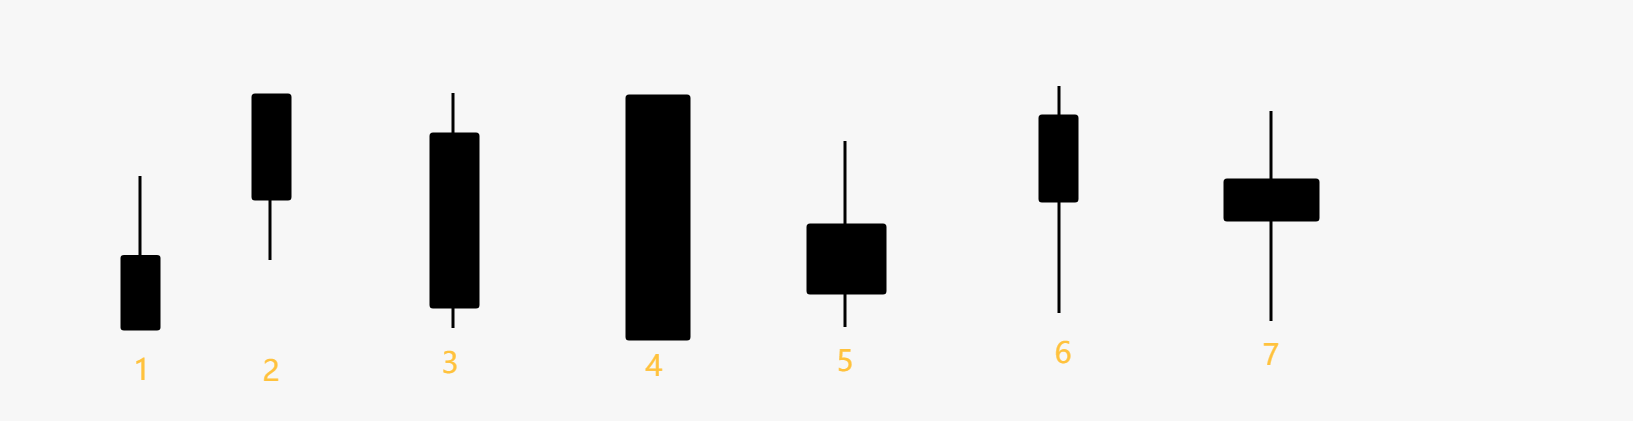
4.阴线
阴线的不同子类
无下影线,上影线长,表示先涨后跌,反弹无力,空头强势,如上图1)所示;
无上影线,下影线长,表示跌势强劲但下面有支撑,如上图2)所示;
上下影线短,绿柱体长,下跌趋势中出现,表示下跌力道仍然强劲;大涨后
出现;表示翻转试探,表示后市可能急速下跌,如上图3)所示;
无上下影线,也叫大阴线,表示一跌到底,卖方强劲,如上图4)所示;
下影线短,上影线长,表示多空交战,空方较强势,反弹无力,如上图5)所示;
上影线短,下影线长,表示多空交战,空方较强势但下跌时有强劲支撑,如上图6)所示;
上下影线长,绿柱短,表示多空力量均衡,行情扑朔不明,如上图7)所示。
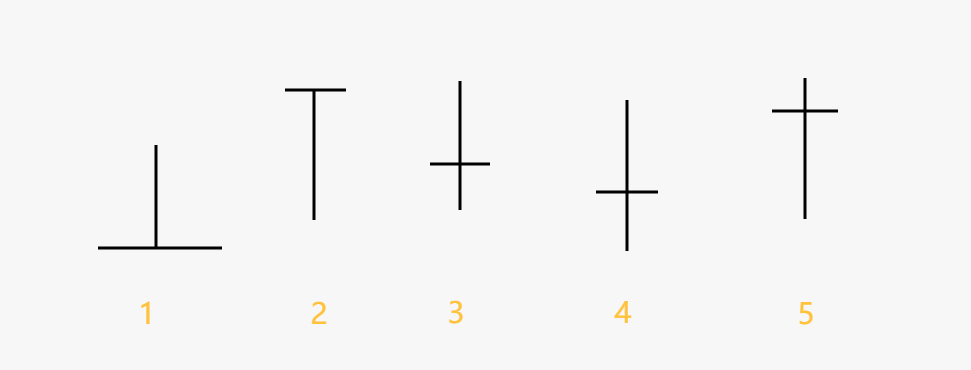
5.十字线
十字线的不同子类
上影线长,无下影线,即倒T形,表示买方虽强但卖方将价格拉回,空方较强势,如上图1)所示;
下影线长,无上影线,即T形,表示卖方虽强但买方将价格拉回,多方较强势,如上图2)所示;
上下影线长,即大十字,多空两方势均力敌,后市需观察,如上图3)所示;
上影线长,下影线短,表示开盘后上涨但收盘却被打回平盘,空头较强势,如上图4)所示;
下影线长,上影线短,表示先跌后涨,买方较强势,如上图5)所示。
每日更多实时单可关注公众号(币先生论币)获取,可以在线盘面技术学习,解套出局等,本人对市场研究多年,研究币圈大趋势,多次在美深造学习主要分析指导BTC、ETH、DOT、LTC、FIL、EOS、BCH、ETC、等币,对于不会操作的各位币友们欢迎一起研究学习,

免责声明:本文章仅代表作者个人观点,不代表本平台的立场和观点。本文章仅供信息分享,不构成对任何人的任何投资建议。用户与作者之间的任何争议,与本平台无关。如网页中刊载的文章或图片涉及侵权,请提供相关的权利证明和身份证明发送邮件到support@aicoin.com,本平台相关工作人员将会进行核查。


