This article is merely a personal market opinion and does not constitute investment advice. Any trading based on this is at your own risk.
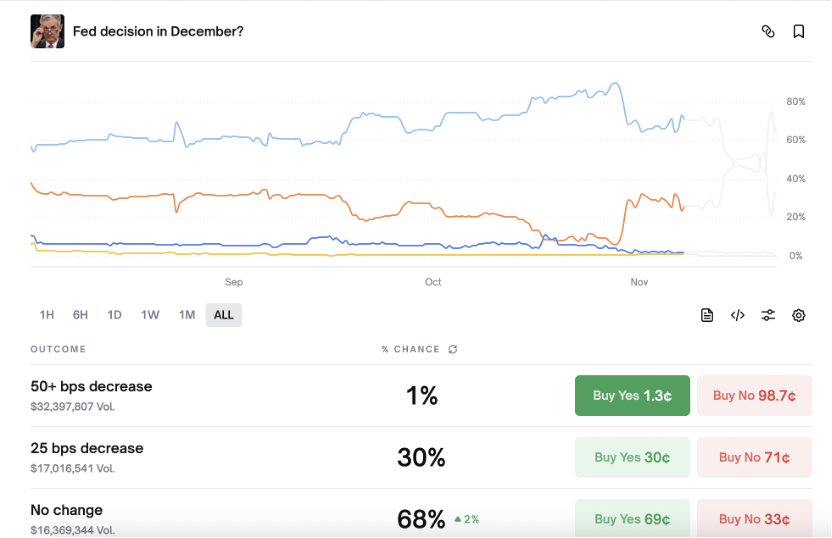
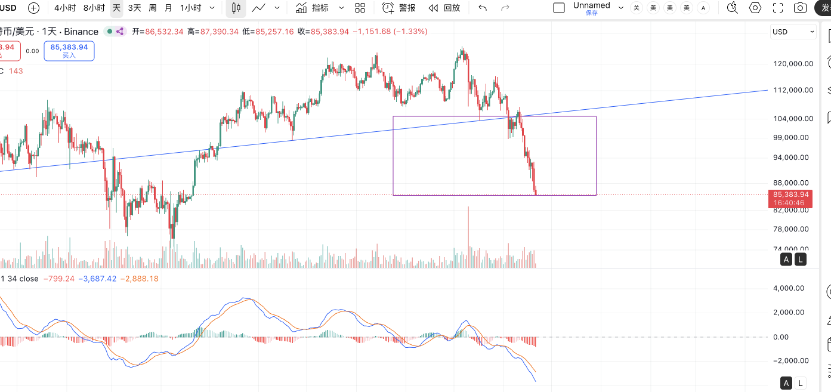
On the 17th, the target of BTC-85k and ETH-2700 was mentioned, and the speed of reaching these targets was unexpected, with the market plunging all the way down. The core reason lies in liquidity; the expectation of interest rate cuts in December has dropped to 30%, lower than when the previous article was published. Without expectations of liquidity improvement, there is no momentum for price rebounds.
From the head and shoulders pattern of BTC, it has already fallen to the target position. As for how much lower it can go, it is difficult to predict in advance. Generally speaking, even with a short-term spike, the 75k position should be hard to break. More precise tracking can only be done on open interest, trading volume, and funding rates. However, based on experience, after such a large-scale pattern reaches the target position, the short-term low will not be too far away, essentially just a spike difference. If U.S. stocks can stop falling tonight, I estimate that there will be a period of consolidation ahead. Or if there is a big spike tonight, that would be the best outcome, triggering short-term panic selling, which would at least stabilize the market for now.
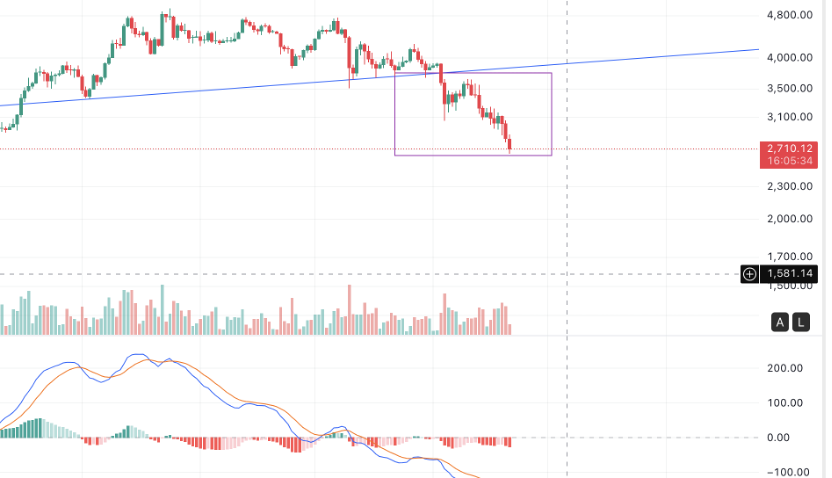
Looking at ETH's trend, it has also fallen to the head and shoulders target position.
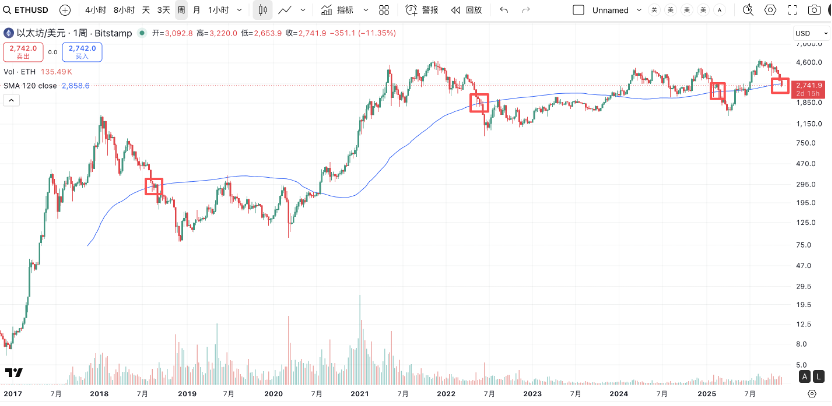
From the long-term perspective in the chart below, ETH's weekly K-line is clearly defined around the 120-week line. The current price is around 2860. In the past, when the weekly level fell to this point, there would typically be a 2-3 week consolidation. In the previous three instances when it started to fall from the top and broke below the 120-week line, as long as there was a spike below, it would definitely continue to fall. This is the fourth time.
Considering the emotional performance discussed below, this should not be the bottom of a major pullback, but it may consolidate for a while. In trading, I think a rebound short strategy could be adopted.
Since this decline, especially this week's drop, the funding rates indicate a very high bullish sentiment. The funding rates have remained elevated. Generally speaking, as one approaches a true bottom area, the sentiment is usually very bearish, reflected in the funding rates being persistently negative. So far, this phenomenon has not been observed.
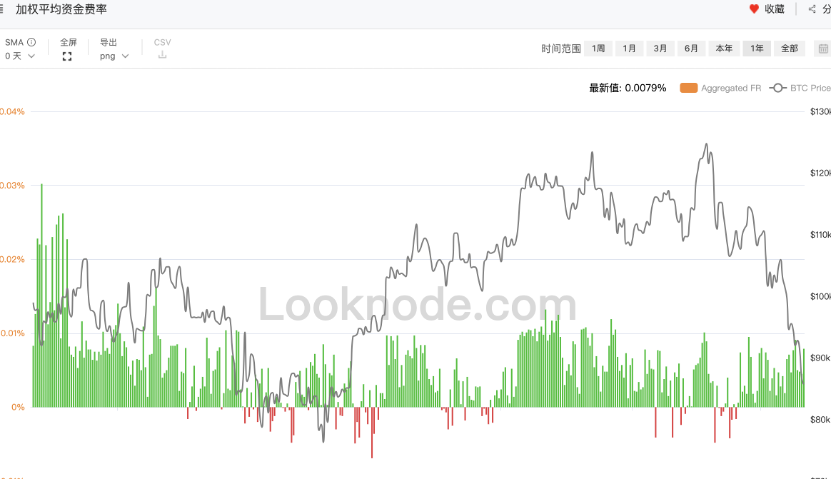
It is important to note that the true bottom area is not simply the lowest price point, but rather a region formed after consolidation, where the price rebounds and then falls again.
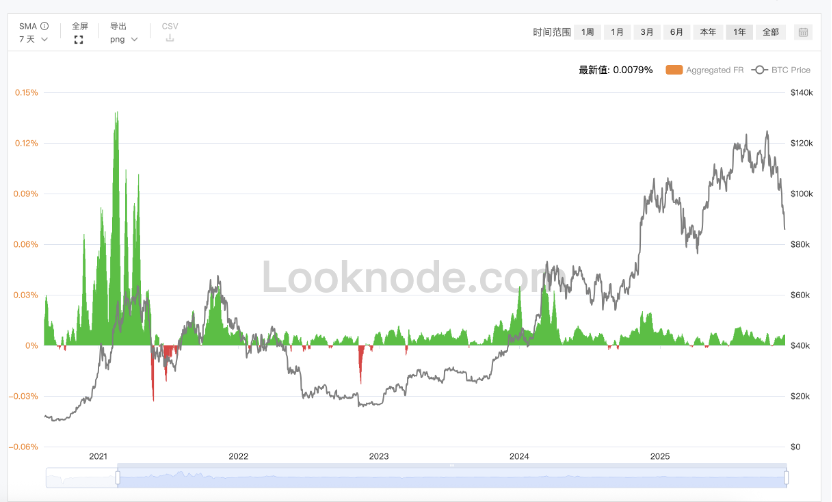
Looking at the 7-day average of the funding rates in the chart below, it becomes clearer. This sentiment indicator has been very reliable up to now. Just as I am typing this, BTC has dropped to a low of 82k, and ETH has dropped to a low of 2640+, but the funding rate is still at 0.01%, showing no signs of turning negative. Therefore, this should not be the true bottom.
Trying to catch the bottom seems quite difficult at this stage, and the cost-effectiveness is not high. It can only be said that everyone relies on their own skills.
Follow me to maximize trend profits with minimal operations.

免责声明:本文章仅代表作者个人观点,不代表本平台的立场和观点。本文章仅供信息分享,不构成对任何人的任何投资建议。用户与作者之间的任何争议,与本平台无关。如网页中刊载的文章或图片涉及侵权,请提供相关的权利证明和身份证明发送邮件到support@aicoin.com,本平台相关工作人员将会进行核查。


