凌晨消息面和市场做箜情绪加持导致行情呈震荡阴跌走势比特币再次跌破98000一线支撑后开启反弹修复。当前日线K柱3连阴,指标方面MACD 与KDJ 水底下方呈箜头放量运行,MA日均线及BOLL带整体趋势呈箜头发散。加上币价高点不断下移,箜头情绪浓厚,不过当前指标超买严重加上币价与MA5日均线之间产生3000-4000缺口,预计日内比特币会进行一波反弹超跌反弹修复缺口然后再次承压走跌,当前高点压制参考在100500-102000一线。低点支撑98000一线关乎本周生命线,无法有效跌破那么本周末预计会震荡修复调整,一旦今日或凌晨空头再次发力跌破98000支撑,比特币将会继续试探下方前期起涨关键点91500一线。
4小时线当前币价运行在BOLL带下轨附近,各指标呈空头向下运行,导致指标超卖严重,且TD指标来到TD5,MA5日均线持续压制币价导致行情反弹无力,结合小时线来看比特币偏向震荡回撤走势,若箜头量能跟进,币价极有可能会再次试探91500一线支撑。
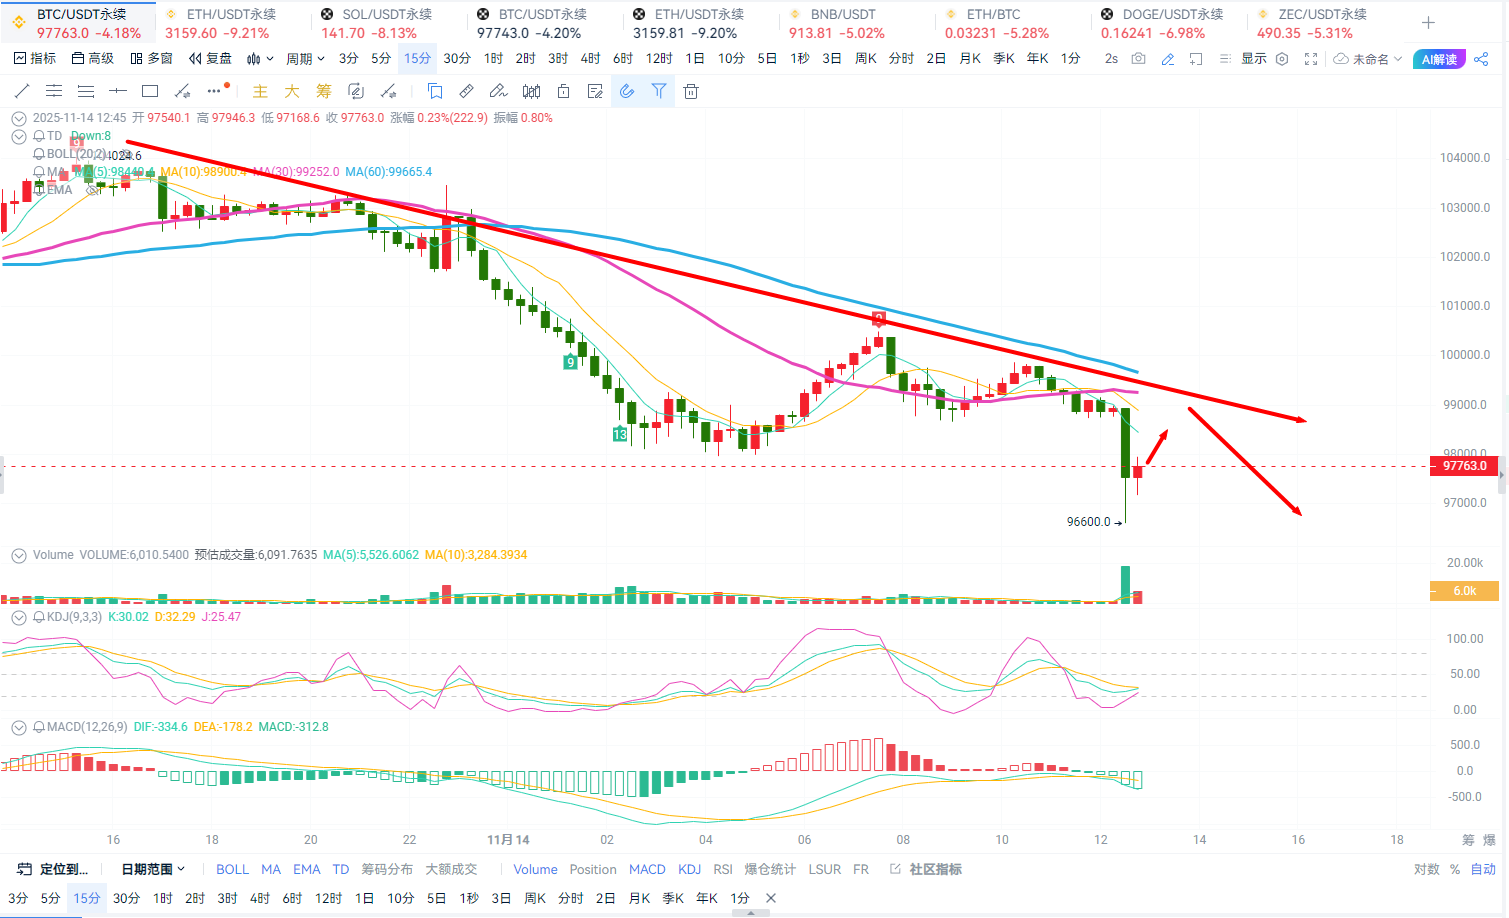
操作策略:比特币:98500-99500分批哆箜目标:96500-94000即可 止笋上移500点
做多点位参考在94000-93000一线
以太坊当短期走势基本与大饼同步,不过整体抗跌性不如大饼,当前以太坊高点压制参考在:3250-3310一线。低点支撑3052-2873一线,对于日内操作而言和大饼一致,所以日内个人看法可以高箜为主,低多为辅思路。
操作策略:3200-3250分批箜 目标:3120-3000即可 止笋3275
做哆点位参考在:3000-2950一线
对于当前走势预计够用,后续将会持续跟进
个人看法仅供参考,文章审核推送有延迟,行情瞬息万变,具体进场离场点位以实时指导为主,入市需谨慎。

免责声明:本文章仅代表作者个人观点,不代表本平台的立场和观点。本文章仅供信息分享,不构成对任何人的任何投资建议。用户与作者之间的任何争议,与本平台无关。如网页中刊载的文章或图片涉及侵权,请提供相关的权利证明和身份证明发送邮件到support@aicoin.com,本平台相关工作人员将会进行核查。


