
The Bitcoin monthly line is about to close, and the probability of closing as a doji this month is high. From the OBV technical indicator, funds are indeed flowing out. The weekly line is still oscillating at a high level. Next, we will see if the weekly line can stabilize above the MA200; only then will the bulls have hope.
Ethereum has closed as a doji for three consecutive weeks, and it is oscillating below the previous double bearish candlesticks. The MACD has been consistently below the zero line, and the crossover rebound of the fast and slow lines is still relatively weak, oscillating around the MA120.
The three major U.S. stock indices continue to hit new highs, with three hours left until the interest rate cut announcement. It is basically confirmed that there will be a 25 basis point cut. The ETF has been in an inflow state for the past three days, so we still need to pay attention to the changes in the market after the rate cut. Personally, I believe it will first decline and then rebound.
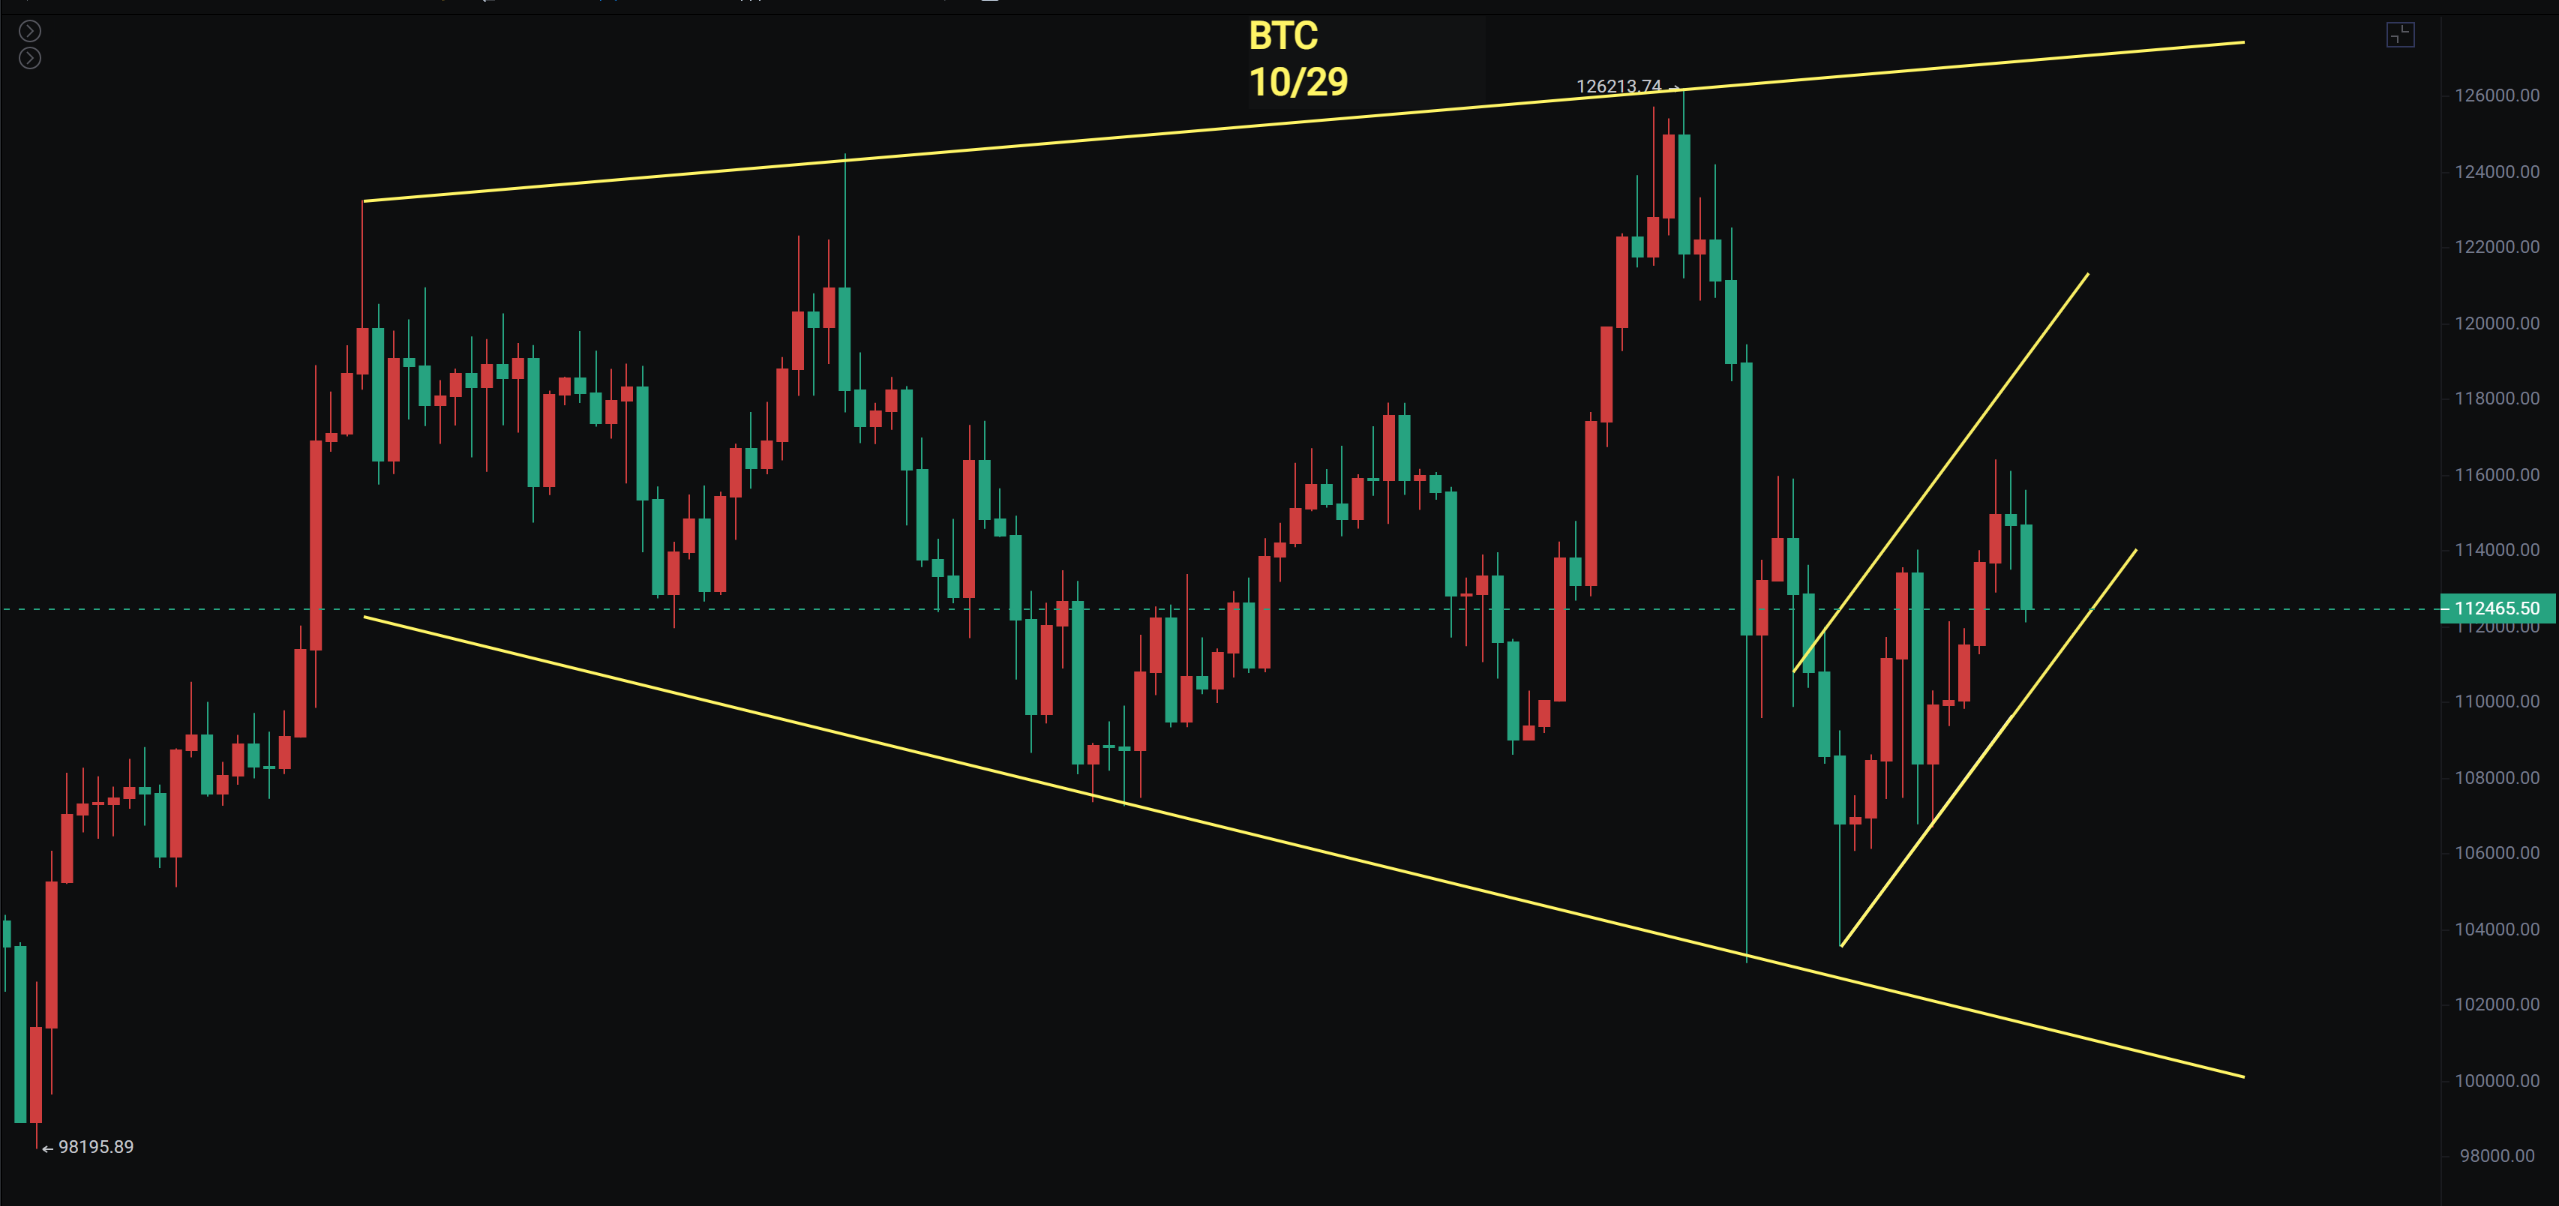
Bitcoin
Bitcoin is oscillating between the MA120 and MA200, with a rebound near the neckline of 116,000 that has not been broken. At the same time, the 4-hour chart has formed an ascending channel. The interest rate cut meets expectations, and the realization of benefits has turned into a negative. First, we will look for a pullback, and then focus on rebound opportunities and the support around MA200.
● Support: 106,000—107,000

● Resistance: 116,500—120,000
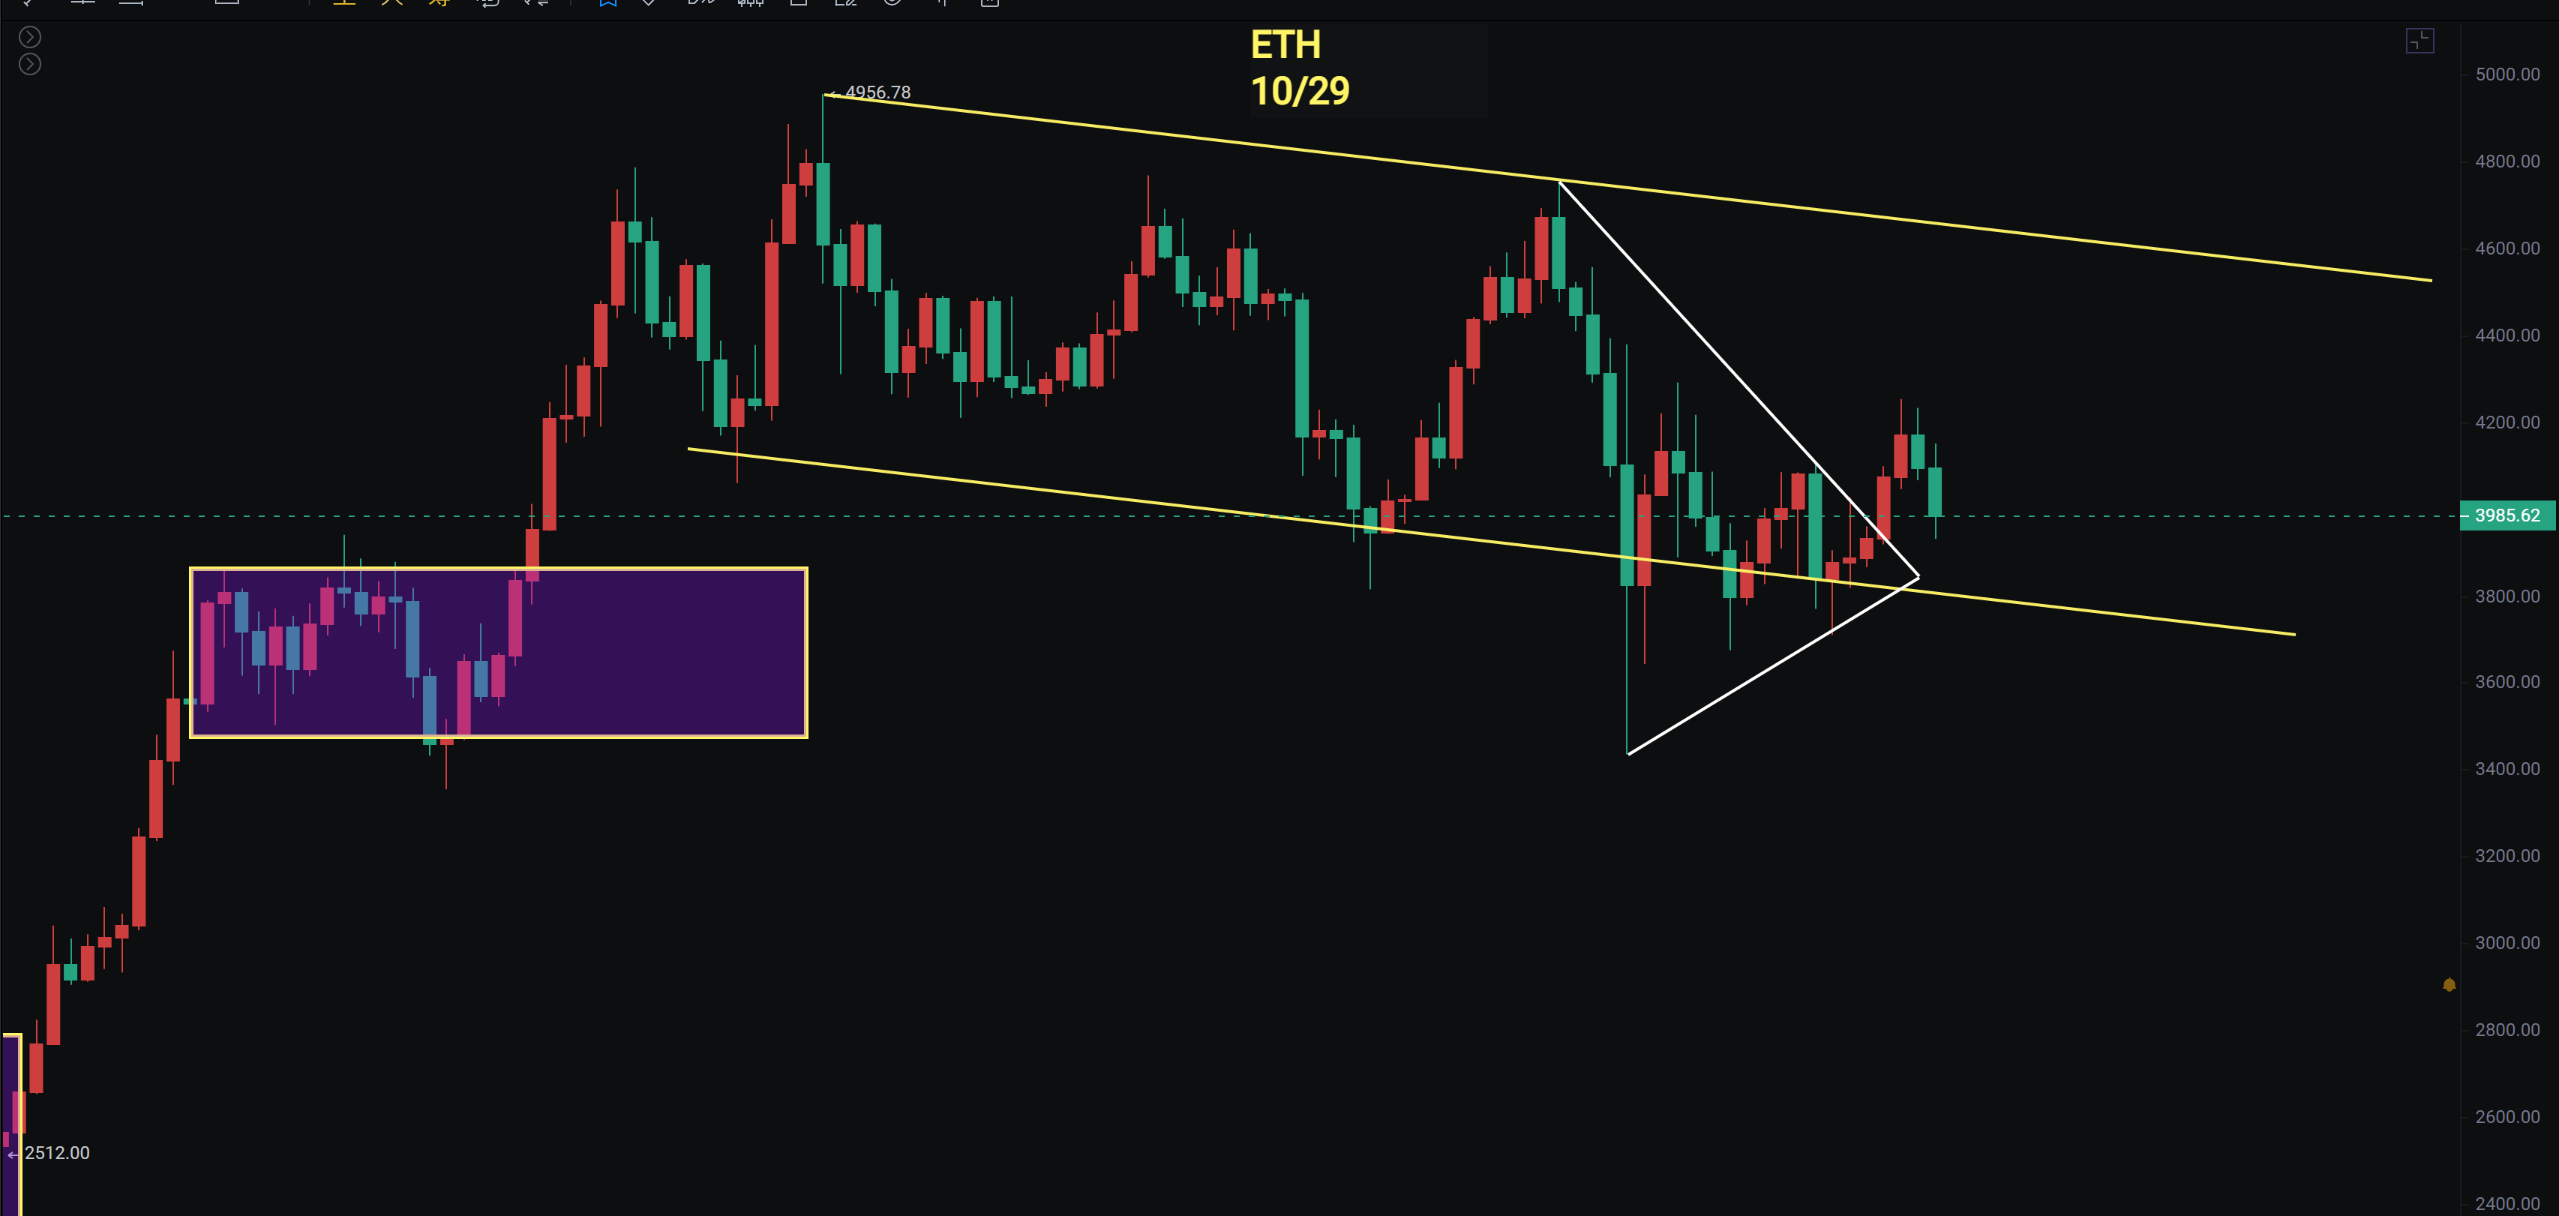
Ethereum
The Ethereum weekly line continues to close as a doji, while also oscillating near the area below the double bearish candlestick body. From the market perspective, it still appears relatively weak, with the MACD remaining underwater for three weeks.
The daily line has been oscillating around the MA120. If it cannot return above the three lines (that is, above 4,300), the risk is not eliminated. Therefore, we also need to pay attention to whether Ethereum can break through 4,300 after the interest rate cut. Since the sharp drop on the 11th, it has been oscillating for half a month and is currently at a critical stage of alternating between bulls and bears.
● Support: 3,435—3,675

● Resistance: 4,300—4,600
If you like my views, please like, comment, and share. Let's navigate through the bull and bear markets together!!!
The article is time-sensitive and for reference only, updated in real-time.
Focusing on K-line technical research, sharing global investment opportunities. Public account: BTC Trading Prince Fusu

免责声明:本文章仅代表作者个人观点,不代表本平台的立场和观点。本文章仅供信息分享,不构成对任何人的任何投资建议。用户与作者之间的任何争议,与本平台无关。如网页中刊载的文章或图片涉及侵权,请提供相关的权利证明和身份证明发送邮件到support@aicoin.com,本平台相关工作人员将会进行核查。


