师爷聊热点:
现在整个市场的焦点全都盯在周四凌晨的美联储议息会议,我也想看看老鲍这次还能玩出什么花样。大概率就是例行公事地再降息25个基点,CPI的数据已经给他留了面子。
通胀没爆,美联储也没理由硬装鹰。反正PCE要等第二天才出,他们现在只想稳,别给市场添乱。只要就业不塌、经济不闪崩,十二月再来一次降息的预期就稳得很。
现在情绪已经明显平复,只要老鲍和川子不开口瞎扯、别临场抽疯,市场的整体节奏就不会乱。包括这两天的关税一延,算是喘口气。停摆那边也是时间问题,真怕哪天又冒出点幺蛾子搞事。
回到市场,从盘面结构看112K是短线支撑。但CME那110.7K的缺口一直没补,这位置迟早要被去回补的。要是真下去了也别慌,107K、102K这两个点才是真正关键。
但万一跌破102K也不会是啥末日,震荡市里再破个新低很正常,不影响长线仍有再创新高的预期。而我更希望行情能回归月初低点、月末高点的节奏,不至于让很多人被一根针来回洗。
虽说这周宏观事件密集,FOMC是核心,但短线也会出现插针。别以为只有非农才暴力,这种关键节点,消息一出,上下齐插的概率很高。空被扫,多也未必安全。
过去两个月的走势其实已经给了参考,8月底、9月底大饼两次跌破短期持有者均价113K后都迅速拉回,这次10月11号的暴跌虽然更狠,但跌破后并没有顺势崩盘,反而缓慢爬升。
这种巨量+长针往往是多头悄悄吸筹的信号吗,也就是说,表面是恐慌,实际上底部筹码正在换手。
而现在的结构和2024年3到10月那波200天震荡极其相似。那时大饼完成了一次主升浪派发,随后陷入反复横盘,上下都不突破,逼得人心态炸裂。
现在这段行情的味道几乎一样,再没踩稳短期持有者均价113K之前,多空都还在拼。如果能重新站上113K并突破116K流动性密集区,那意味着多头拿下阶段胜利。反过来,要是116K被止损猎杀,多空切换又要重来。
再说以太,节奏同样微妙。日线级别上冲击了MA60失败后出现回落,但下面有MA120的支撑,再加上MACD在零下形成金叉,这波调整空间其实不大。
短线回调到4000附近差不多就是短期的极限,等MACD慢慢爬回零轴,行情就有望再次冲击前高4250。
换句话说,现在的以太更像在蓄力,洗掉浮筹后再走一波。只要大饼不出啥幺蛾子,以太的节奏不会坏,甚至有可能领涨。
师爷看趋势:
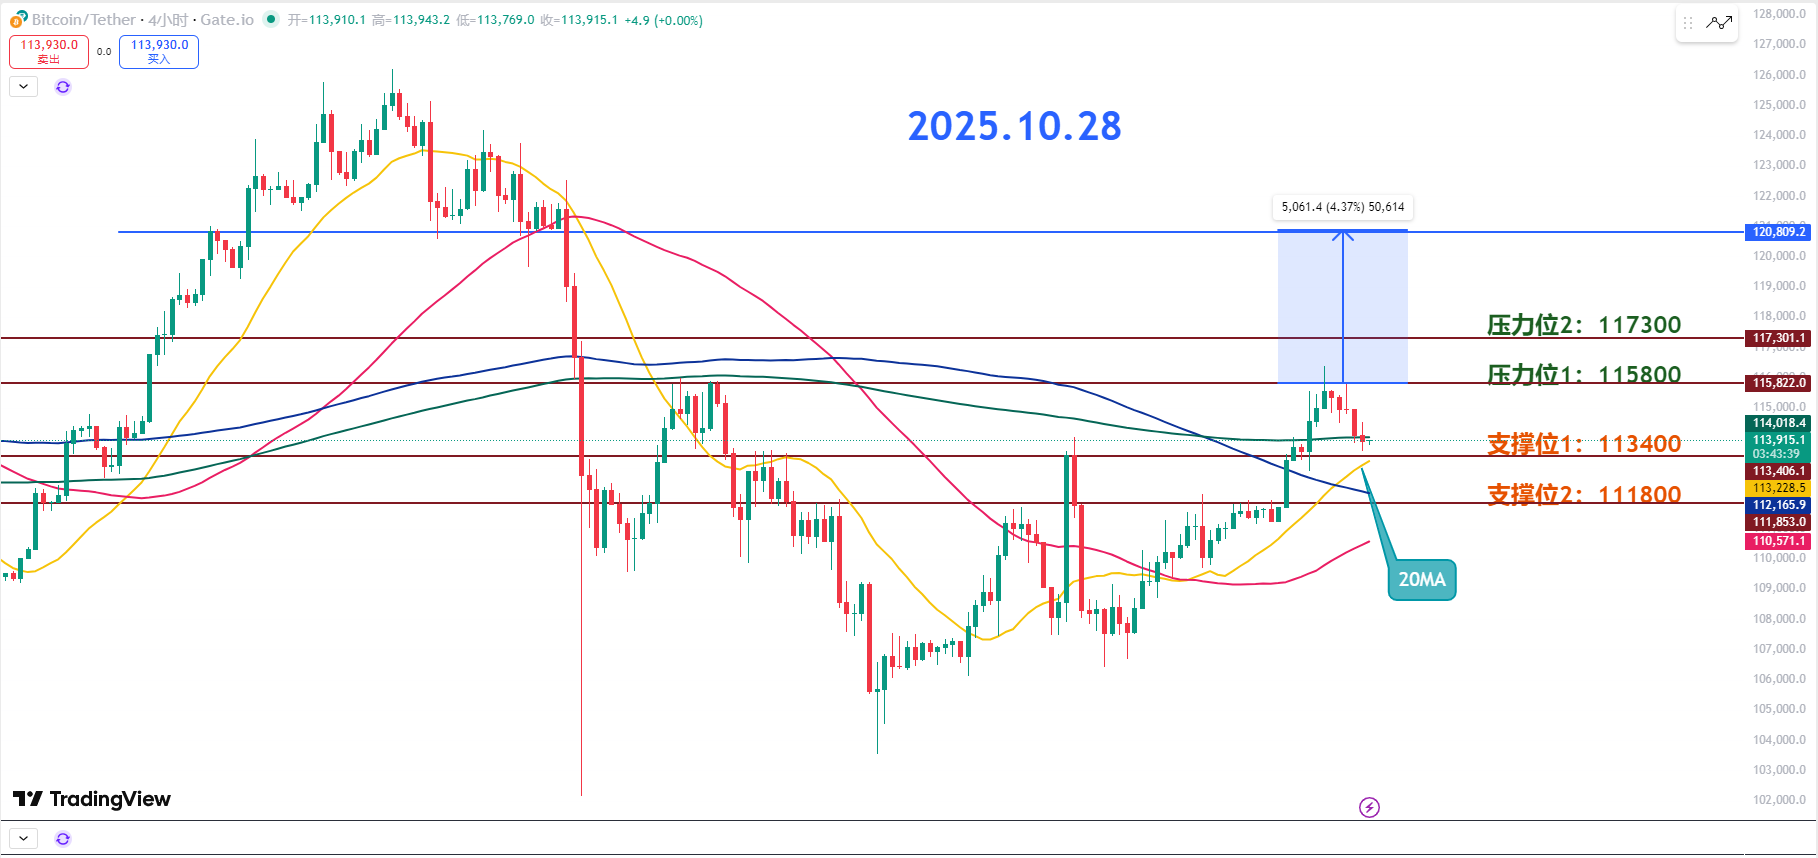
阻力位参考:
第二阻力位:117300
第一阻力位:115800
支撑位参考:
第一支撑位:113400
第二支撑位:111800
比特币目前在113.8K 附近震荡,短线还在技术性调整阶段。上方115.5K 是硬阻力,昨天冲不过去的那一下就已经说明了主力在这儿卡着不放。现在的走势属于正常回踩,但关键是能不能稳住。
目前4小时级别的200MA虽然被短暂跌破,但问题不大,只要能重新站上去,反弹的机会就还在。短线最关键的支撑在113.4K,这里同时叠着的20MA是今天的防守重心。
只要这关不破,多头就还能撑住脸面。要是连20MA都撑不住,那就意味着短期趋势要转空。RSI之前已经冲进超买区,现在这波调整纯属技术回撤。不用慌,这种下蹲反而是蓄力。
只要等RSI重新拐头向上,再加上成交量放大,行情随时可能再起一波。重点看115.5K这个位置,一旦带量突破,那上方空间就直接打开,有望拉个4.3%的涨幅。
第一阻力115.8K是前高区,关键看成交量能不能放大。RSI目前买盘在减弱,关注它什么时候重新转强,一旦RSI往上拐,冲破这个位置问题不大。
第二压力117.3K要是强势突破,那目标直指120.8K。但如果RSI在中性区横着走,那说明市场在蓄力,不跌反涨的几率反而更大。
第一支撑就是刚才提的113.4K,这个价位多头必须守。守住这里,市场就能维持反弹节奏。第二支撑111.8K也就是200MA那一带。如果113K被跌穿,这里就是下一个刹车点。
10.28师爷波段预埋:
做多入场位参考:113400附近多 113000下方补仓多 防守112400 目标:115500-115800
做空入场位参考:暂不参考
如果你真心想从一个博主那里学到东西,那就得持续关注,而不是看几次行情就妄下定论。这个市场充斥着表演型选手,今天多单截图,明天空单总结,看起来“次次抓顶抄底”,实际上全是马后炮。真正值得关注的博主,交易逻辑一定是前后一致、自洽且经得起推敲的,而不是行情动了才来跳大神。别被浮夸数据和断章截图迷了眼,长期观察、深度理解,才能分辨谁是思考者,谁是造梦人!
本文内容由师爷陈(公众号:币神师爷陈)独家策划发布,师爷陈全网同名。如需了解更多实时投资策略、解套、现货,短、中、长线合约交易手法、操作技巧以及K线等知识可以加到师爷陈学习交流,现已开通粉丝免费体验群,社区直播等优质体验项目!

温馨提示:本文只有专栏公众号(上图)是师爷陈所写,文章末尾及评论区其他广.告均与笔者本人无关!!请大家谨慎辨别真假,感谢阅读。
免责声明:本文章仅代表作者个人观点,不代表本平台的立场和观点。本文章仅供信息分享,不构成对任何人的任何投资建议。用户与作者之间的任何争议,与本平台无关。如网页中刊载的文章或图片涉及侵权,请提供相关的权利证明和身份证明发送邮件到support@aicoin.com,本平台相关工作人员将会进行核查。


