Authors: Chris Beamish, CryptoVizArt, Antoine Colpaert, Glassnode
Compiled by: KellyFund Private Board
Abstract
The trading price of Bitcoin is below the cost basis of short-term holders and its 0.85 percentile level, indicating that momentum is weakening and market fatigue is increasing. The price has repeatedly failed to recover this threshold, suggesting that the market may require a longer consolidation period.
Long-term holders have accelerated their selling pace since July, with the current average daily sell-off exceeding 22,000 Bitcoins. The ongoing sell-off is continuously increasing downward pressure on the market.
Open interest in contracts has reached a new high. Market sentiment is leaning bearish, with traders more inclined to purchase put options. Short-term price rebounds are more due to hedging operations rather than optimistic sentiment.
Implied volatility remains high, while actual volatility has begun to rise sharply. The previously calm, low-volatility phase has ended.
Currently, the market is in a transitional phase. The key to its recovery may lie in the resurgence of spot demand and a slowdown in market volatility.
Bitcoin prices continue to decline, currently stabilizing below the short-term holder cost basis of approximately $113,100. Historically, this structure typically signals a mid-term bearish phase, as weaker-willed investors have begun to capitulate and cut losses.
Testing Confidence
Currently, the vast majority of trading prices are near the short-term holder cost basis, representing the market's repeated testing of the holding confidence of those who bought at recent highs. Historically, if the price falls below this level after reaching a new high, it usually results in over 15% of the supply being in a loss state.
In this cycle, we have seen this situation for the third time. If Bitcoin cannot regain the price level of approximately $113,100, more market supply will enter the loss zone. This will increase pressure on recent buyers and may lead to a broader capitulation in the market.
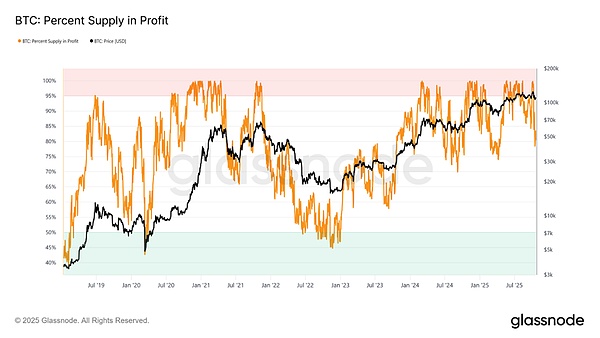
Figure 1: Proportion of Market Supply in Profit
Price Thresholds
When predicting price thresholds, the supply percentile cost basis model provides us with a clear framework. We mark the 0.95, 0.85, and 0.75 percentiles to reflect Bitcoin prices when 5%, 15%, and 25% of the supply is in a loss state, respectively.
Currently, although Bitcoin's trading price is below the short-term holder cost basis ($113,100), it is still struggling to maintain above the 0.85 percentile ($108,600). Historically, once this price threshold is breached, it indicates a structural weakening of the market and often leads to a deeper adjustment towards the 0.75 percentile (around $97,500).
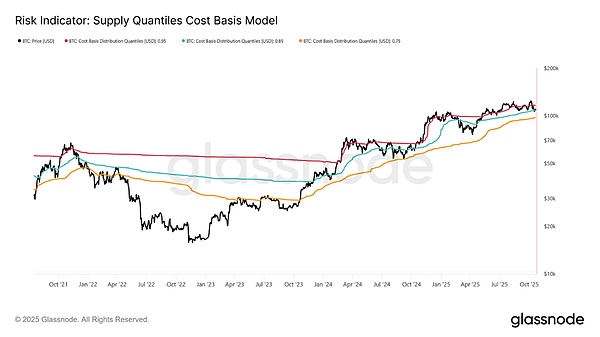
Figure 2: Risk Indicators - Supply Percentile Cost Basis Model
Market Demand Exhaustion
In this cycle, as the price of Bitcoin has fallen below the short-term holder cost basis's 0.85 percentile level for the third time, investors have begun to worry about the possibility of structural weakness in the market. Demand exhaustion has repeatedly occurred, indicating from a macro perspective that the market may require a longer consolidation period to rebuild momentum.
If we measure the market's fatigue by the selling volume of long-term holders, it is evident. Since the market peaked in July 2025, long-term holders have continuously sold Bitcoin, with the 30-day average daily sell-off increasing from 10,000 Bitcoins to at least 22,000 Bitcoins per day. Experienced investors are choosing to cash out on a large scale at this time, and this selling pressure is one of the core factors leading to the current market fragility.
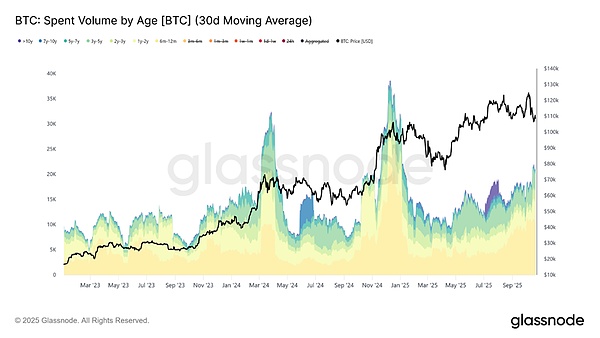
Figure 3: Average Daily Sell-off of Bitcoin (30-Day Moving Average)
Open Interest Soars
The open interest in Bitcoin options has reached a historical high and continues to increase, marking a structural evolution in market behavior. Investors are increasingly using options for risk hedging or volatility speculation rather than directly selling spot. While this somewhat reduces selling pressure in the spot market, such hedging trades have significantly increased market volatility in the short term.
At the same time, the expansion of open interest has also led to options positions playing a key role in the short-term fluctuations of the market.
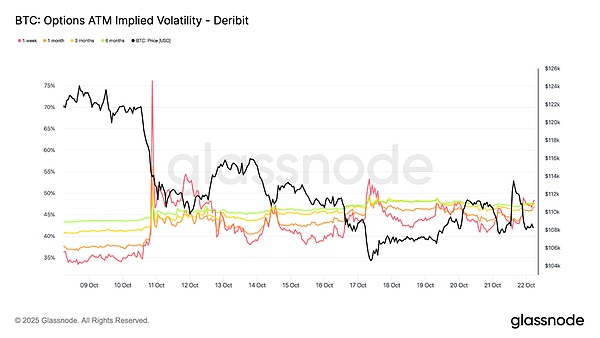
Figure 4: Implied Volatility of At-the-Money Options
Bearish Option Skew Rising
In the past two weeks, the skew of put options has continued to rise, indicating that put options remain more dominant in the market.
In the past week, the 1-week skew indicator has fluctuated significantly and remains in a high uncertainty zone; while the skew for other time periods has further moved towards bearish.
This indicates that during the current downward movement of the price, investors tend to spend more on hedging risks. However, they maintain limited upside exposure, suggesting that while they are fearful in the short term, they still have confidence in Bitcoin in the long run.
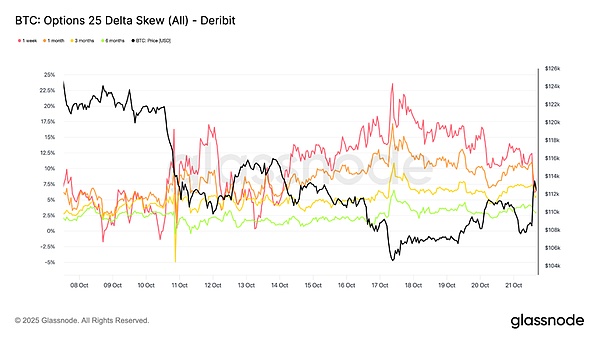
Figure 5: 25-Delta Skew of Options
Risk Premium Reversal
Recently, the monthly volatility risk premium—the difference between implied volatility and actual volatility—has turned negative. In recent months, implied volatility has remained high while actual volatility has remained low, allowing traders who short volatility to profit through stable "carry trades."
However, now, actual volatility is rising sharply and catching up with implied volatility. This marks the end of the "calm period": volatility sellers can no longer rely on this "carry trade" to make easy profits but are forced to take proactive measures in a more volatile environment. The market has moved away from the previous stable period and entered a new phase of increased volatility.
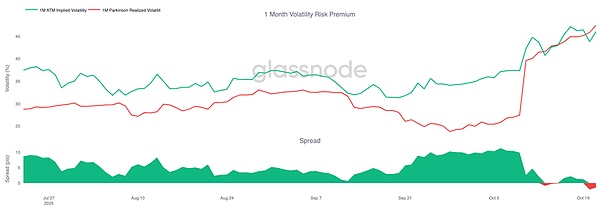
Figure 6: Monthly Risk Premium Volatility
Funds Still Defensive
In the past 24 hours, although the price of Bitcoin rose from $107,500 to $113,900, call options seem to still be neglected. Instead, traders have increased their positions in put options, indicating that they are still continuing to hedge against downside risks.
This behavior leads investors to choose to continue selling regardless of price movements. As long as this pattern remains unchanged, the unfavorable situation in the market will not improve.
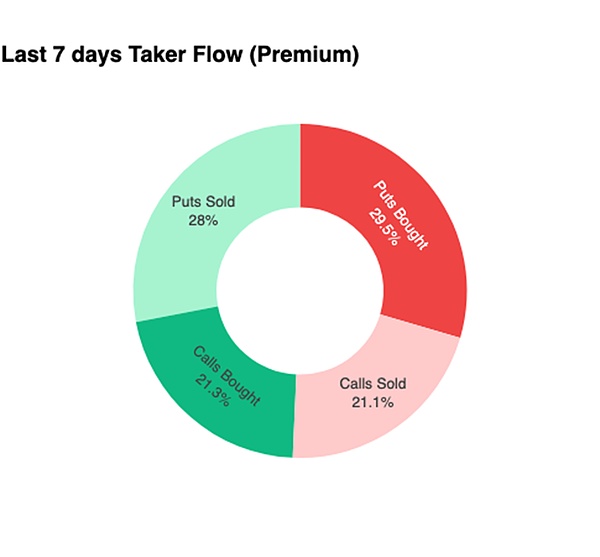
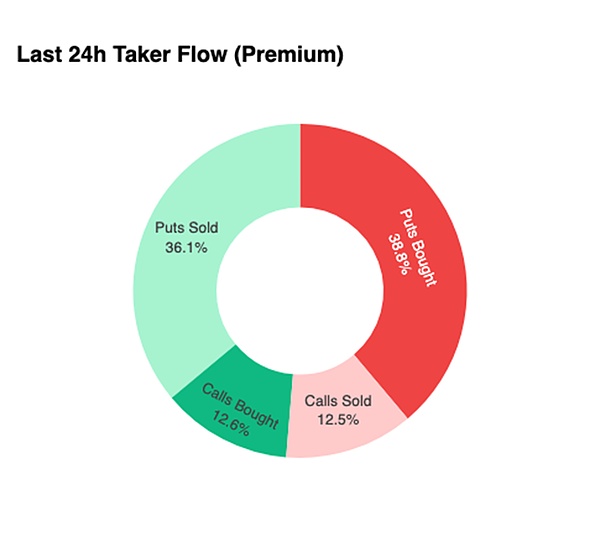
Figure 7: Fund Flows Over 7 Days and 24 Hours
Market from Strategy Premium Perspective
Currently, for the $120,000 call options, we observe that traders' behavior is also hindering the price from continuing to rise: they choose to sell aggressively during brief rebounds. They are taking advantage of the spike in implied volatility to sell call options during the rebound rather than chasing the rise in spot prices.
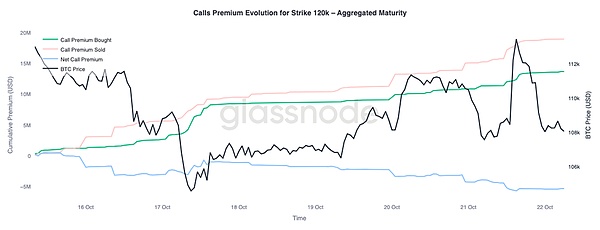
Figure 8: Trend of Premium Changes for $120,000 Call Options
In contrast, for the $105,000 put options, the performance of this premium is exactly the opposite—as the price rises, the premium of put options also increases. This indicates that traders are continuing to prepare for potential downside risks in the price. It also suggests that the recent rebound is more due to investors' hedging operations rather than firm bullish confidence.
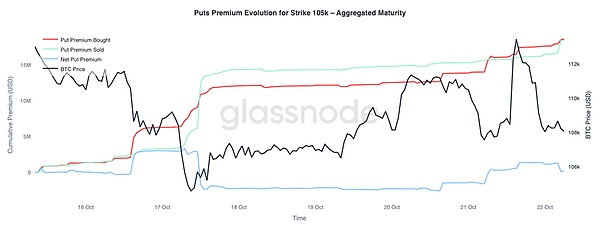
Figure 9
Conclusion
Recently, the price of Bitcoin has fallen below the 0.85 percentile of the short-term holder cost basis ($108,600), indicating that market demand has gradually exhausted. Bitcoin may face a longer consolidation phase to rebuild market confidence and digest the current significant selling pressure.
At the same time, although the number of open contracts has reached a new high, they are mostly defensive positions. This indicates that the recent short-term rebound is due to investors using hedging operations to cope with downside risks rather than optimistic chasing of prices.
免责声明:本文章仅代表作者个人观点,不代表本平台的立场和观点。本文章仅供信息分享,不构成对任何人的任何投资建议。用户与作者之间的任何争议,与本平台无关。如网页中刊载的文章或图片涉及侵权,请提供相关的权利证明和身份证明发送邮件到support@aicoin.com,本平台相关工作人员将会进行核查。


