受惠于美国总统川普赦免BN创办人赵长鹏,美股、加密货币同步上扬,市场氛围今日全面回暖,带动比特币重新站上110000美元关卡。
今日整体加密市场再度转强,截止撰稿时间比特币报价为111235美元,近24小时涨幅约2.22%。除了比特币以外,以太坊也强势上涨3.6%至3976美元,而受赵长鹏获赦免的利多消息激励,BNB则上涨5.2%至1141美元。
接下来,市场焦点转向即将在今晚公布的美国9月消费者物价指数。尽管美国政府部分部门仍处于关门状态,但劳工统计局预定照常发布该公告,这很可能是联准会在下周召开利率决议前,能看到、最后看到、也是最重要的一份数据报告。
目前市场已经完全押注联准会在本次会议中再次降息25个基点,并于12月份的年度最终会议上再降息一次,CPI数据的结果,将重新锚定市场对美国经济的看法。如果CPI数据温和,将会支持比特币反弹动能,如果数据过热,那么将可能加速市场去风险化的浪潮。
比特币四小时图
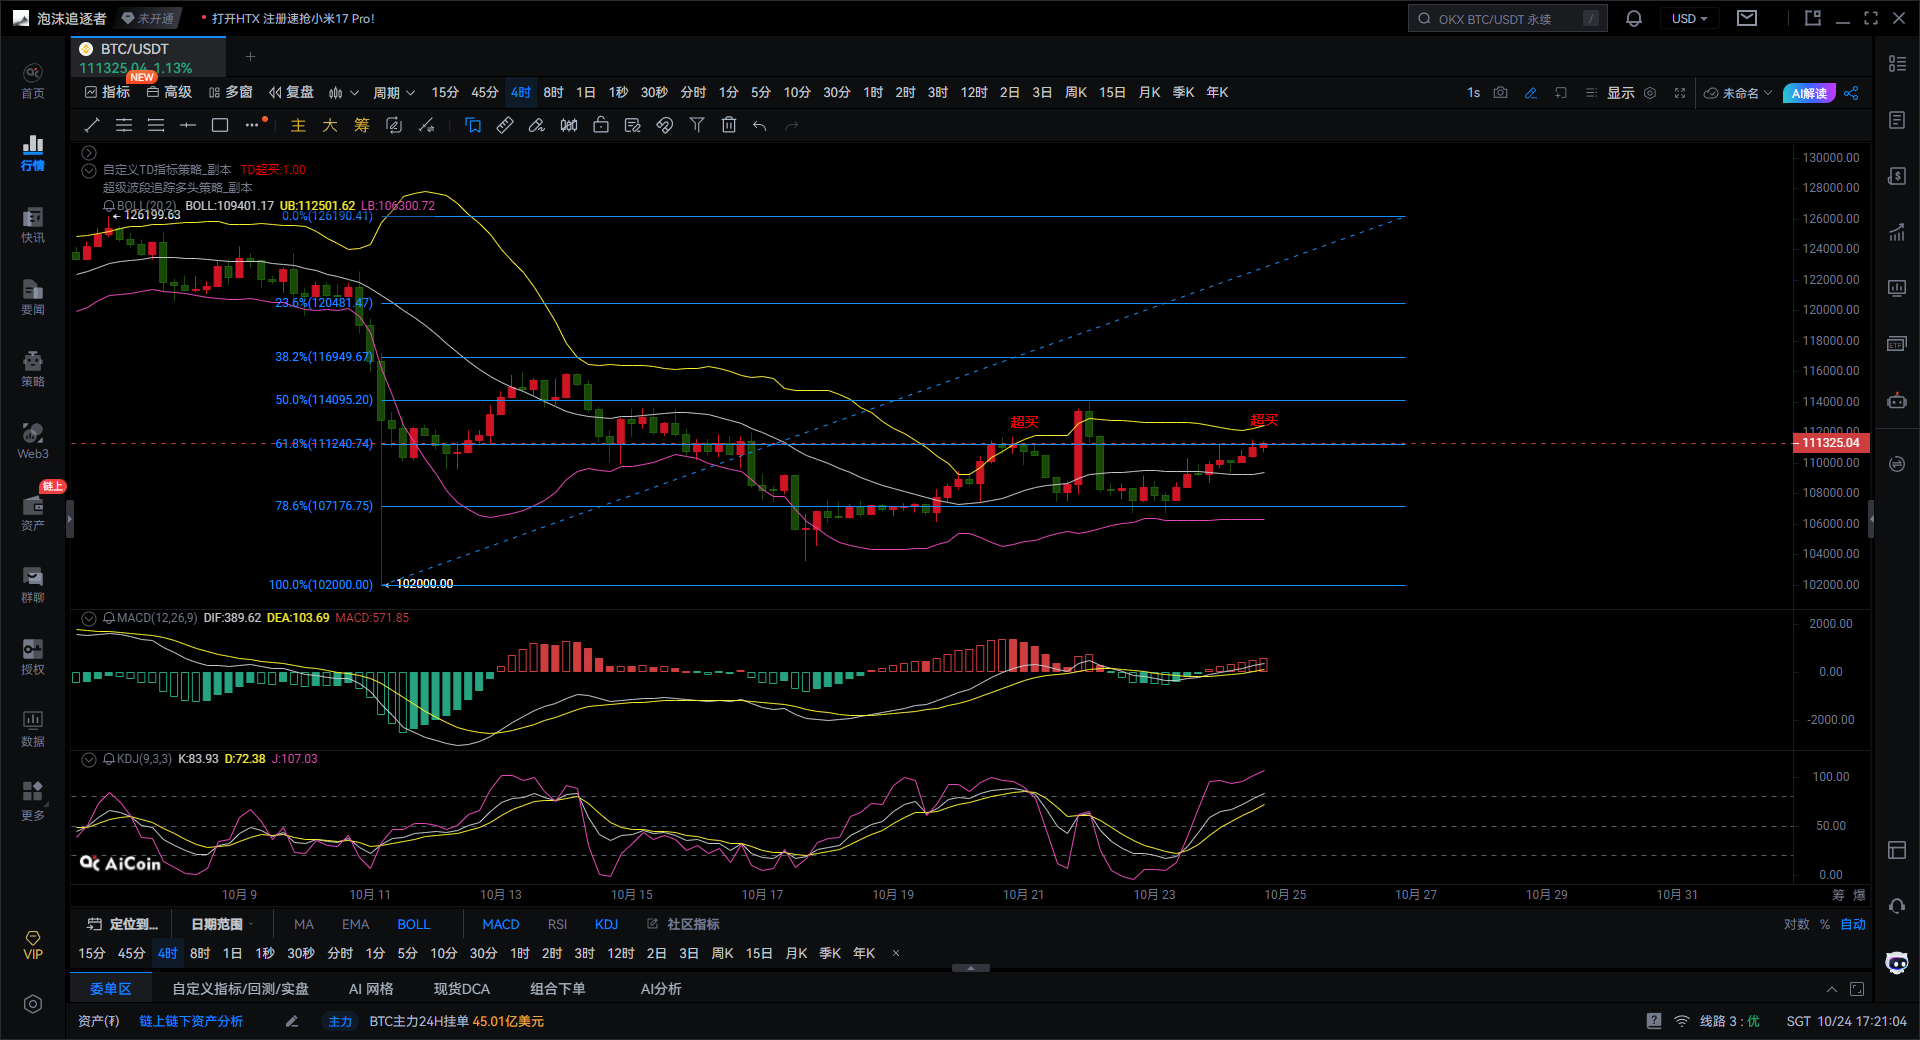
当前市场走势显示布林带中轨位于110500附近,价格已重新站上中轨,并在上轨111800附近遭遇阻力。布林带形态呈现略微收口状态,说明短期行情正从单边下跌逐步转向震荡反弹阶段。如果价格能有效突破上轨并站稳112000上方,布林带可能张口形成新的上行趋势,目标指向116950的斐波那契38.2%回调位。反之,如果价格在上轨附近承压回落,短线可能重新测试110000的中轨支撑,甚至下探107000的下轨支撑。总体来看,市场正处于多头试图反攻的关键节点,但尚未完全脱离震荡格局。
从MACD指标来看,DIF线已上穿DEA线形成小幅金叉,MACD红色柱状图开始放量,但动能仍显不足。这说明短线反弹力量正在增强,但尚未形成趋势性上涨。如果MACD红色柱状图持续扩张,买盘力量有望延续,价格可能进一步上探114000-116000区域。反之,如果MACD红色柱状图缩短并配合两线形成死叉,则反弹动能不足,价格可能回落至空头区域。目前MACD信号处于反弹初期,多空博弈仍在持续,关键看后续两根K线能否维持金叉结构。
KDJ指标显示三线运行于高位区域,K值为83,D值为72,J值已达107进入超买区间。这说明短线行情已出现技术性超买,存在回调风险。如果K线与D线形成向下交叉,可能构成顶背离信号,价格可能回落至111200附近的斐波那契61.8%回调位。如果KDJ持续高位钝化且MACD红色柱状图放量,则可能引发强势突破,目标上看116950甚至126000的前高。
价格当前正处于斐波那契61.8%回撤位附近震荡,这是技术分析中的关键转折区域。如果能有效突破并站稳111500上方,则表明回调结束、趋势转多。如果多次受阻并跌破中轨,则可能重新测试107000支撑,甚至下探102000的底部支撑。因此,111200附近成为决定后续趋势方向的关键点位,需要密切关注该位置的突破情况。
综合分析,当前比特币4小时图整体结构显示出一种“震荡筑底、偏强反弹”的状态。技术指标表明市场情绪逐步由恐慌转为试探性做多,但尚未突破关键转折点。未来1-2日如果能站稳在布林中轨及斐波那契61.8%上方,行情有望延续反弹走强;反之如果KDJ死叉与MACD回落共振,将重回震荡下行通道。整体判断:短线偏多,中期仍需确认突破,当前为震荡区间的临界阶段。
综上所述大仙给出以下建议供参考。
1、比特币价格稳于111500上方,可顺势看多,上看114000-116900;防守109800。
2、比特币反弹至上轨附近受阻并KDJ形成死叉形态,可在112000-112500区间尝试短空,目标110000-107500。
给你一个百分百准的建议,不如给你一个正确的思路与趋势,授人与鱼不如授人与渔,建议赚一时,思路学会赚一生!
撰稿时间:(2025-10-2,17:20)

(文-大仙说币)特此申明:网络发布具有延迟,以上建议仅供参考。投资有风险,入市需谨慎!
免责声明:本文章仅代表作者个人观点,不代表本平台的立场和观点。本文章仅供信息分享,不构成对任何人的任何投资建议。用户与作者之间的任何争议,与本平台无关。如网页中刊载的文章或图片涉及侵权,请提供相关的权利证明和身份证明发送邮件到support@aicoin.com,本平台相关工作人员将会进行核查。


