币圈丽盈:10.23比特币最新行情分析
文章发布时间2025.10.23------00点10分
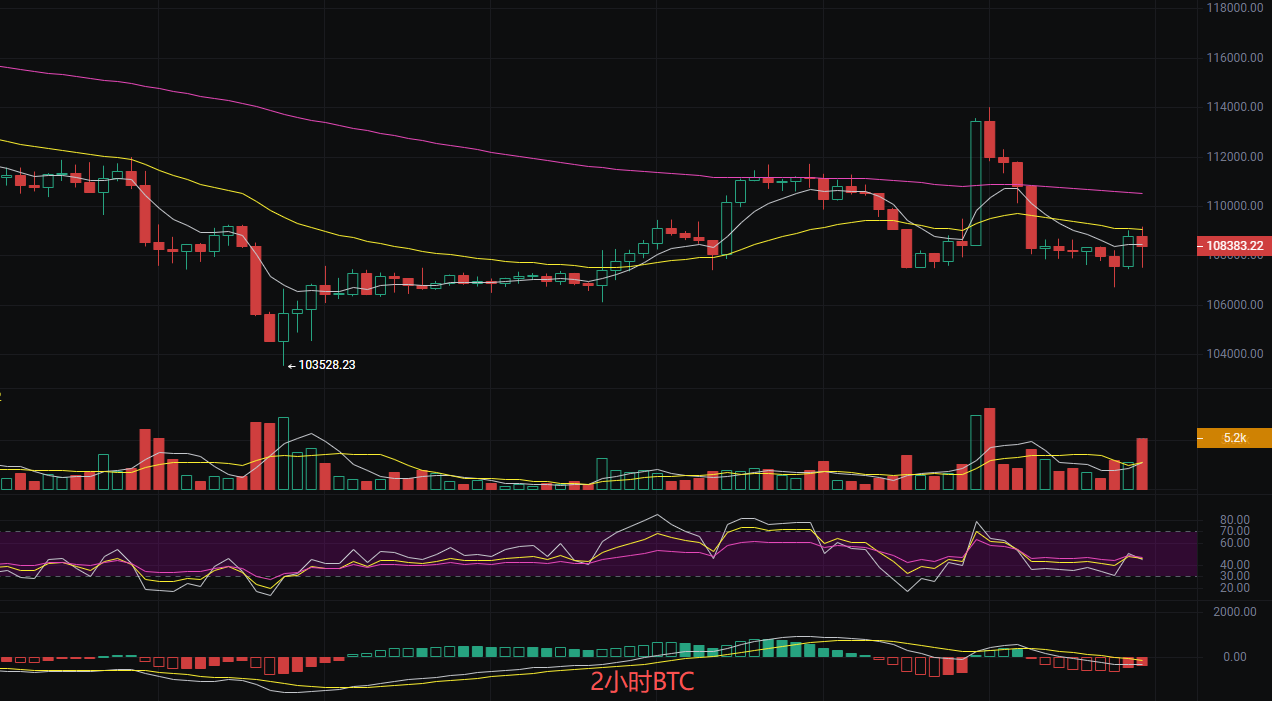
比特币现价108370,丽盈判断大饼当前在关键支撑位102000和阻力位112753之间反复波动,短期内缺乏明确的趋势方向。技术面显示均线系统纠缠,动能减弱,同时K线形态出现看跌吞没信号,暗示市场可能面临一定的下行压力,日线高位抛压较重但整体仍处于震荡调整阶段。2小时K线连续多根小阴线后伴随放量,短期存在一定的卖压。MACD2小时空头力量占优日线趋势偏弱。EMA2小时短期压力明显日线长期趋势偏空,整体趋势上可以看见大饼冲高以后遇到很强的阻力被打下来了,所以丽盈逢高做空为主,低多为辅
短线思路参考:
做多点106000,防守105500,止损500点,目标110000
做空点110000,防守110500,止损500点,目标108000
以太坊最新行情分析
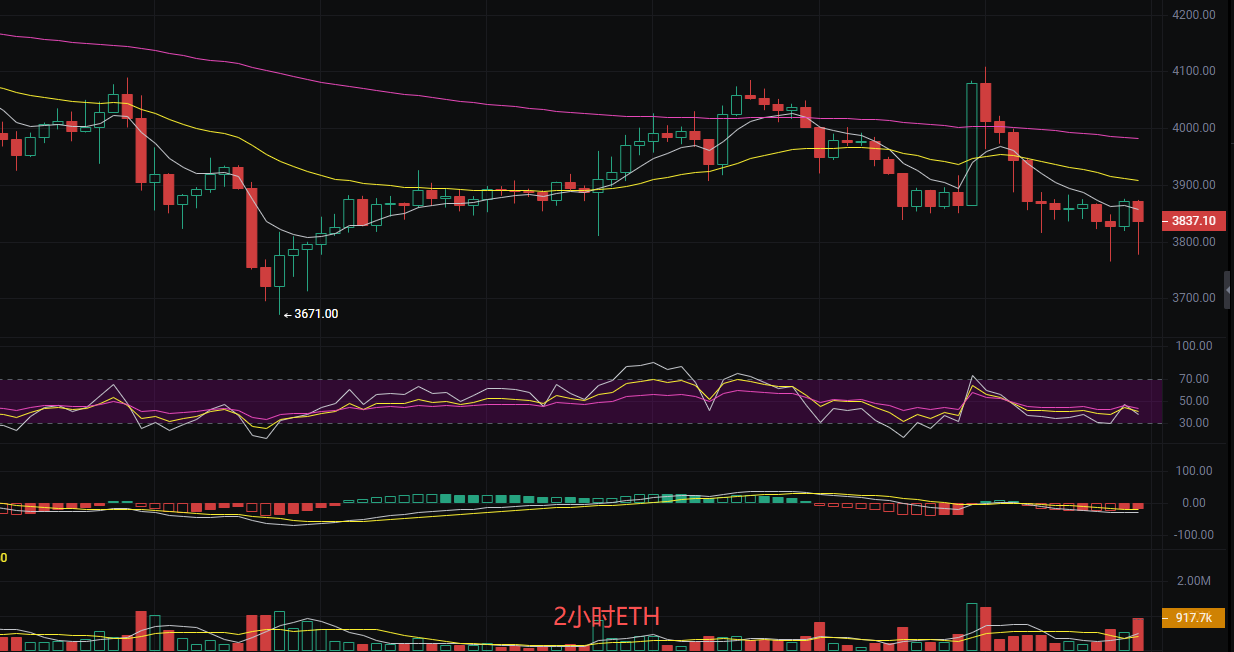
发稿前以太坊现价3837,丽盈观察目前盘口以太坊下跌趋势空头占据主导地位。近期K线形成看跌吞没形态,结合均线系统的空头排列,进一步确认了市场的下行压力。价格接近关键支撑位3671,若该支撑失守,可能引发更深的下跌,日线处于震荡下行趋势且高点逐步降低。2小时形成多个小幅反弹后回落的形态,整体呈现弱势调整。MACD2小时动能偏空。EMA短期、中期、长期均线均对价格构成压力,由此可见上方有连续压力,所以趋势上可以在上方寻找压力位以后空为主,短线多丽盈不建议持有时间太久,安全第一
短线点位参考:
做空点3920,防守3960,止损50点,目标3800
做多点3730,防守3680,止损50点,目标3850
以上内容由丽盈独家原创,转载请注明出处!文章发布审核有延时性,行情瞬息万变,以上建议仅供参考风险自担。希望丽盈的出现会对你有所帮助!

文章内容具有实时性,仅供参考,风险自担
免责声明:本文章仅代表作者个人观点,不代表本平台的立场和观点。本文章仅供信息分享,不构成对任何人的任何投资建议。用户与作者之间的任何争议,与本平台无关。如网页中刊载的文章或图片涉及侵权,请提供相关的权利证明和身份证明发送邮件到support@aicoin.com,本平台相关工作人员将会进行核查。


