Author: ltrd
Translation: Ding Dong (@XiaMiPP)
Every market cycle has its "day that changes everything." October 10th was such a day. In just a few hours, the crypto market collapsed in a "slow-motion crash"—leverage was liquidated, collateral evaporated rapidly, and liquidity dried up instantly. But this was not a panic-driven crash; it was a mechanical, precise collapse—reminding us: the system's failure is not due to its fragility, but because it operates as usual under extreme conditions. This article attempts to reconstruct what truly happened that day through data—discarding headline hype and emotional outbursts to strike at the core of the facts.
October 10th is destined to be recorded in history. By almost all metrics, this was the most severe flash crash in the history of the crypto market. A perfect storm swept in: portfolio margin liquidations, ADL (automatic deleveraging), potential liquidations of several giants, and a plummet in collateral value—all these factors together triggered the most serious single-day drop in the crypto space.
Let's start with a quick overview—just how severe was this crash?
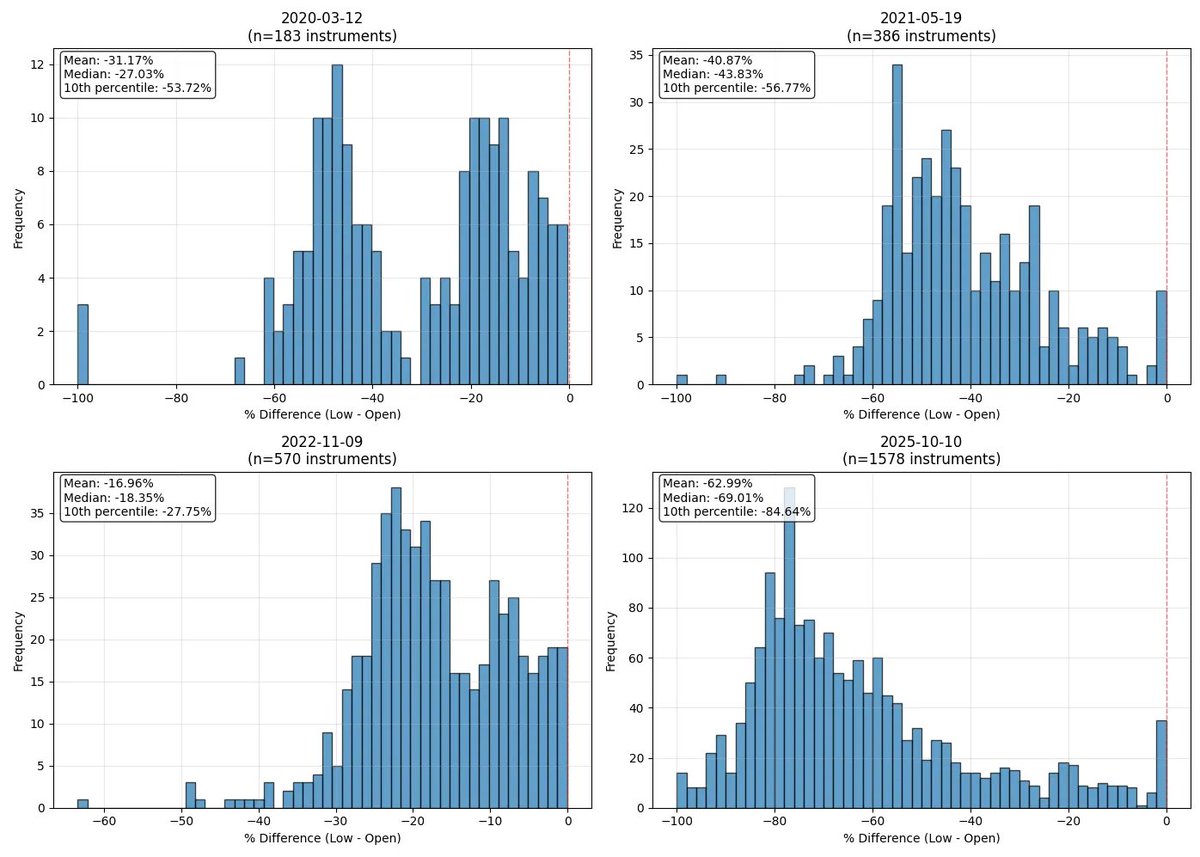
I selected the four craziest trading days in crypto history (of course, there were many chaotic days in the early years, but this article focuses on the "modern crypto era"). I conducted the same analysis on these days. The conclusion is—October 10th was the most intense sell-off I have ever witnessed.
From the chart, we can see that the average drop that day (calculated from the opening price to the day's lowest price) reached 63%; the second-ranked "crazy day" (May 19, 2021) was only about 41%. Approximately 200 cryptocurrencies on Binance dropped more than 80%, equivalent to the total number of coins listed on the exchange during the COVID crash in 2020.
As is customary, we start with an overall overview and then delve into the market microstructure—the real understanding lies in the details. We will begin with the most basic indicators: open interest and macro overview, gradually peeling back the layers of complex mechanisms.
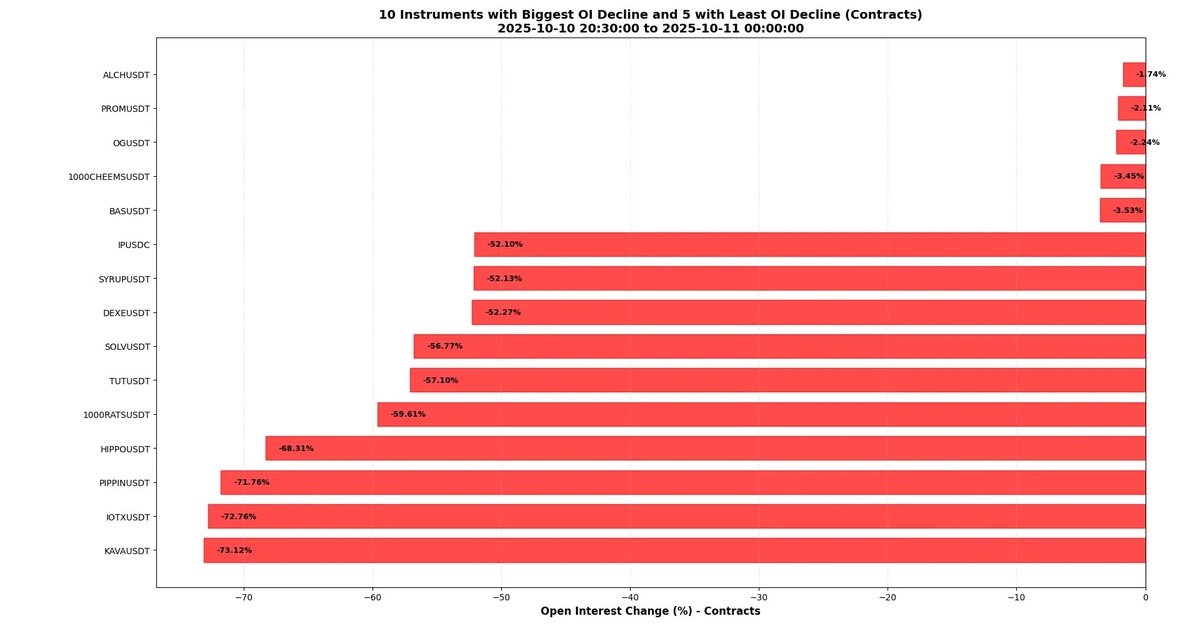
This drop nearly completely destroyed the market structure. From the chart below, we can see that the open interest of Binance perpetual contracts averaged a decline of nearly 50%. More than 50 trading pairs saw open interest drop over 64%. This means that during the crash, more than half of the contracts were closed—whether through liquidation, ADL, or manual closing. Open interest can be roughly understood as market size, so we can say: the market shrank by about 50% on that day.
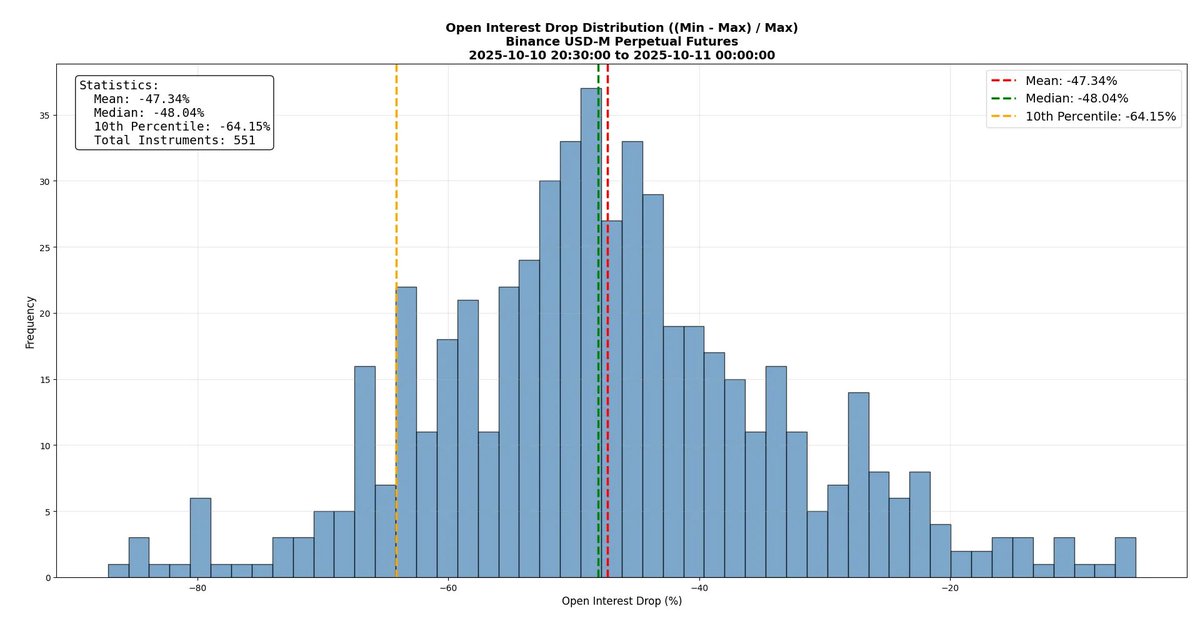
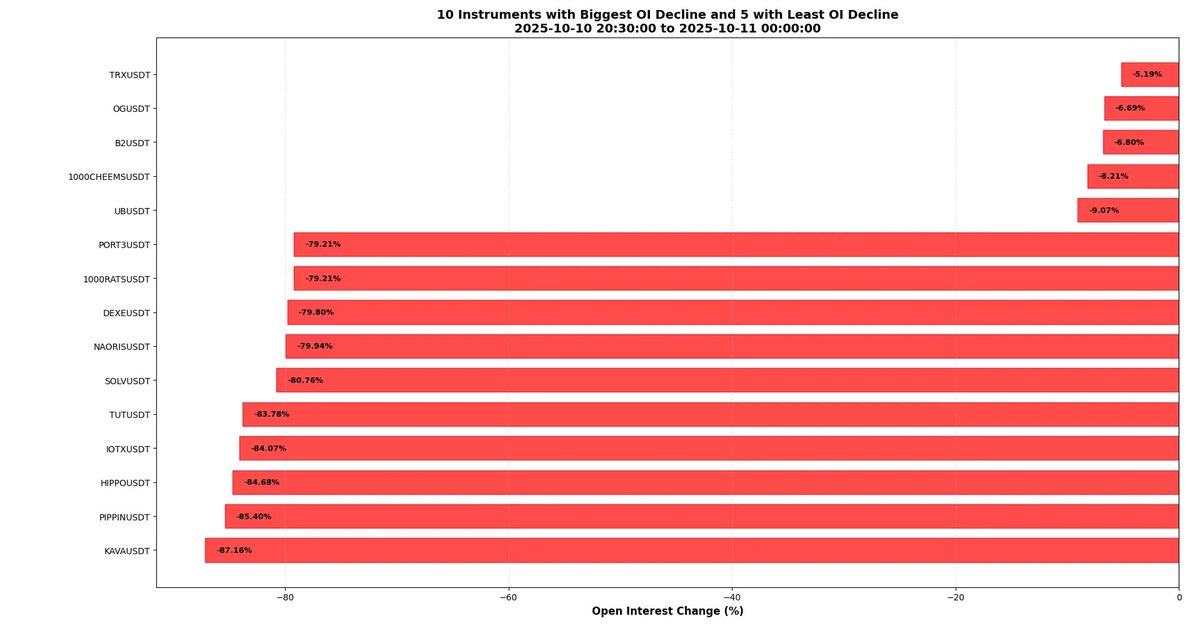
Some trading pairs even saw open interest decrease by 80%. In other words, less than one-fifth of the contracts "survived"—this number is astonishingly extreme by any standard. The table below lists extreme cases: KAVA "tops" the shame list with nearly 90% of its open interest collapsing, while TRX barely moved, only dropping about 5%. This clearly reflects the high leverage state of parts of the market and the brutality of the deleveraging process.
Perhaps it is unwise to deliberately make mistakes in an attempt to attract the attention of smart people—but I did so. I hope you noticed:
The reason the above numbers seem enormous is that they are denominated in USD—and in the context of a price crash, this measurement method has an inherent bias. When prices plummet, open interest calculated in USD will naturally appear worse than it actually is. What truly matters is the open interest measured in "contract quantity," not in USD value. I have seen some analyses claim that open interest dropped by about 50%, but if these numbers are in USD and the corresponding coin prices have also plummeted, then this conclusion is actually inaccurate.
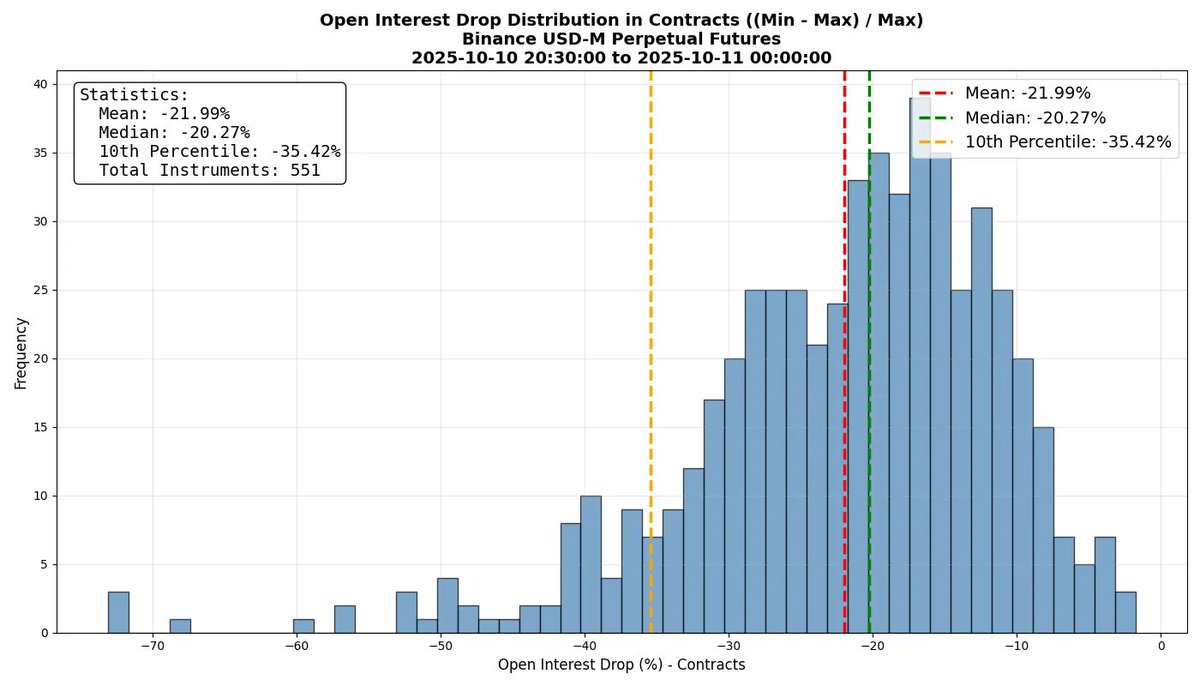
Let's look at more precise data: the average drop in contract quantity was about 22% (still an astronomical number, but not as sensational). Data interpretation requires caution—many, including myself, often try to shock readers with numbers when presenting conclusions, sometimes inevitably playing a little trick.
Even so, the data for individual coins remains shocking: the contract quantity for certain tokens decreased by over 70%, and combined with the price drop, the USD value of open interest plummeted by about 90%. I am not sure why, but I was slightly surprised to see KAVA and IOTX on the list. I had expected it to be coins like PIPPIN or HIPPO, where traders (by definition) usually prefer higher leverage than more mature coins.
Market Microstructure
Now let's focus on the market microstructure. I will provide examples for analysis, hoping to offer a clearer trajectory of the market's actual operation and new insights. Although there have been many excellent analytical articles discussing this crash, very few have delved into the microstructural level for interpretation.
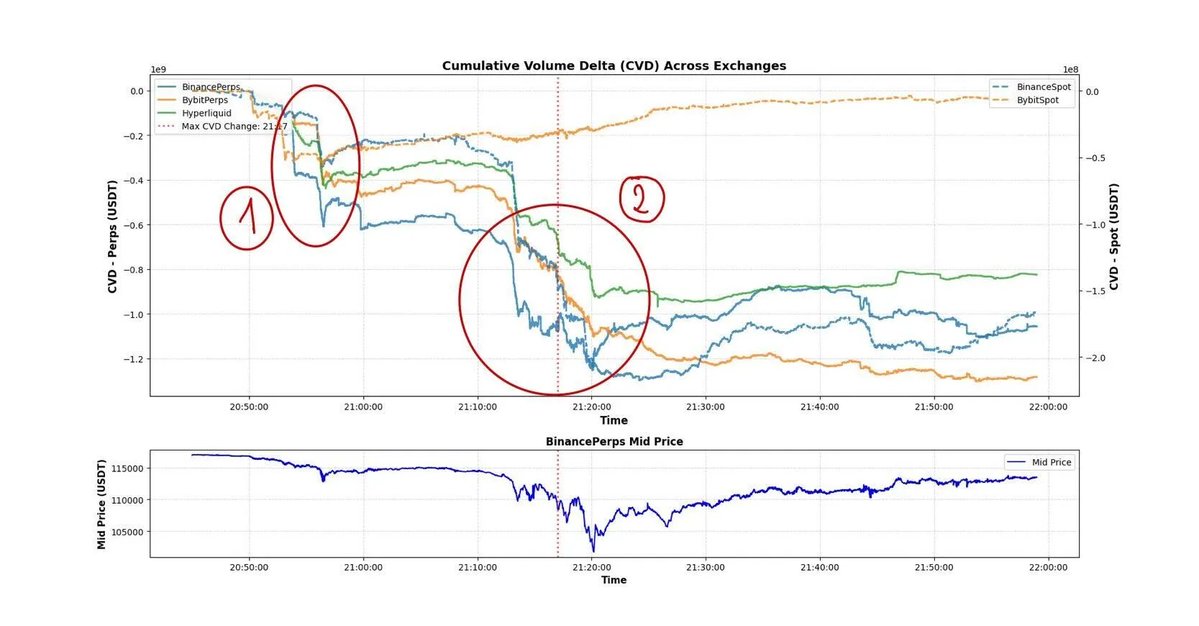
Of course, let's start with BTC. The chart below shows the CVD (Cumulative Volume Delta) from multiple trading platforms—the difference between active buying and active selling over a period (measured in USDT). For example, -1 e 9 indicates that active selling exceeded active buying by 1 billion USD. However, it is important to note that this is only a rough approximation of market-side pressure. In the crypto market, where the "minimum tick size" is extremely small, the proportion of executable limit orders is much higher than in other asset markets, so the accuracy of CVD is lower. (For thought: why is this so?).
From the chart, we can see that CVD indeed shows strong selling pressure. Interestingly, the CVD drop in situations 1 and 2 is similar, yet the prices are worlds apart. This is mainly because situation 2 has extremely low liquidity—therefore, even with the same selling pressure, the price reaction is more severe.
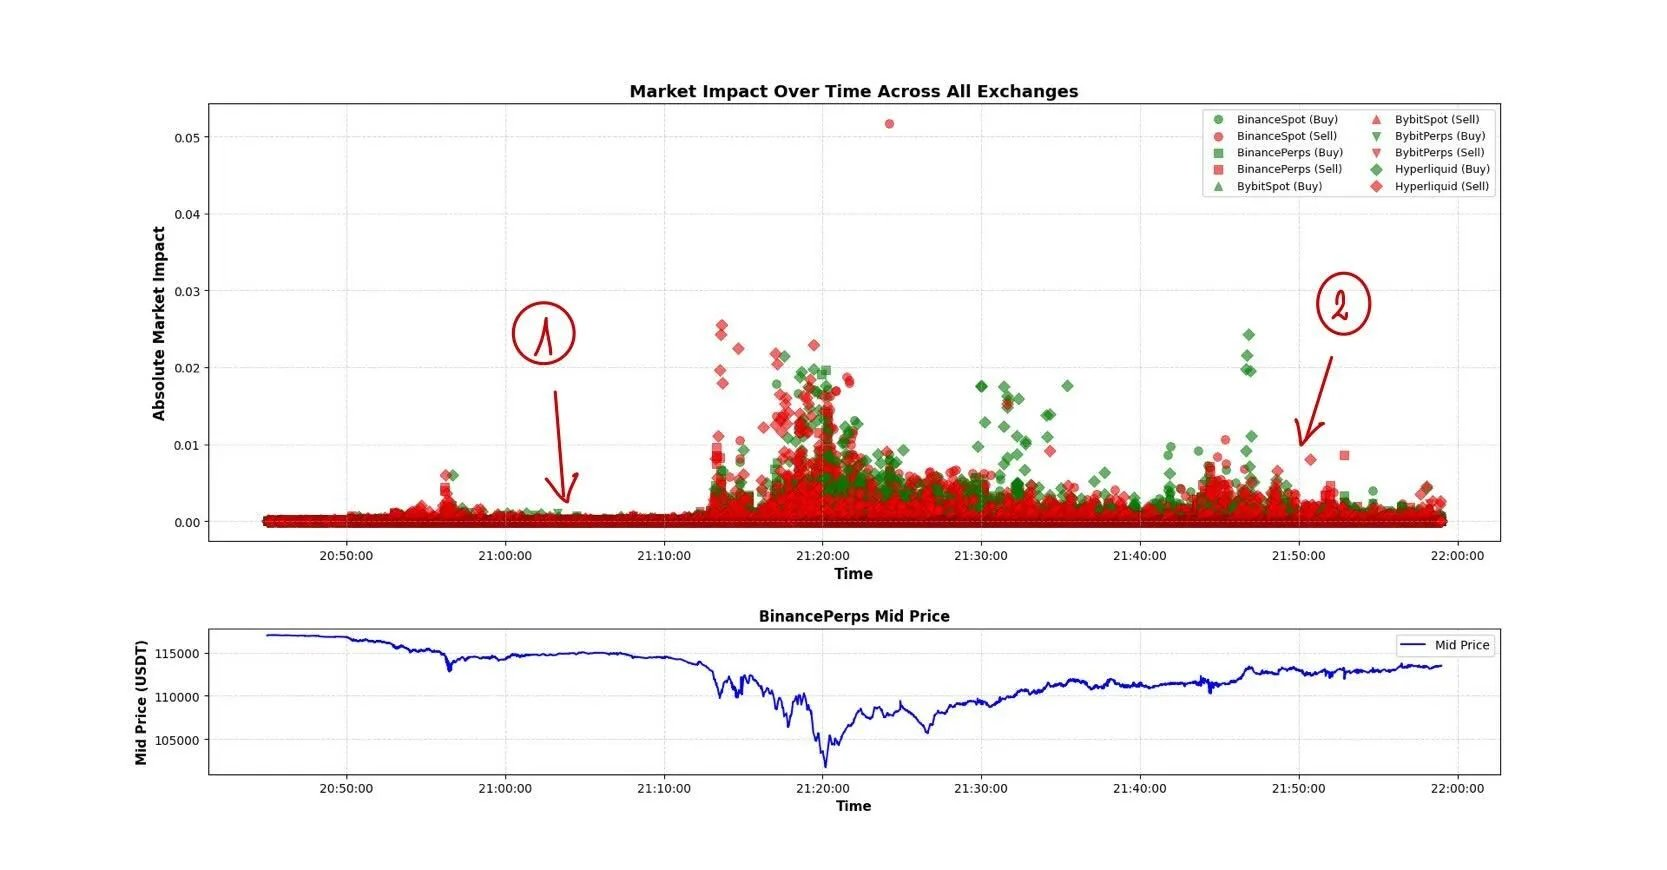
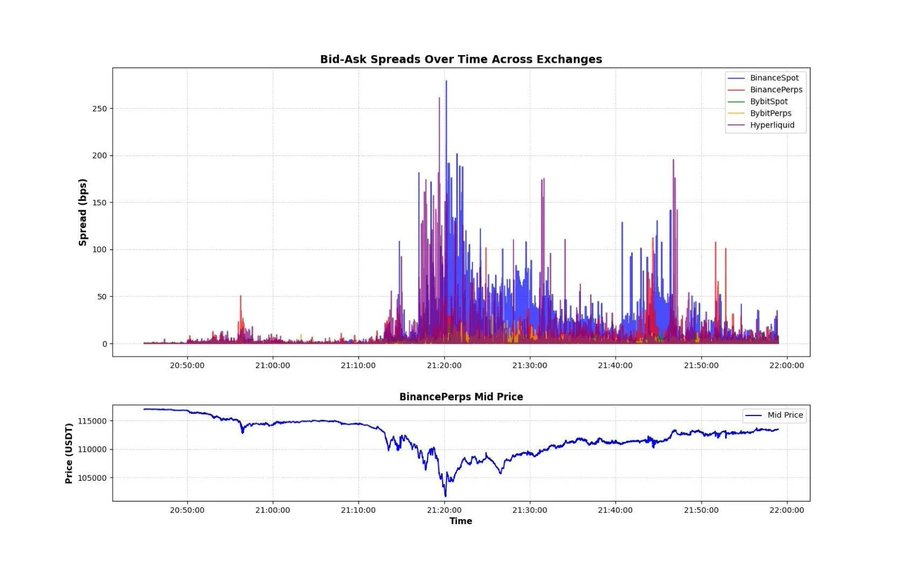
Liquidity—especially in the second phase—was abysmal. The chart below shows two indicators: the price impact caused by a single market order and the bid-ask spread between exchanges. From this, we can clearly see the extent of market disruption. In the market impact chart, the difference between situations 1 and 2 indicates that after a series of sharp declines, liquidity was extremely weak. It is likely that many market makers and arbitrageurs paused trading to assess the situation or significantly widened their bid-ask spreads.
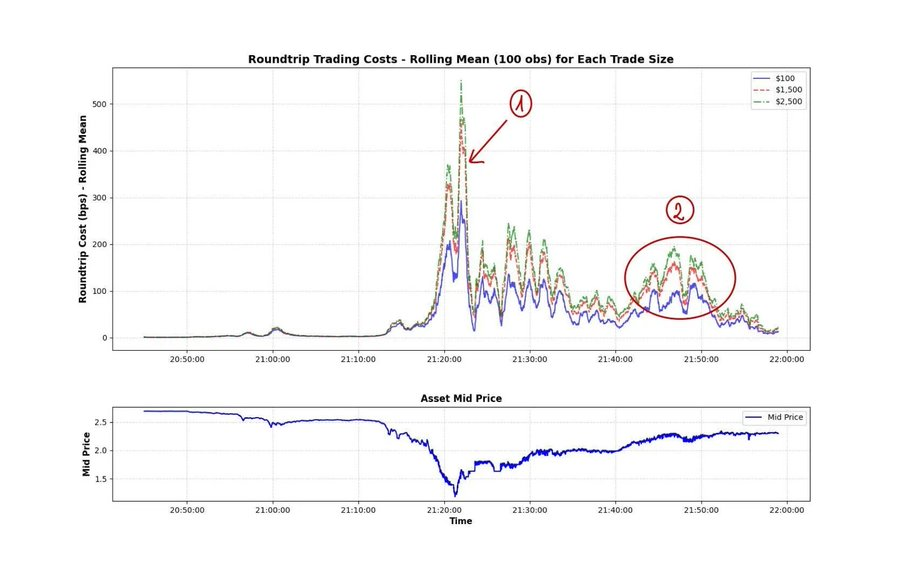
An important indicator for measuring the extent of market disruption is shown in the chart below—the "roundtrip cost" of XRP during the crash. The so-called roundtrip cost refers to the cost of executing two opposite trades (buy and sell) at the same time, expressed as a percentage. On Binance, the exchange with the best liquidity in the crypto market, during the crash, for about an hour, a $500 trade incurred a 1% roundtrip fee, and at peak times, the roundtrip cost for $2500 exceeded 5%. This is insane! This is also why I often emphasize "liquidity-adjusted market capitalization": because the market we are in inherently lacks liquidity. Although this was an extreme event, moments of liquidity disappearing have been happening all along, and we should study this phenomenon more deeply.
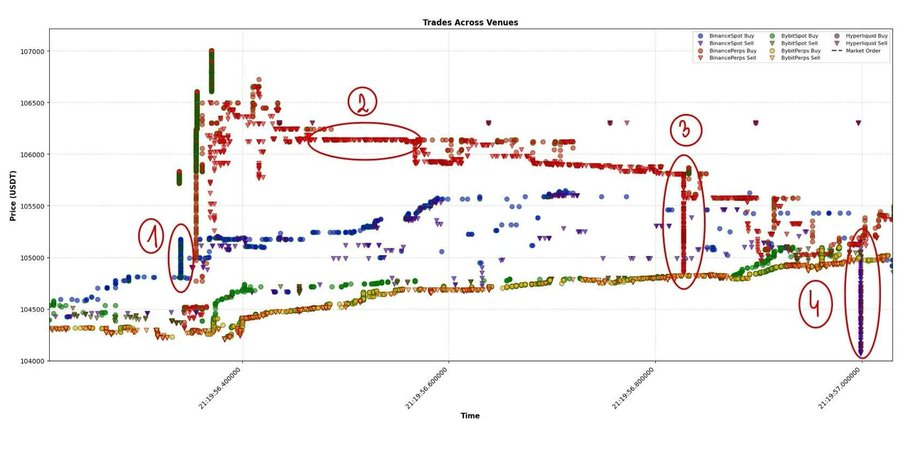
Now that we understand the scale of liquidity disappearance, we can delve deeper into the market's microstructure. The chart below shows all transaction data for BTC across multiple trading platforms. We can analyze a few points from this:
- There is a significant price difference between Hyperliquid and other markets—this is likely due to short-term pricing differences between USDT and USDC (the other exchanges in the chart are all quoted in USDT). During extreme volatility, such stablecoin price fluctuations must be incorporated into fair value models.
- Frequent occurrences of large market orders—these are likely arbitrage hedge orders. The high frequency of such orders indicates that the order submitters are almost indifferent to instantaneous impacts.
- Strong price impacts trigger other algorithmic trading—forming a self-reinforcing propagation chain.
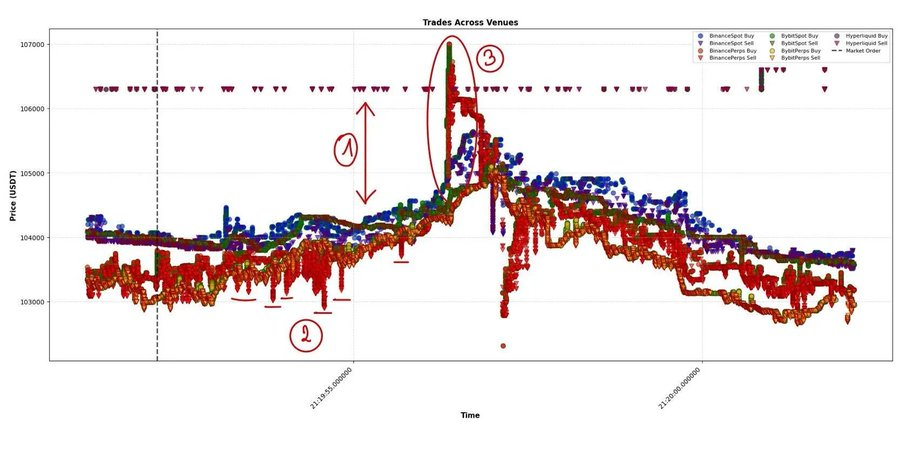
Let’s take a closer look at situation 3, which is the core area I have studied over the past few years—replaying thousands of similar events tick-by-tick, trying to understand the logic behind them.
How do we "decode" such events? First, (1) is the signal of inter-market propagation. The large market order was initiated by the Binance spot market. According to the analysis, during periods of low volatility, Binance (spot) is not the main price driver, but in this event, it more frequently became the starting point for market volatility. Subsequently, other exchanges followed suit with millisecond delays. The key here is the difference in market impact intensity across different trading venues—Binance (spot), Binance (perpetual), and other platforms. It can be seen that after the large market order appeared on Binance, the follow-up intensity from other exchanges was noticeably weaker. Therefore, modeling a new equilibrium state for the market after such trades is crucial for understanding market dynamics and cross-platform propagation mechanisms.
Secondly, (2) although it may not be easy to see directly, there may be large "marketable limit orders." You will notice that the market took some time to completely "consume" this limit order (still referring to part 2 here). This point is very important—especially in data with a small tick size, such "large single limit orders" often contain a wealth of information, providing key price clues amidst the noise.
Finally, (3) and (4) may be interrelated. A large market sell order appeared on Binance perpetual contracts, which then almost simultaneously spread to HyperLiquid, once again achieving cross-platform price equilibrium.
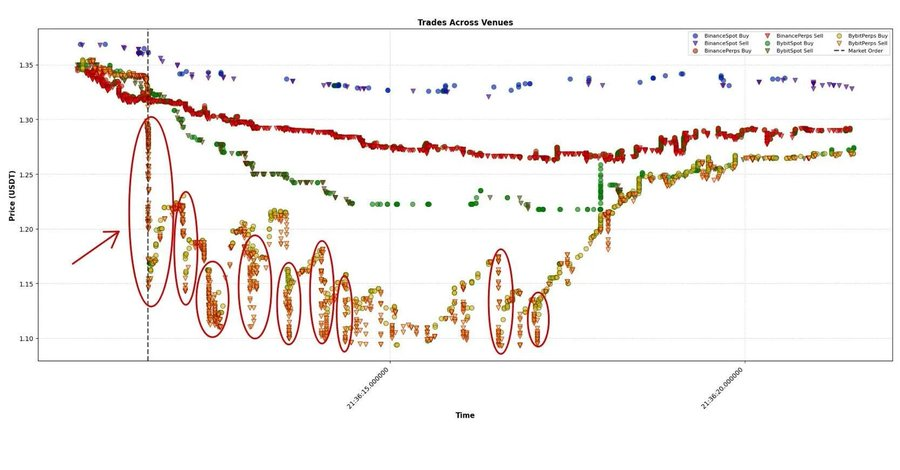
Another interesting example is ASTER. The arrows in the chart indicate a large market order with an instantaneous impact exceeding 10%. The market was severely disrupted, with prices temporarily dropping several percentage points below fair value, and new large market orders were executed every 500–1000 milliseconds. It took several seconds for the market to gradually return to equilibrium.
This is a textbook case—breaking down the impact into "instantaneous effects" and "permanent effects": the initial shock and the new equilibrium level.
USDE
Recently, there has been a lot of discussion about USDE and other assets used as collateral for portfolio margin, with even a lot of debate, rumors, and conspiracy theories arising. Let's look directly at the data. Evidence shows that this crash was absolutely not caused by the decoupling of USDE. When BTC and the broader market hit bottom, USDE was still trading around $1.
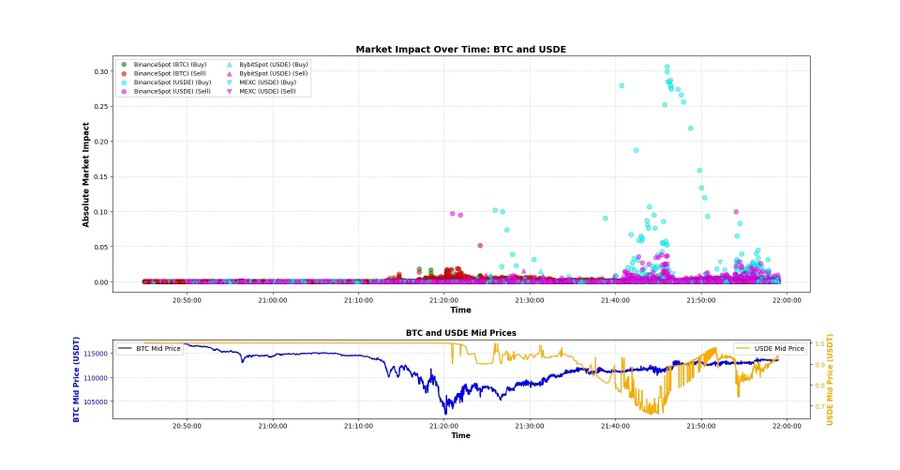
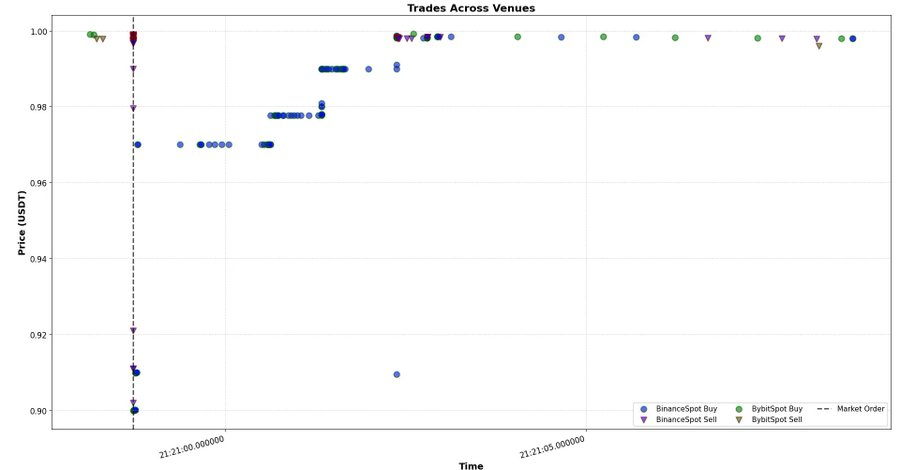
The chart below can serve as evidence: there was a fairly large market order with an instantaneous market impact of about 10%, but the price quickly recovered to around $1—this occurred around 9:21 PM, just after the market hit bottom.
A more surprising finding: look at the CVD (Cumulative Volume Delta) of USDE and BNSOL. The CVD of USDE is not abnormal—about $200 million in selling pressure, while significant, mostly appeared after the drop (likely due to marketable limit orders matched by aggressive arbitrageurs).
The situation with BNSOL, however, is quite abnormal: BNSOL's price appeared to be normal until it suddenly plummeted within a second—without any obvious active selling pressure. This is a result of a dual factor overlay:
- Liquidity is extremely thin: the crash had just ended, and most market makers had exited;
- The main pressure came from limit orders—someone had placed a large number of BNSOL orders waiting to be filled, continuously updating their orders with each price fluctuation.
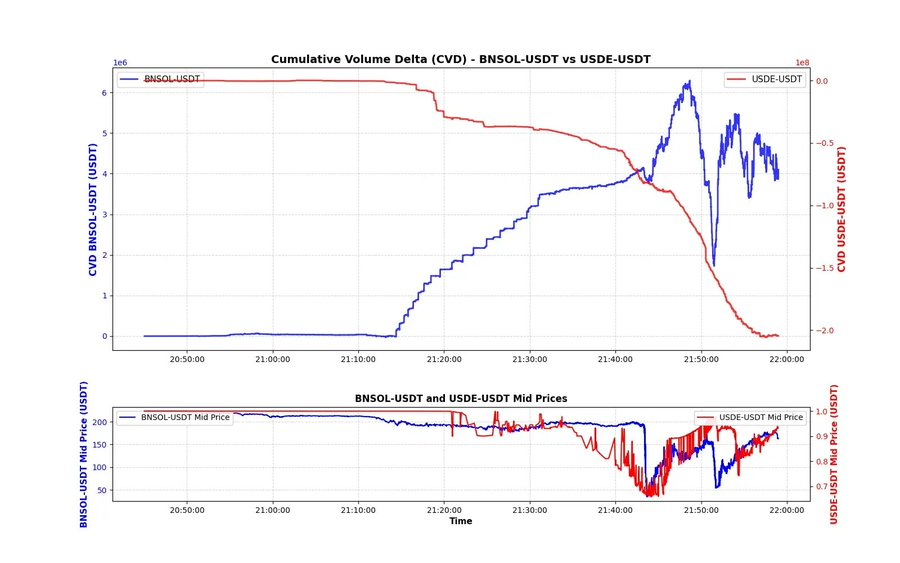
From the data, it is likely that someone was forced to sell BNSOL for USDT and had to complete it immediately. Due to insufficient liquidity, they could only sell through limit orders, so this behavior would not be directly reflected in the CVD chart.
We may never know the truth, but based on the data, this explanation seems the most reasonable. We can delve deeper—like the discussions on X, comparing these three assets second by second to look for deeper patterns. For now, I just want to check the basic data to see if there are any obvious clues. I believe the time difference between BTC hitting bottom and USDE hitting bottom, as well as the shape of the CVD curve, can provide some context for understanding the market mechanisms at that time.
Market Over-Leveraging
Major exchanges have now built extremely complex and sophisticated leverage systems—dozens of assets, dozens of strategies: different modes of margin trading, multi-asset models, including wrapped assets as collateral, and even meme coins that just launched a few hours ago can be leveraged up to 20 times. Unfortunately, everything that happened that day exposed the fragility of this system.
I sincerely hope this event does not set the entire industry back several years. The data from that day allowed us to see the "typical trader" profile for each exchange—especially the scale of liquidations on HyperLiquid, which is not even the largest perpetual contract platform by trading volume. The "HyperLiquid era" did not create this trading mentality—it merely revealed the desires that traders had long harbored: infinite leverage, instant feedback, and dopamine stimulation disguised as Alpha.
- Earning $100,000 a year?—Boring.
- Retiring in ten years instead of ten months?—Even more boring.
People chase dreams, wanting to earn more and earn faster. Opening perpetual contracts on tokens with extremely poor liquidity has become a new "lottery ticket." As a result, in the past few months, almost every month a new decentralized perpetual exchange (DEX) has launched, each introducing new incentive mechanisms to encourage volume trading and extreme leverage. Leverage itself is not the root of the problem; it is more like a mirror reflecting how impatient and restless the market has become. Everyone longs for exponential growth in a linear world.
The Death of Dual Disconnection
In such an environment, you may have hundreds of ways to lose money—even if you haven't made any "major mistakes."
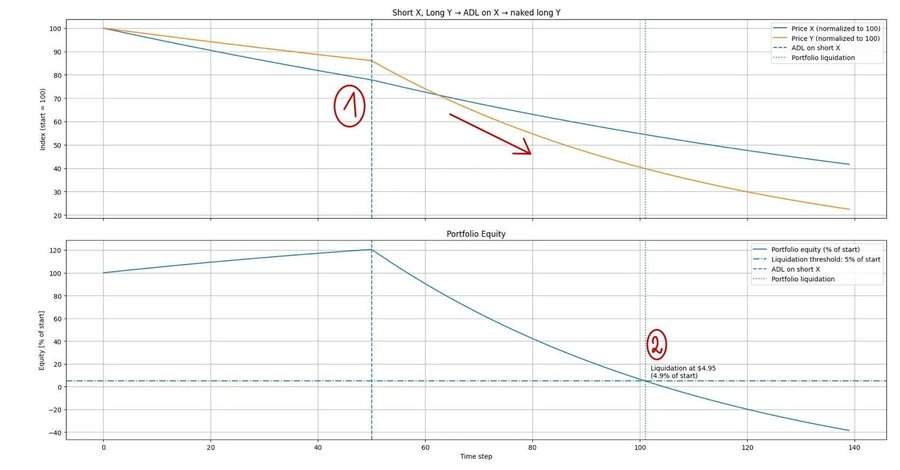
I want to give a very, very simple example to illustrate how you can lose everything in "normal operations." Suppose you are running a basic statistical arbitrage strategy. You short asset X while going long on asset Y (for example, BTC against ETH, DOGE against SHIB, HYPE against ASTER). You have $100 in capital and use 5x leverage (this example applies similarly under different leverage, just with slightly different numbers).
You open your computer and find that the market suddenly crashes. From the chart, it is clear that X (the short) is falling much faster than Y (the long)—you are secretly pleased, thinking you are set to profit from this move. But what you don't see is that due to over-leverage, your exchange has already forcibly closed your short position through the automatic deleveraging mechanism (ADL). As a result, you are left with only a "naked long" position. When the market continues to fall, your long Y is no longer hedged by short X, and your equity begins to decline in sync with the price. Soon, you are forcibly liquidated by the system—yet you might still be congratulating yourself on how your strategy "theoretically" performed well.
Why do I present this basic example? Because I have seen too many people gloat over others' liquidations, mocking them for being "stupid." I find this behavior very distasteful—this is exactly what I want to tell you: in such a market, there are countless ways to lose everything. Believe me, even many "big players" were liquidated that day.
On October 10th, it was not difficult to lose money. In such moments, your only goal is singular—survive. Don't think about how much to earn, catching rebounds, or successfully bottom-fishing; just survive. I hope you made it through that day, and I hope you are ready to face the upcoming market.
October 10th was not just a crash; it was a reminder. No matter how advanced our models, infrastructure, or leverage systems are, the market will always find the weakest link and strike hard there. Those who survive may not be the smartest—but rather the most disciplined, the ones who can steadily lay the groundwork. The game will continue tomorrow, just as it always has.
免责声明:本文章仅代表作者个人观点,不代表本平台的立场和观点。本文章仅供信息分享,不构成对任何人的任何投资建议。用户与作者之间的任何争议,与本平台无关。如网页中刊载的文章或图片涉及侵权,请提供相关的权利证明和身份证明发送邮件到support@aicoin.com,本平台相关工作人员将会进行核查。


