
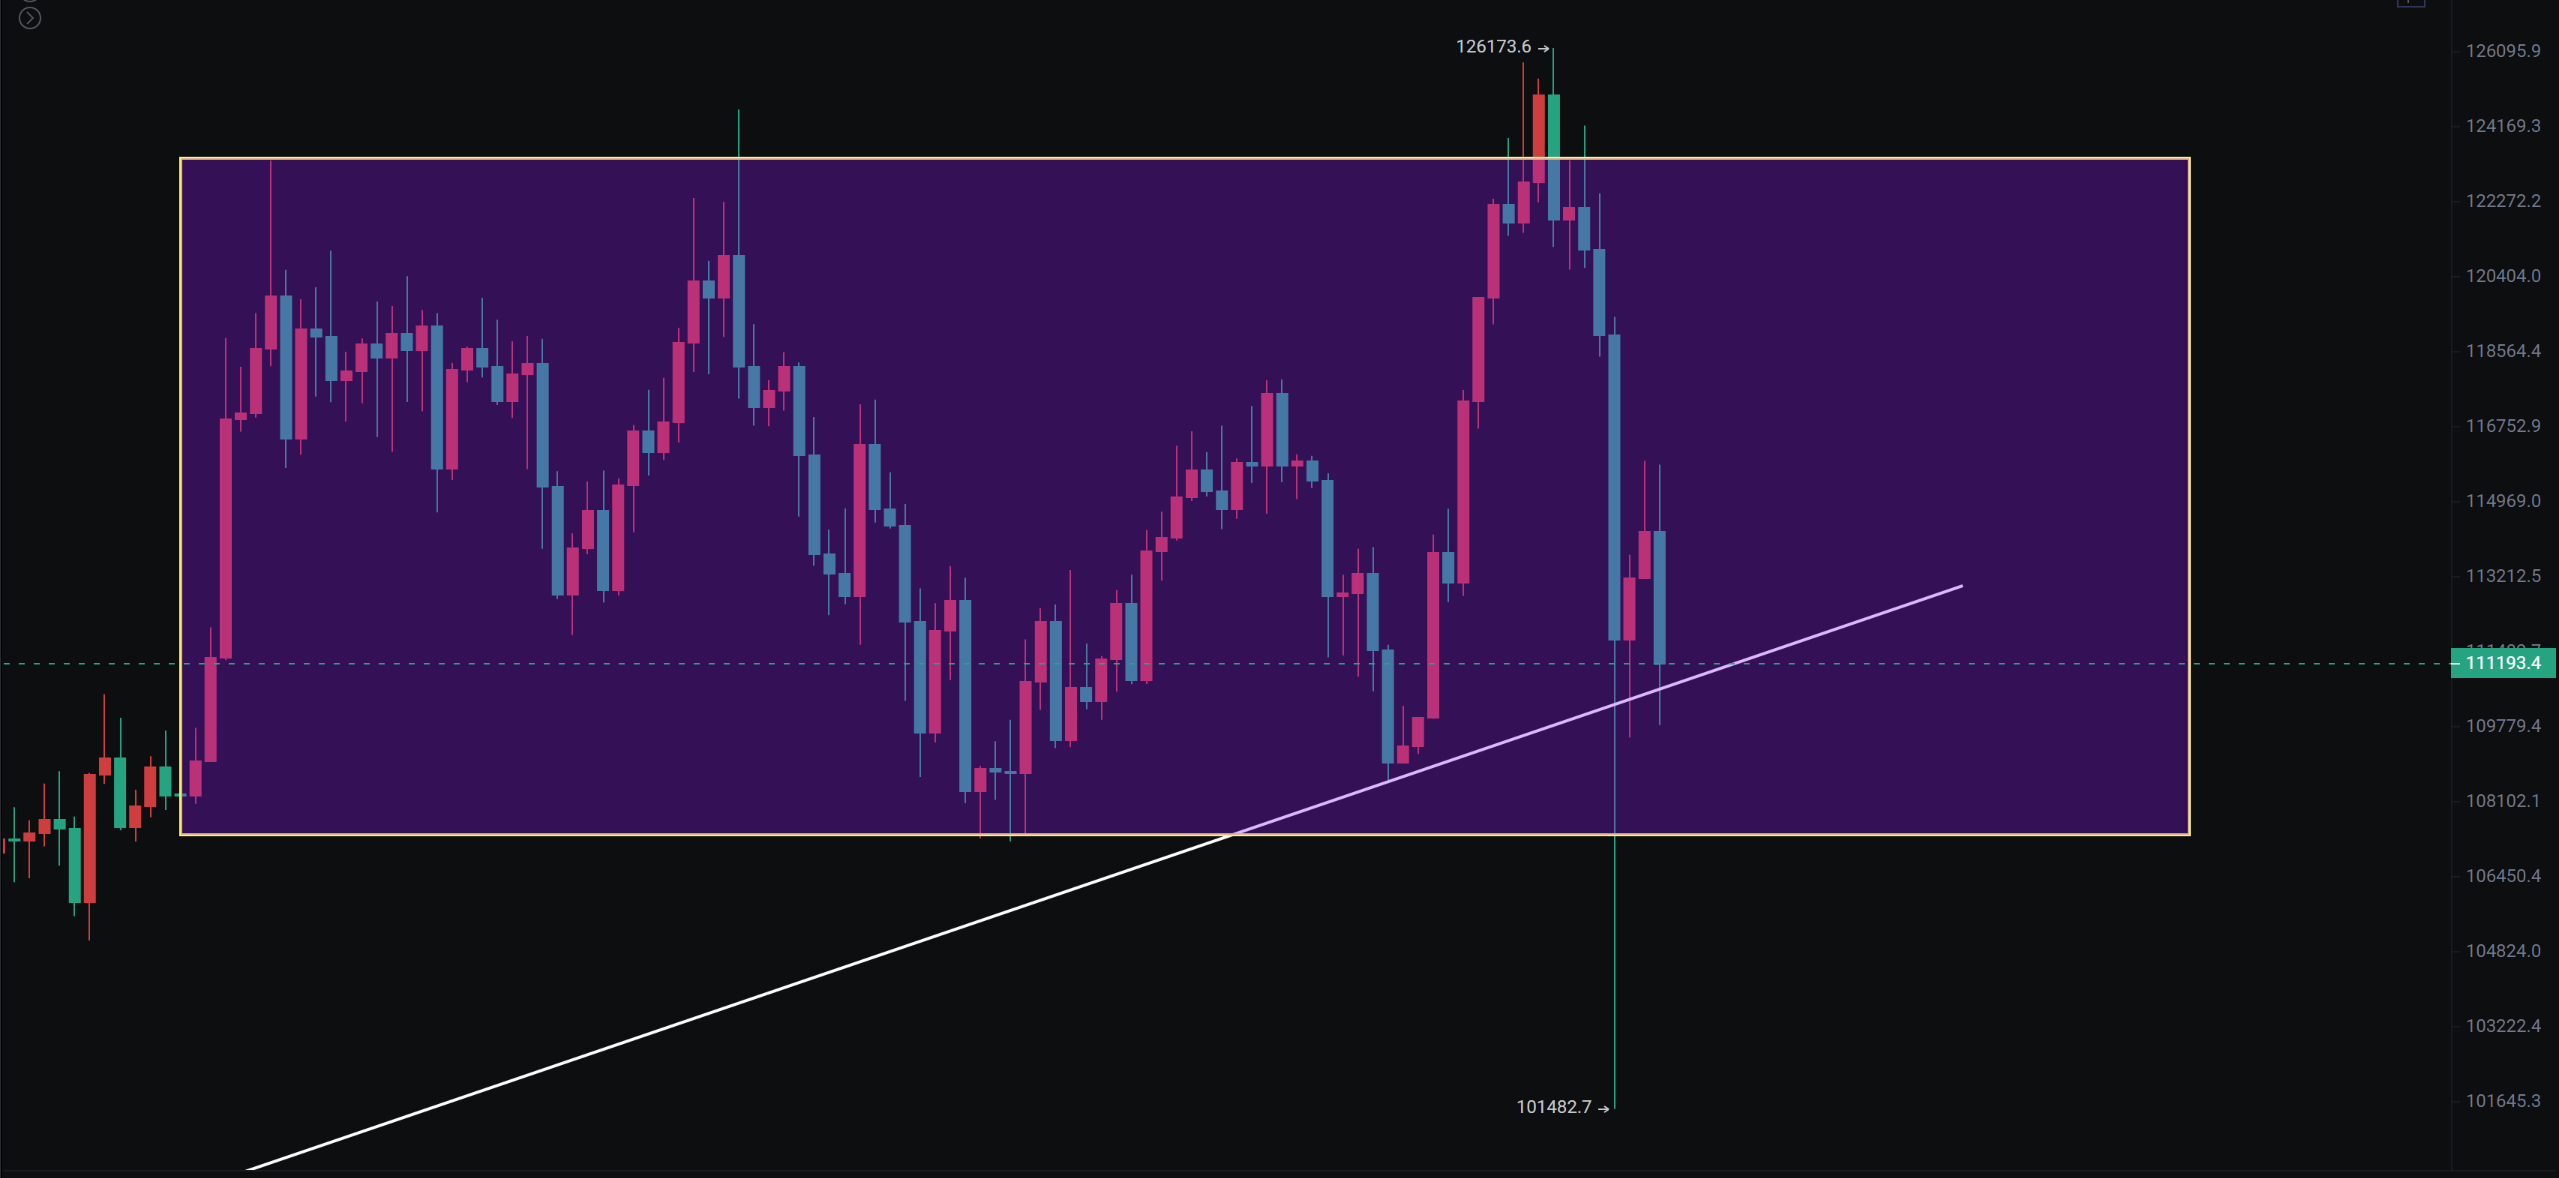
U.S. stocks opened lower and have continued to decline as of the time of writing, making the bottom on the 11th very critical. If it breaks below this level, it will likely drag Bitcoin down further. Since Bitcoin's sharp drop on the 11th, we have been waiting for a second test opportunity, and it has currently retraced to around 109,500, where there is short-term support. Next, we will focus on this short-term support; if it cannot hold, the probability of a further decline followed by a rebound increases, and we will then look at the height of the rebound. Therefore, if a second test rebound opportunity arises, mid to long-term positions can be reduced.
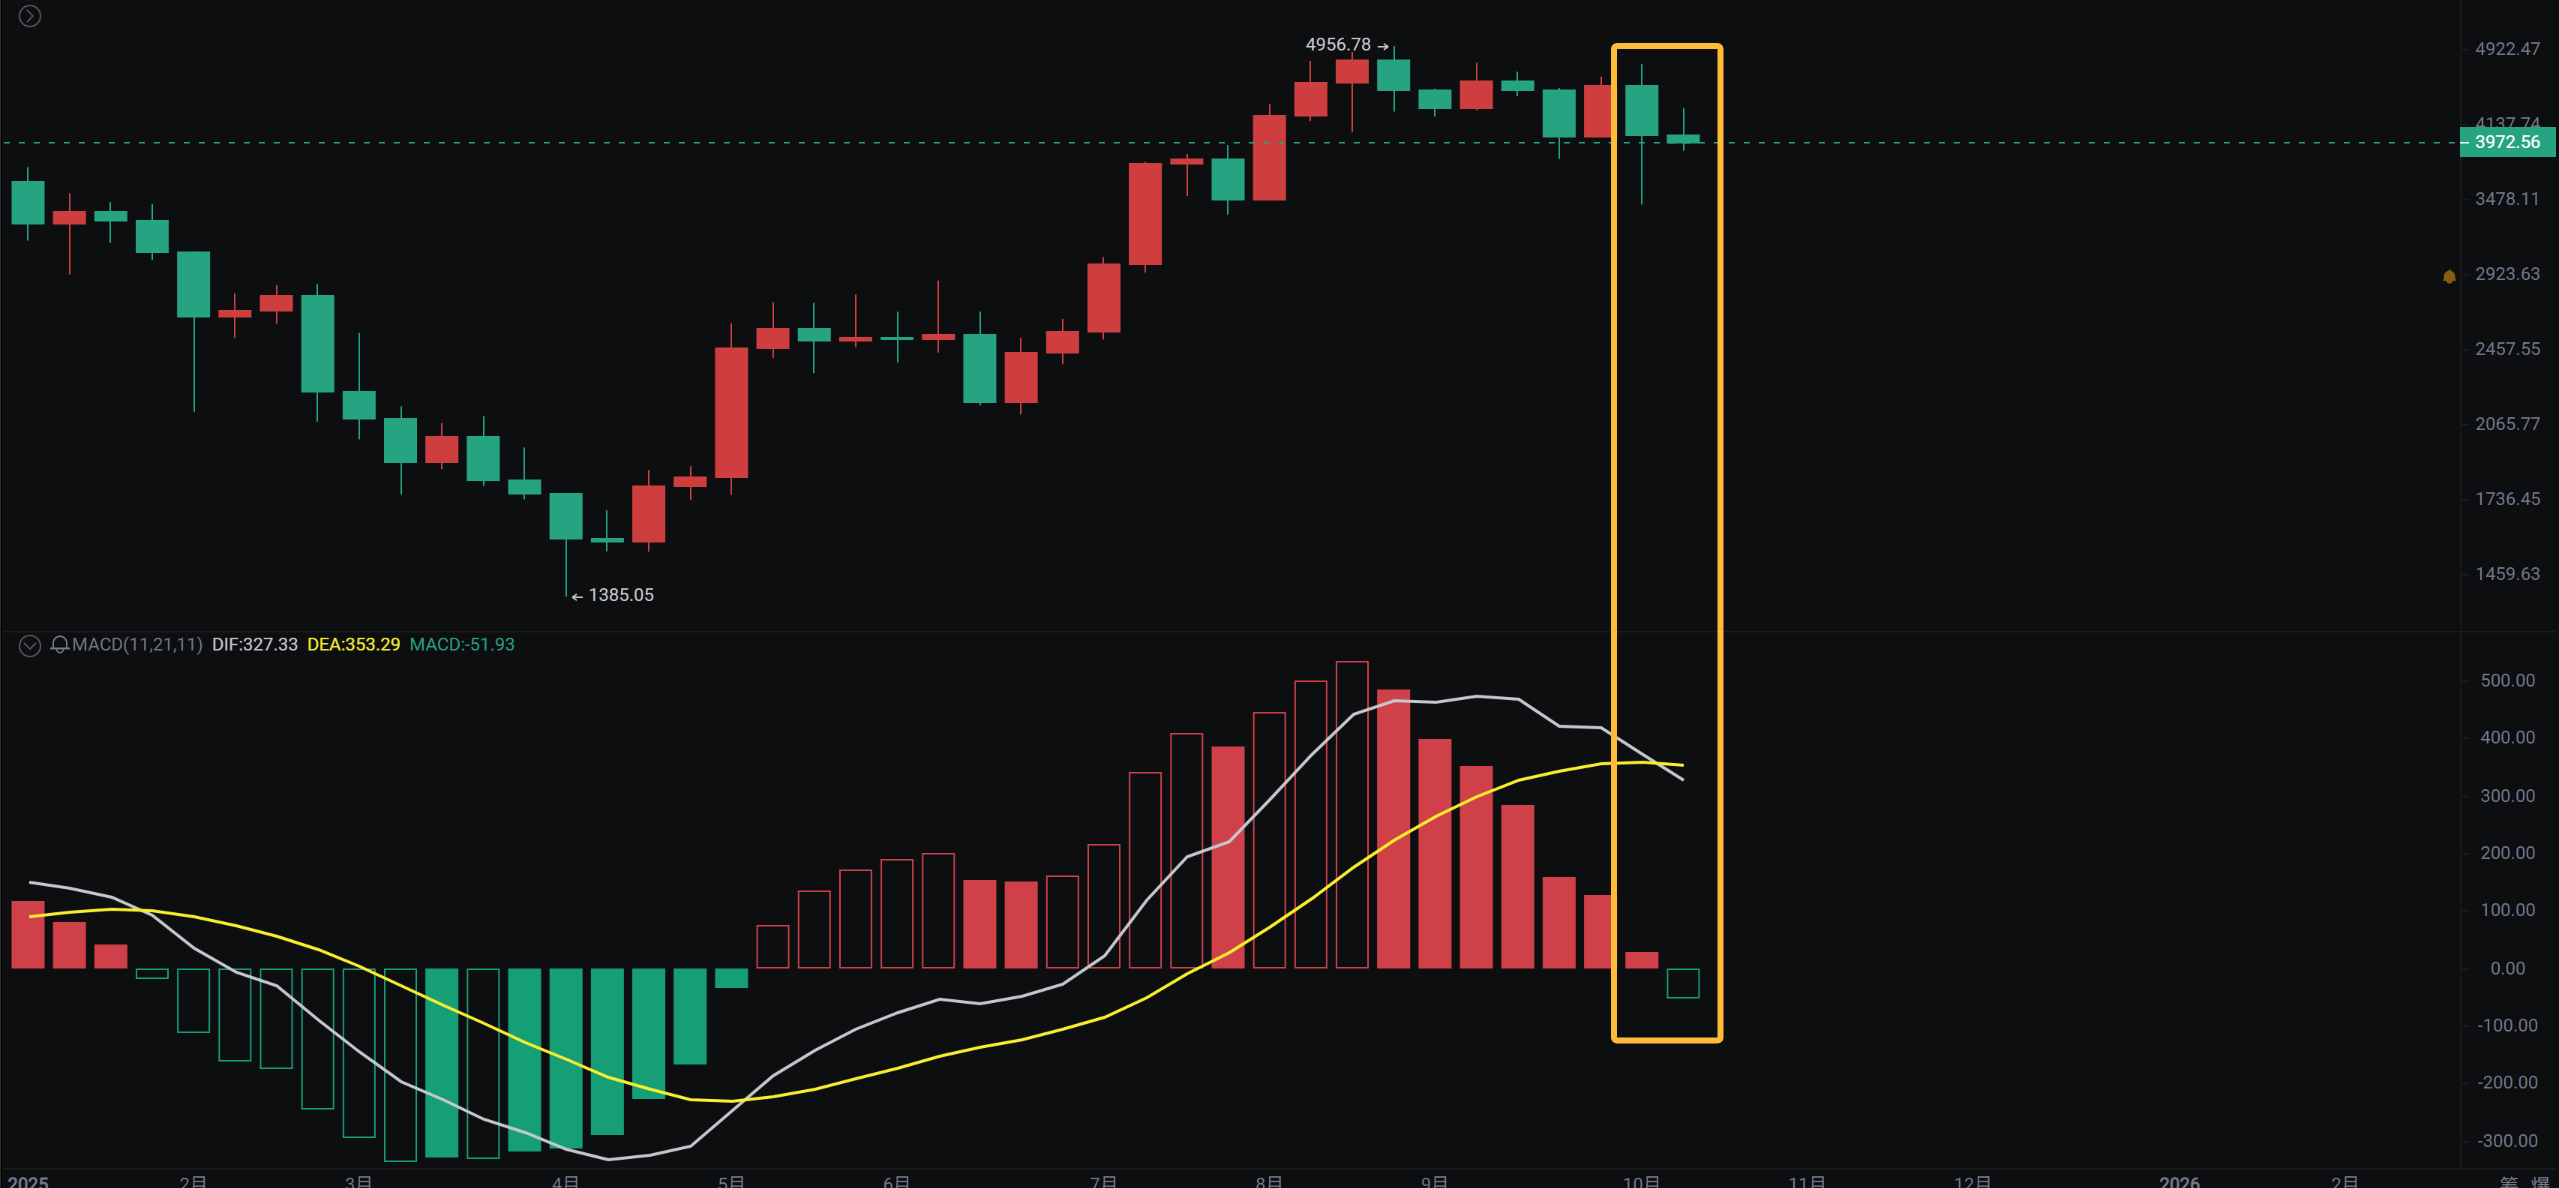
From a weekly perspective, when it previously dropped to around 107,000 and 108,000, I believed it would continue to reach new highs. However, after reaching a new high, it experienced a false breakout and then a rapid decline, with the weekly MACD showing a top divergence, increasing bearish risk.
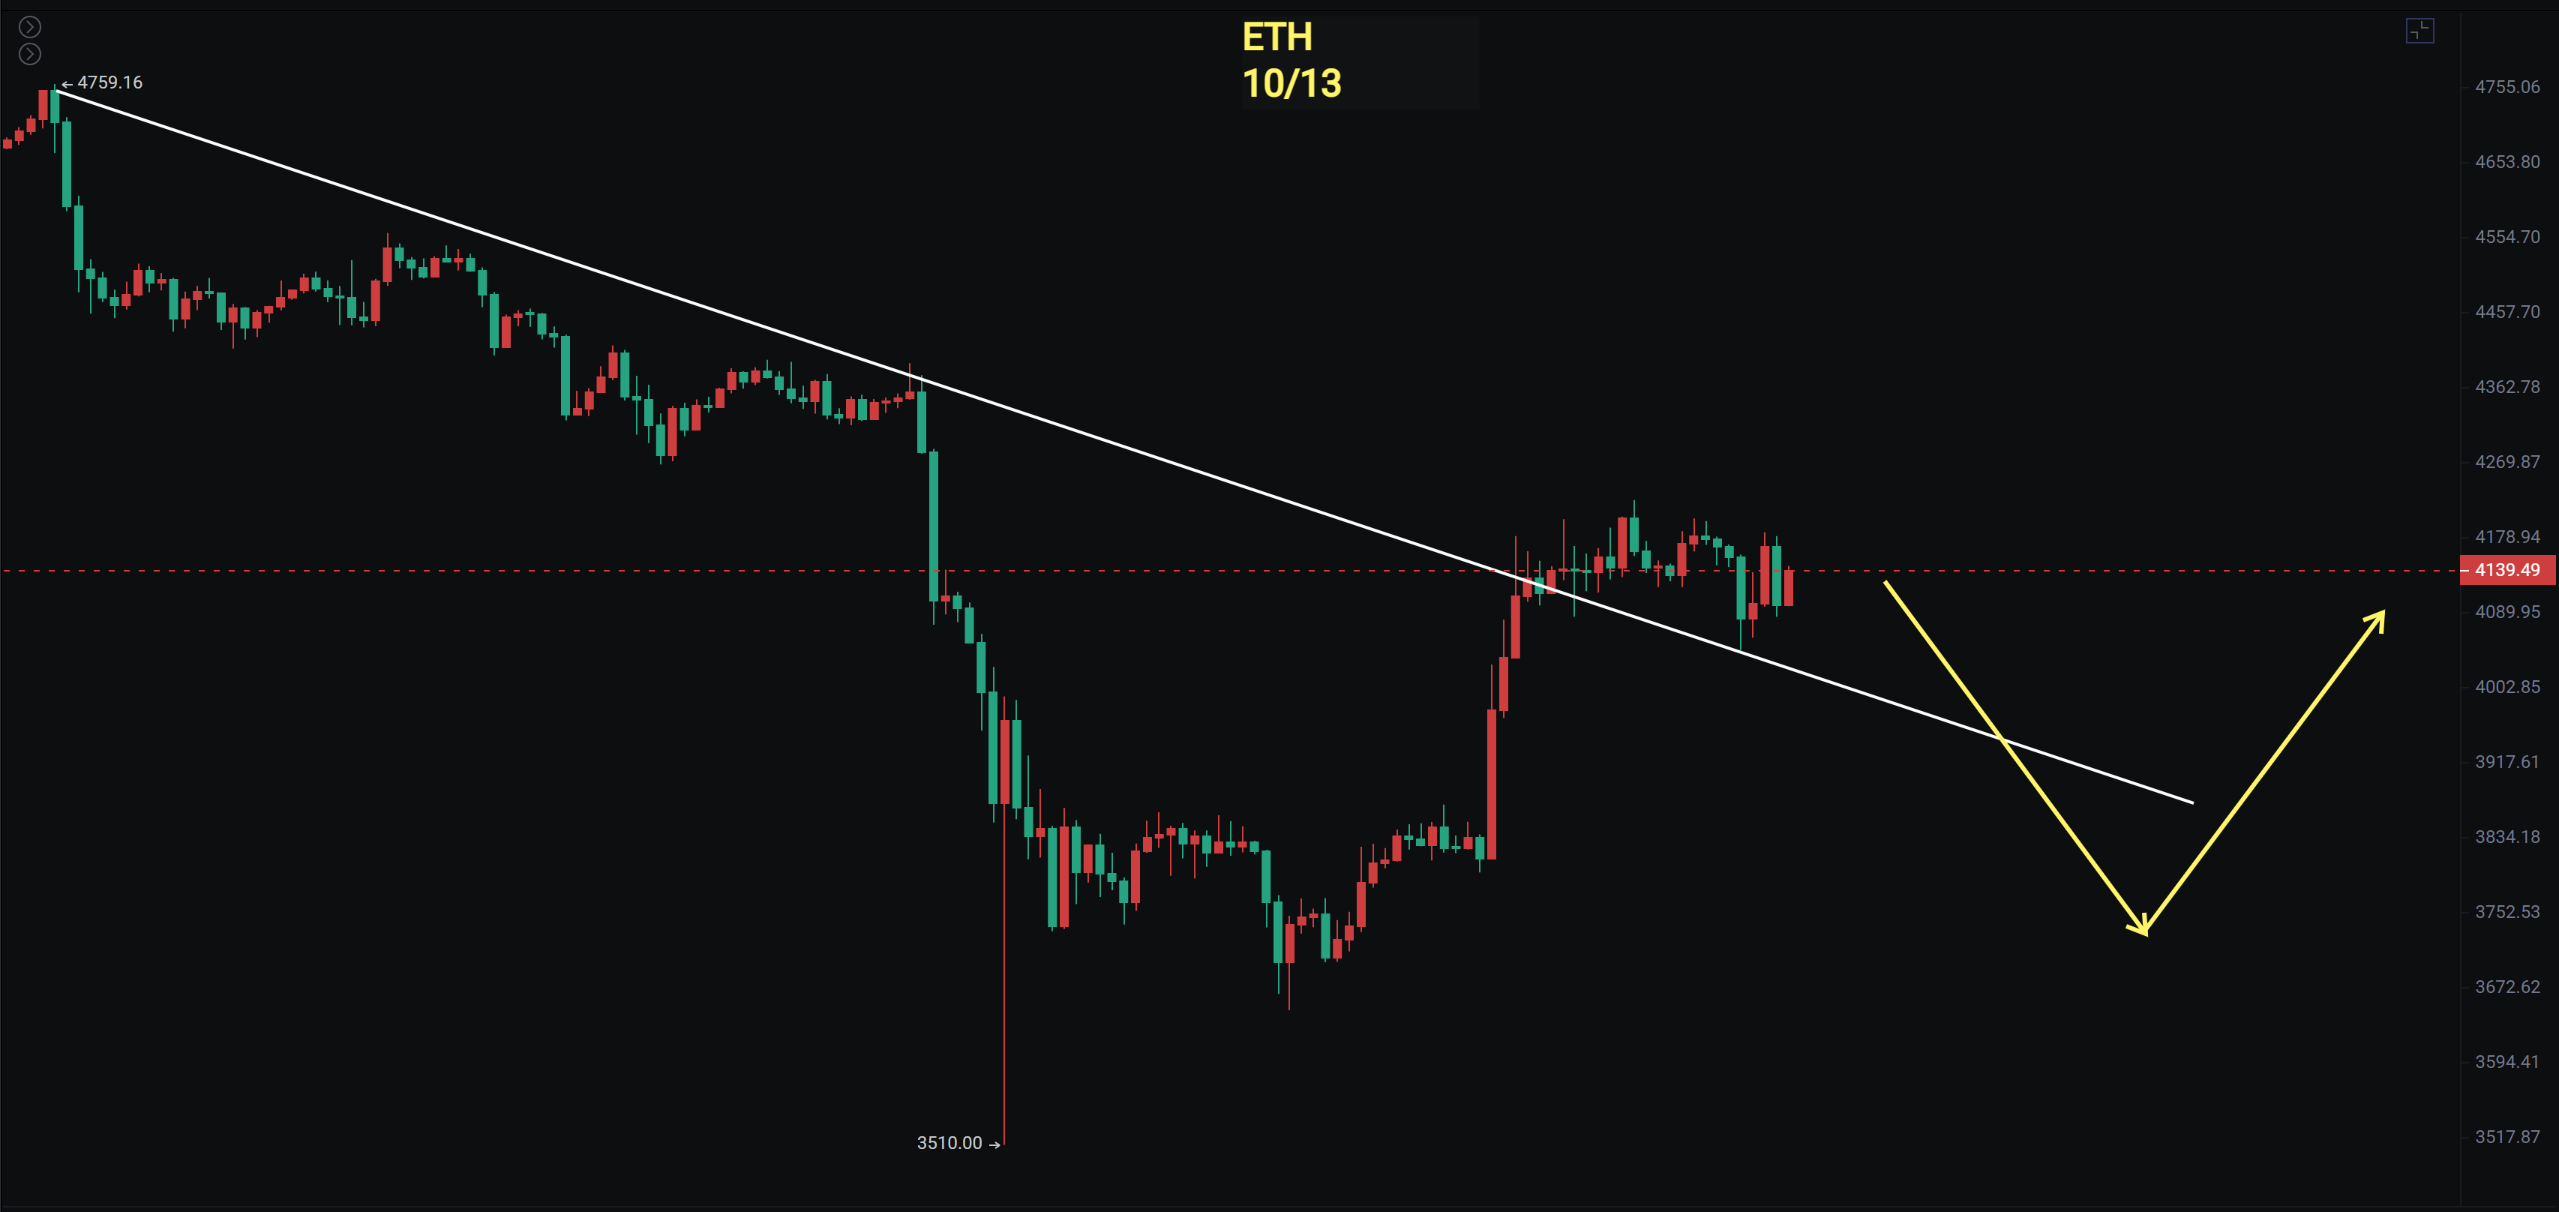
Ethereum's weekly MACD has crossed below the fast and slow lines, forming a death cross. If there is a rebound afterward, it will still be an opportunity to reduce positions. Additionally, the MACD of both Bitcoin and Ethereum has formed a resonance; after breaking below the range at the end of September, it quickly made a lower low, with the center of gravity continuing to shift downward, so future rebounds will also be an opportunity to reduce positions.
Bitcoin
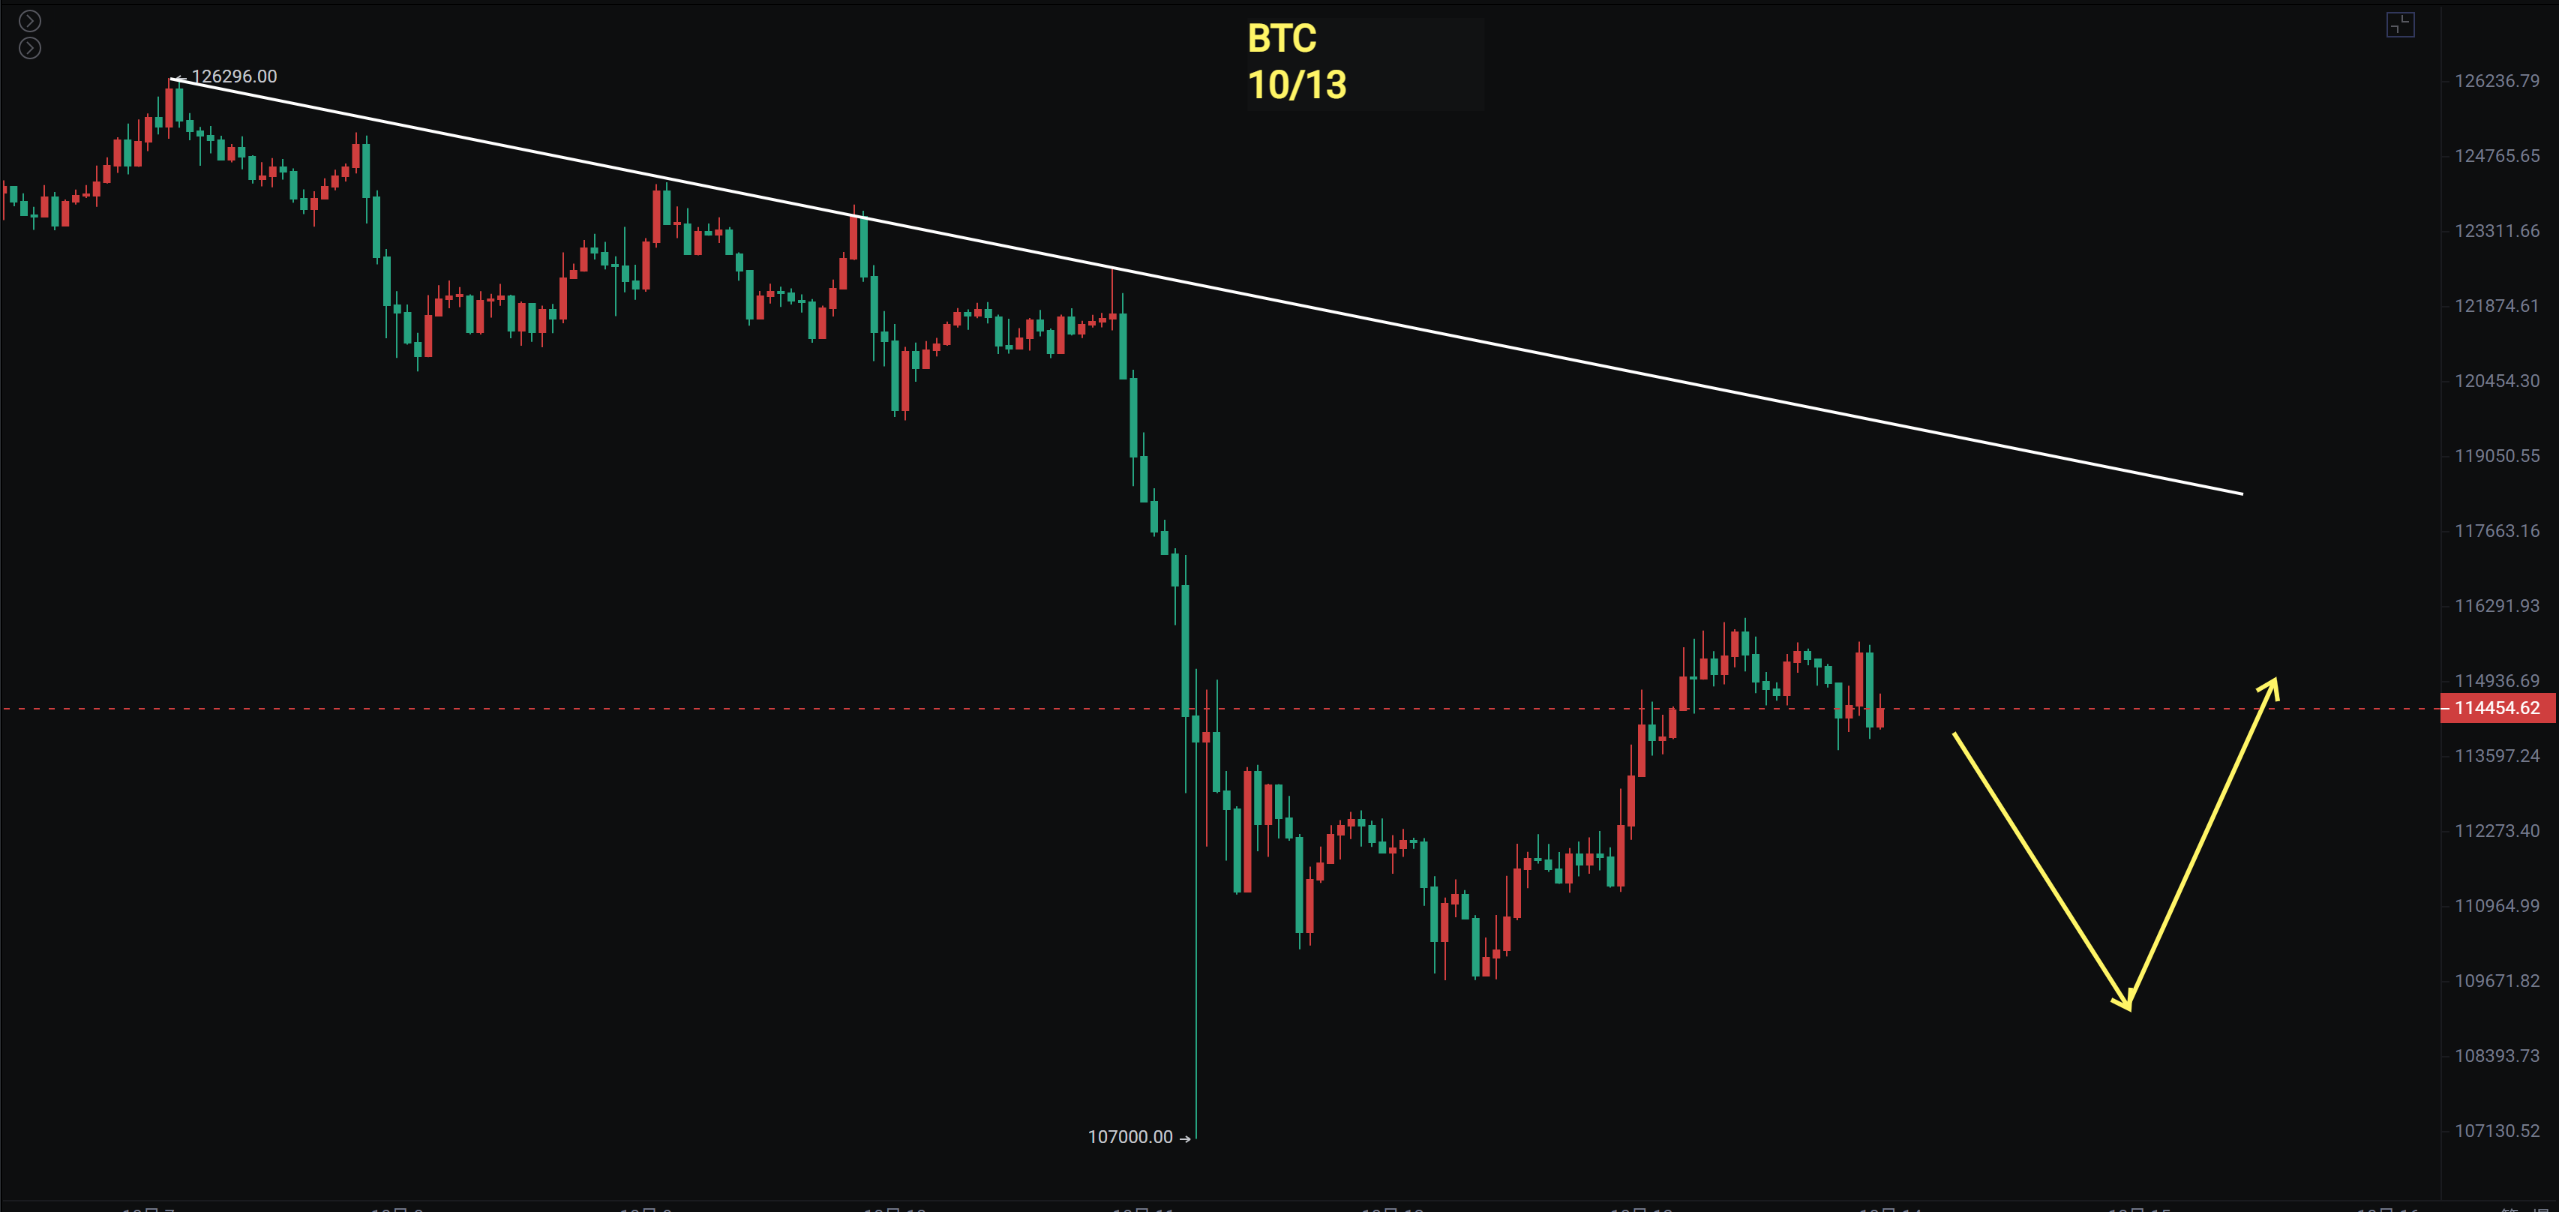
Bitcoin is still undergoing a second test in the short term. From the current market situation, it has retraced to the previous spike's low point around 109,500. In my view, it may make a lower point before rebounding.
The short-term rebound has not broken through 0.618 (the golden ratio). If the movement is strong during the second test, there is a chance to rebound between 0.68 and 0.786, but it will still be under pressure below 120,000, which will also be an opportunity to reduce positions in the mid to long term.
● Support: 106,000—107,000

● Resistance: 118,000—120,000
Ethereum
Ethereum's short-term rebound broke through 0.618 but then fell again, retracing to the previous downward trend line on the 4-hour chart, but still breaking below the range, indicating that the risk has not been resolved. The weekly chart shows a "double bearish engulfing" pattern, with the MACD returning to the zero axis and the fast and slow lines crossing, which is also a bearish signal. It is recommended to reduce positions after the second test rebound ends.
● Support: 3,650—3,800

● Resistance: 4,300—4,460—4,755
If you like my views, please like, comment, and share. Let's navigate through the bull and bear markets together!!!
The article is time-sensitive and for reference only; it is updated in real-time.
Focusing on K-line technical research, sharing global investment opportunities. Official account: BTC Trading Prince Fusu

免责声明:本文章仅代表作者个人观点,不代表本平台的立场和观点。本文章仅供信息分享,不构成对任何人的任何投资建议。用户与作者之间的任何争议,与本平台无关。如网页中刊载的文章或图片涉及侵权,请提供相关的权利证明和身份证明发送邮件到support@aicoin.com,本平台相关工作人员将会进行核查。


