Written by: Glassnode
Translated by: Glendon, Techub News
Abstract
Recently, Bitcoin broke through the supply range of $114,000 to $117,000, reaching a historic high of $126,000, thanks to strong ETF inflows and a reaccumulation of funds in the mid-market. Although on-chain and spot market signals remain constructive, the rising leverage and concentrated bullish positions indicate that short-term vulnerabilities in the market are intensifying.
Key Points
On-chain profitability has significantly increased, with 97% of the supply currently in profit. While high profitability levels typically accompany consolidation, realized profits remain suppressed, indicating that the market is undergoing an orderly rotation rather than selling pressure.
The supply cluster at $117,000 has turned into a support level, marking a structural shift as small and medium holders continue to accumulate, offsetting moderate profit-taking by large entities.
Driven by a rebound in spot demand and massive ETF inflows (over $2.2 billion), Bitcoin's price broke through $126,000, setting a new all-time high. The surge in institutional investors boosted prices and market activity, with spot trading volumes hitting several-month highs as the fourth quarter begins.
The derivatives market has expanded sharply during the rebound, with rising open interest and funding rates as late-stage bulls enter. The current pullback is testing this leverage, helping to reset positions and restore balance.
In the options market, implied volatility has risen, with skew turning neutral and call options dominating. Momentum remains strong, but bullish positions are becoming increasingly crowded.
The most notable feature is that Bitcoin has broken through the dense supply cluster held by top buyers between $114,000 and $117,000 and reached a new high, marking a revival of market strength while also raising questions about whether the market can sustain its upward momentum at these high levels. This article will analyze on-chain accumulation and distribution patterns, as well as dynamics in the spot and options markets, to assess short-term risks, market resilience, and the potential for sustained or short-term vulnerabilities.
On-Chain Outlook
Accumulation Recovery
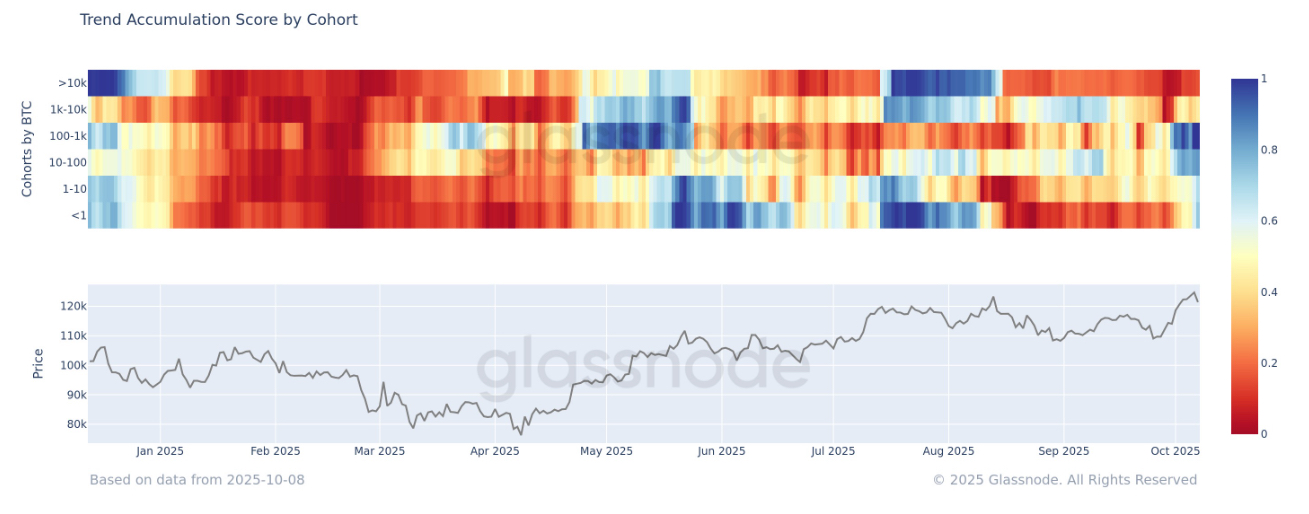
As Bitcoin breaks new highs, this article employs trend accumulation scores to assess potential demand strength. This indicator measures the balance between accumulation and distribution among different wallet groups.
Recent data shows a clear rebound in buying, primarily driven by small and medium entities (holding 10 to 1,000 Bitcoins), which have been steadily increasing their Bitcoin holdings over the past few weeks. Meanwhile, the selling pressure from whales has eased compared to earlier this year. The configuration among medium holders is becoming more consistent, indicating that the market is in a more organic accumulation phase, adding structural depth and resilience to the current upward trend.
Resistance Turns to Support
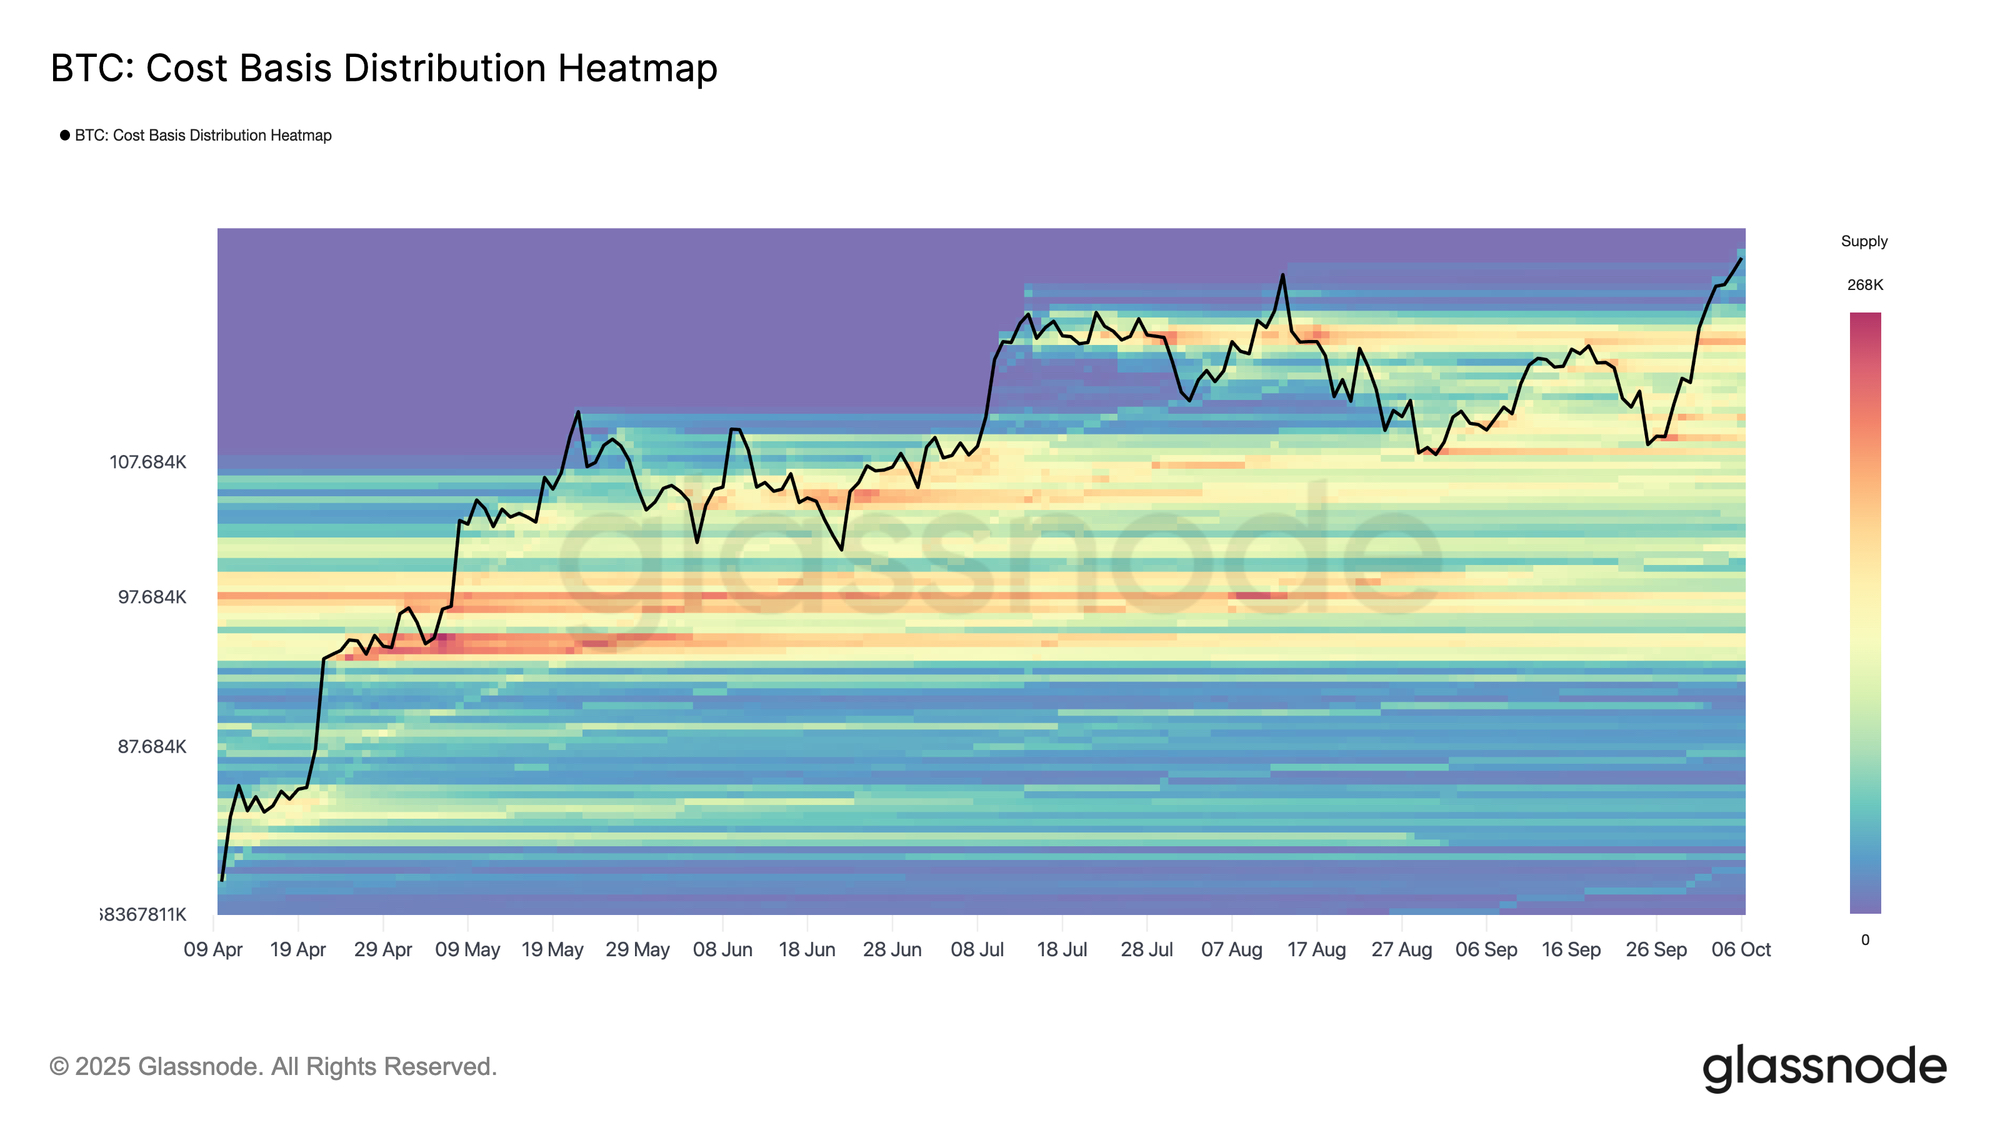
Based on the accumulation trend, Bitcoin's rebound has set a new all-time high, nearly bringing all circulating supply back into profit. The cost basis distribution heatmap shows limited structural support in the $121,000 to $120,000 range, while support around $117,000 is relatively strong (approximately 190,000 BTC last traded here).
While the price discovery phase itself carries the risk of exhaustion, recent buyers defending the profit entry zone suggest that a potential pullback to this area could trigger a new wave of demand, making it a key area to watch for stabilization and momentum recovery.
Mild Profit-Taking
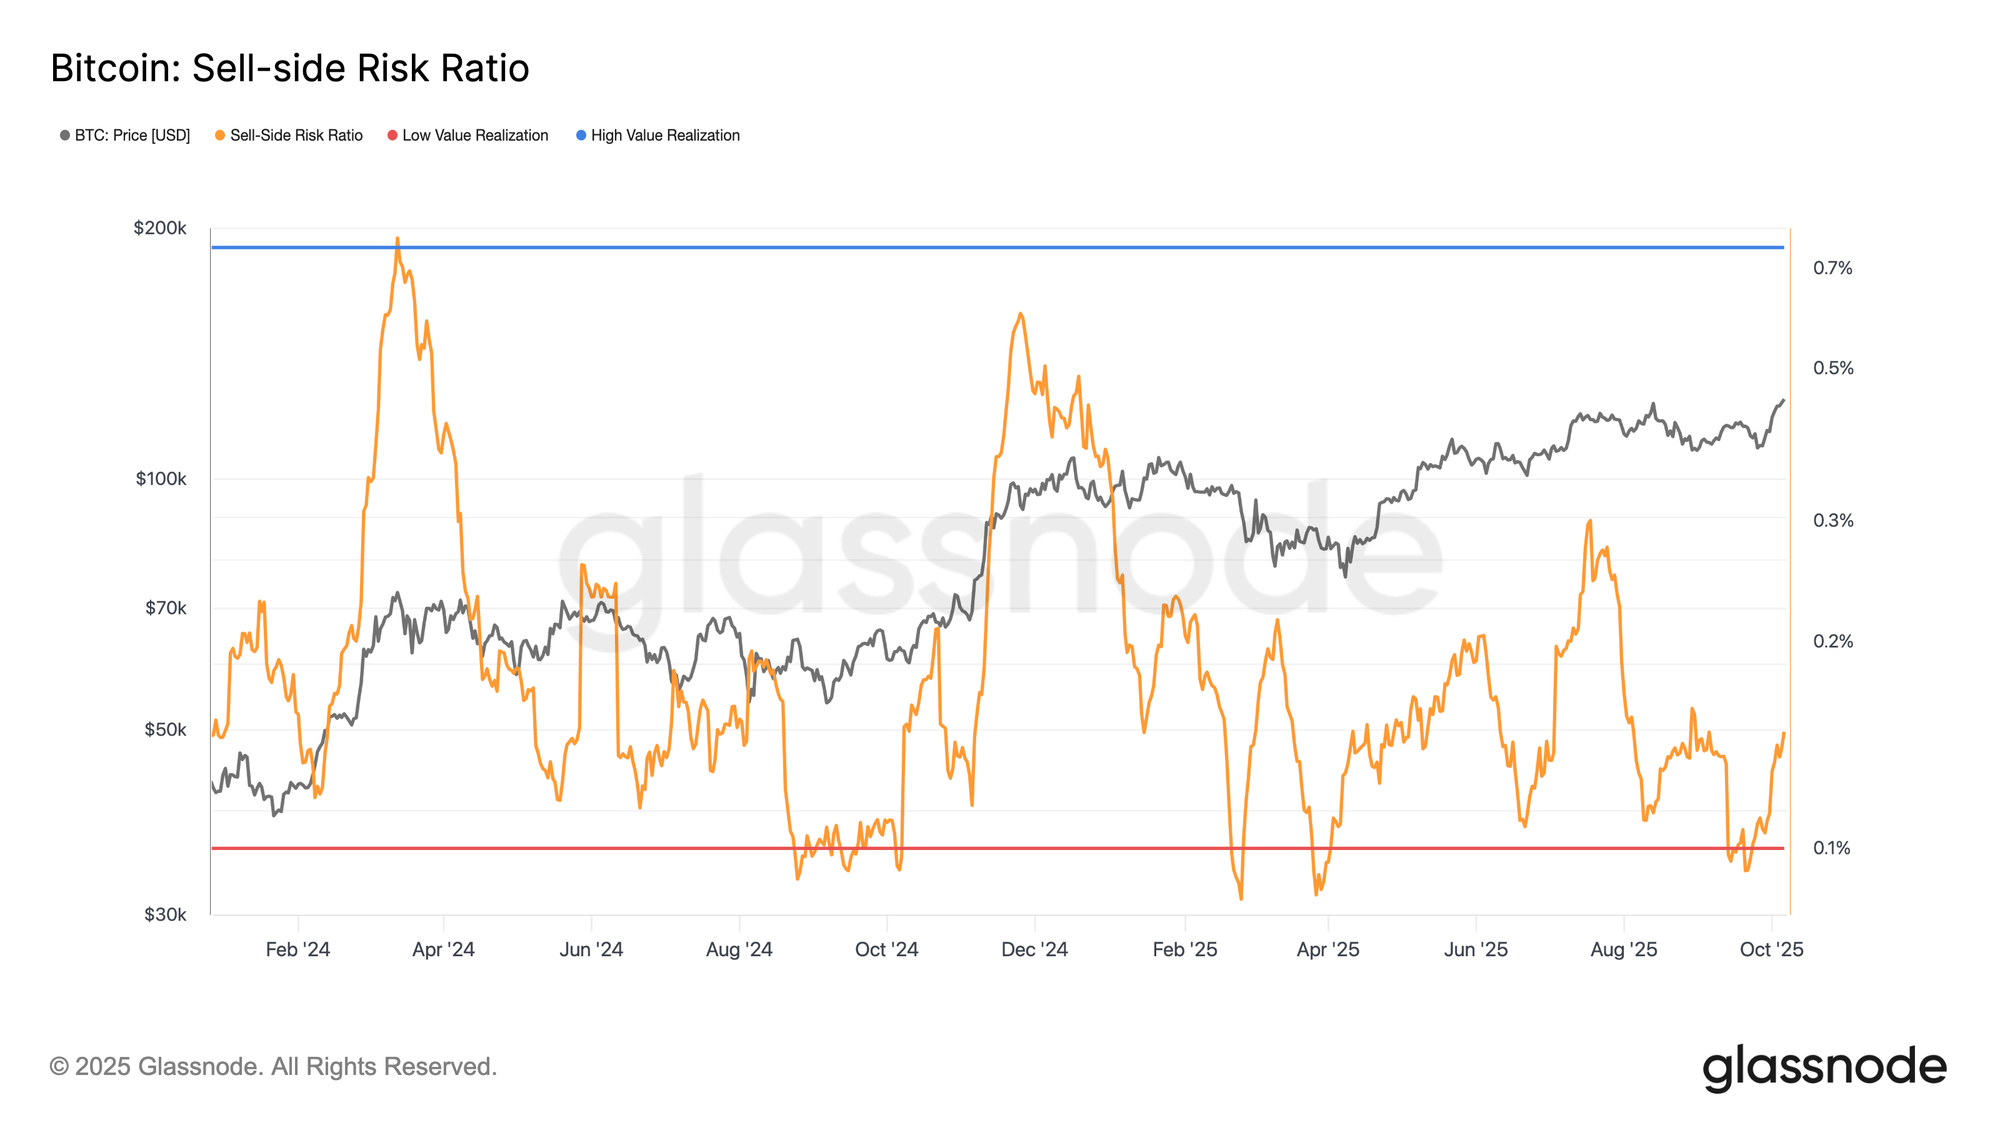
As Bitcoin enters the price discovery phase, assessing the degree of profit realization helps determine whether the upward trend is sustainable. The seller risk ratio measures the ratio of realized profits and losses relative to total realized value, serving as an indicator of investor willingness to invest.
Recently, this ratio has rebounded from its lower limit, indicating an increase in profit-taking after a period of quiet. Although still far below historical extremes associated with cycle tops, this rise suggests that investors are cautiously locking in profits. Overall, selling remains under control and aligns with healthy bull market characteristics, but as prices rise, it is necessary to continue monitoring this indicator.
Spot and Futures Analysis
ETF Inflows Drive Bitcoin to New Highs
Shifting focus from on-chain dynamics to market demand, Bitcoin's breakthrough to $126,000 is attributed to a sharp rebound in U.S. spot ETF inflows.
Following outflows in September, over $2.2 billion flowed back into ETFs within a week, marking one of the strongest buying waves since April. The renewed participation of institutional investors absorbed spot supply, enhancing overall market liquidity. Seasonally, the fourth quarter has historically been Bitcoin's strongest quarter, often coinciding with a rebound in risk appetite and portfolio rebalancing.
At the same time, as the broader market leans towards higher beta assets like cryptocurrencies and small-cap stocks (high-risk assets), sustained ETF inflows in October and November could provide lasting tailwinds, boosting confidence and supporting prices through the end of the year.

Spot Trading Volume Strongly Rebounds
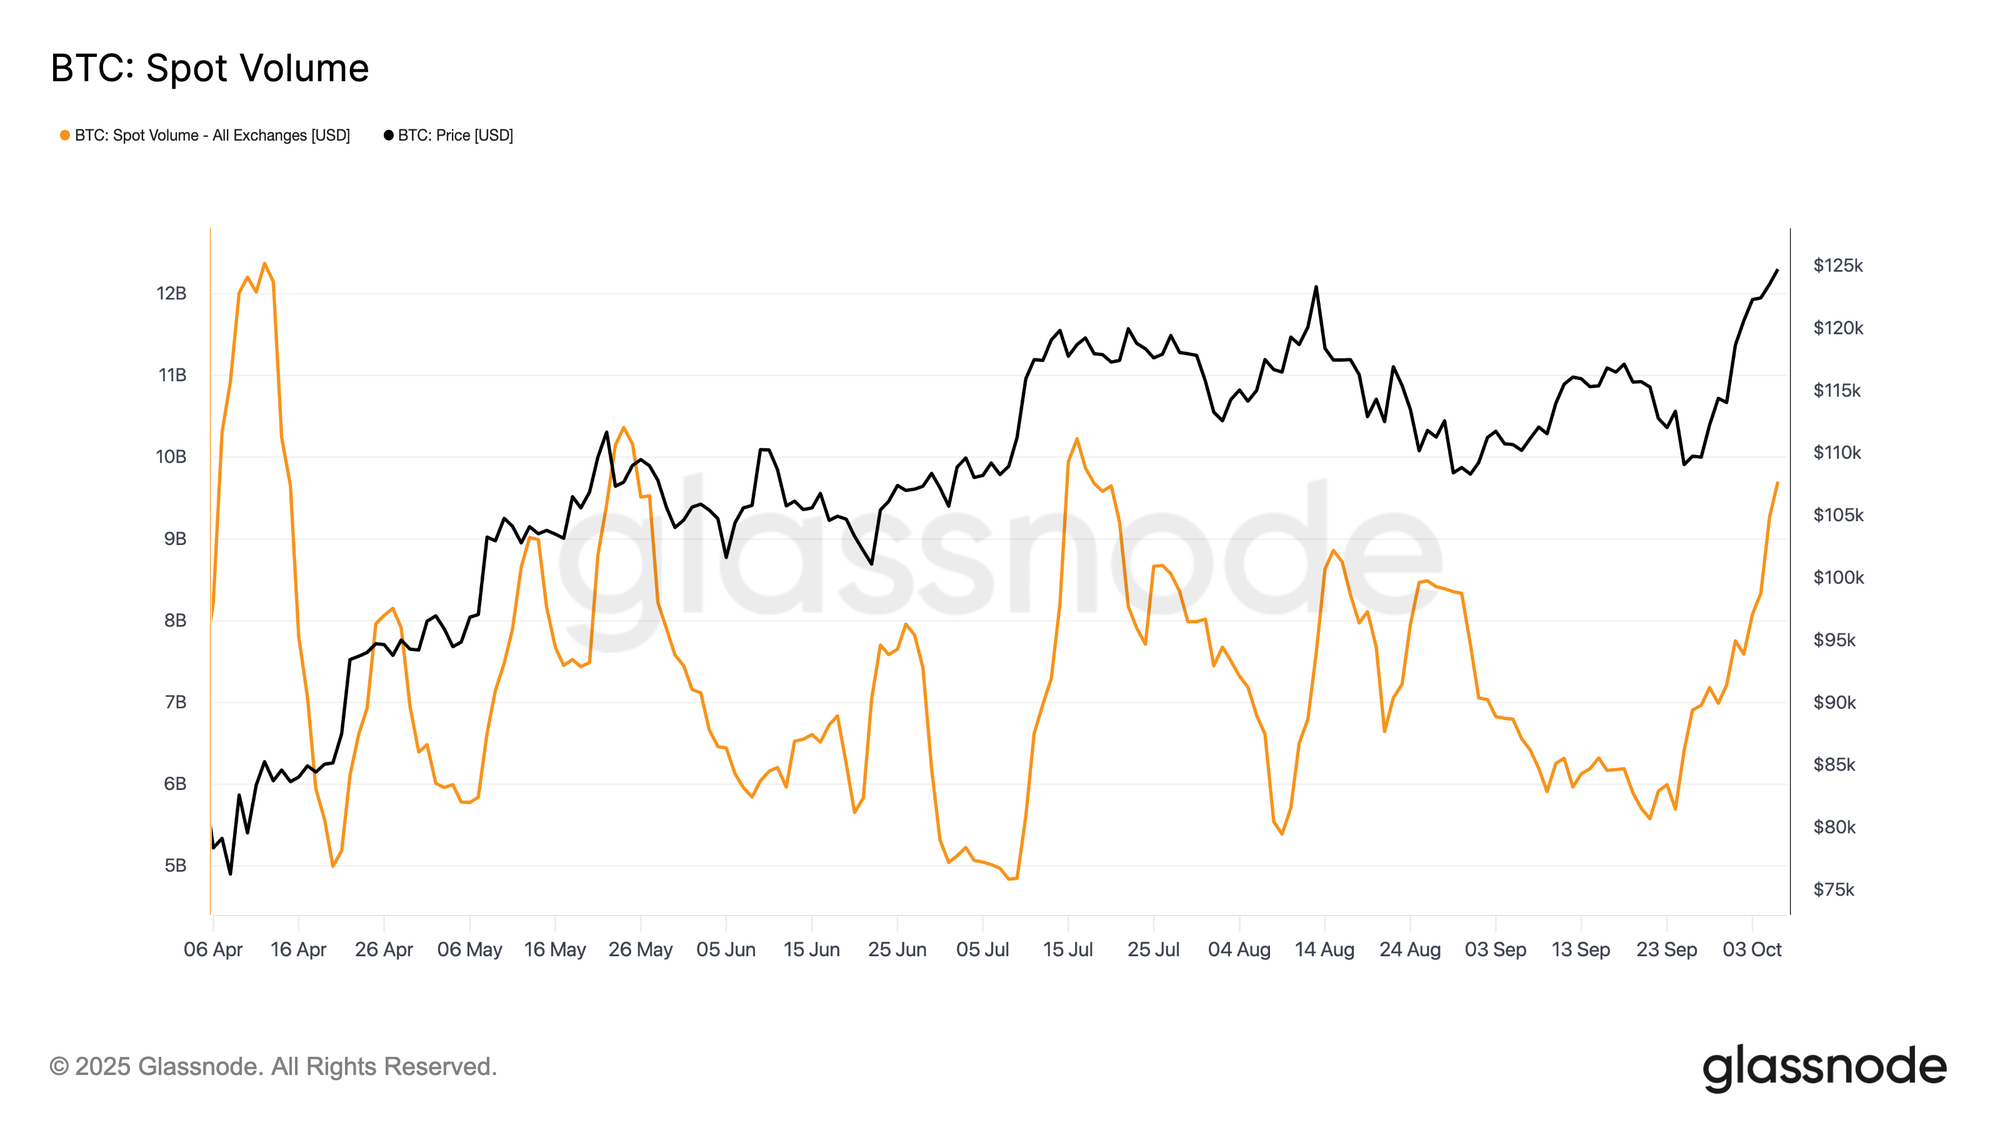
With ETF inflows reigniting demand, spot market trading activity has also surged. Daily spot trading volume has climbed to its highest level since April, confirming a rebound in market participation and enhanced liquidity.
This increase reflects growing confidence in Bitcoin's new high. Sustained trading volume is crucial for validating the strength of the upward trend, as historical experience shows that a decline in volume following a significant breakout often signals short-term weakness and a pullback phase.
Rapid Accumulation of Leverage Positions
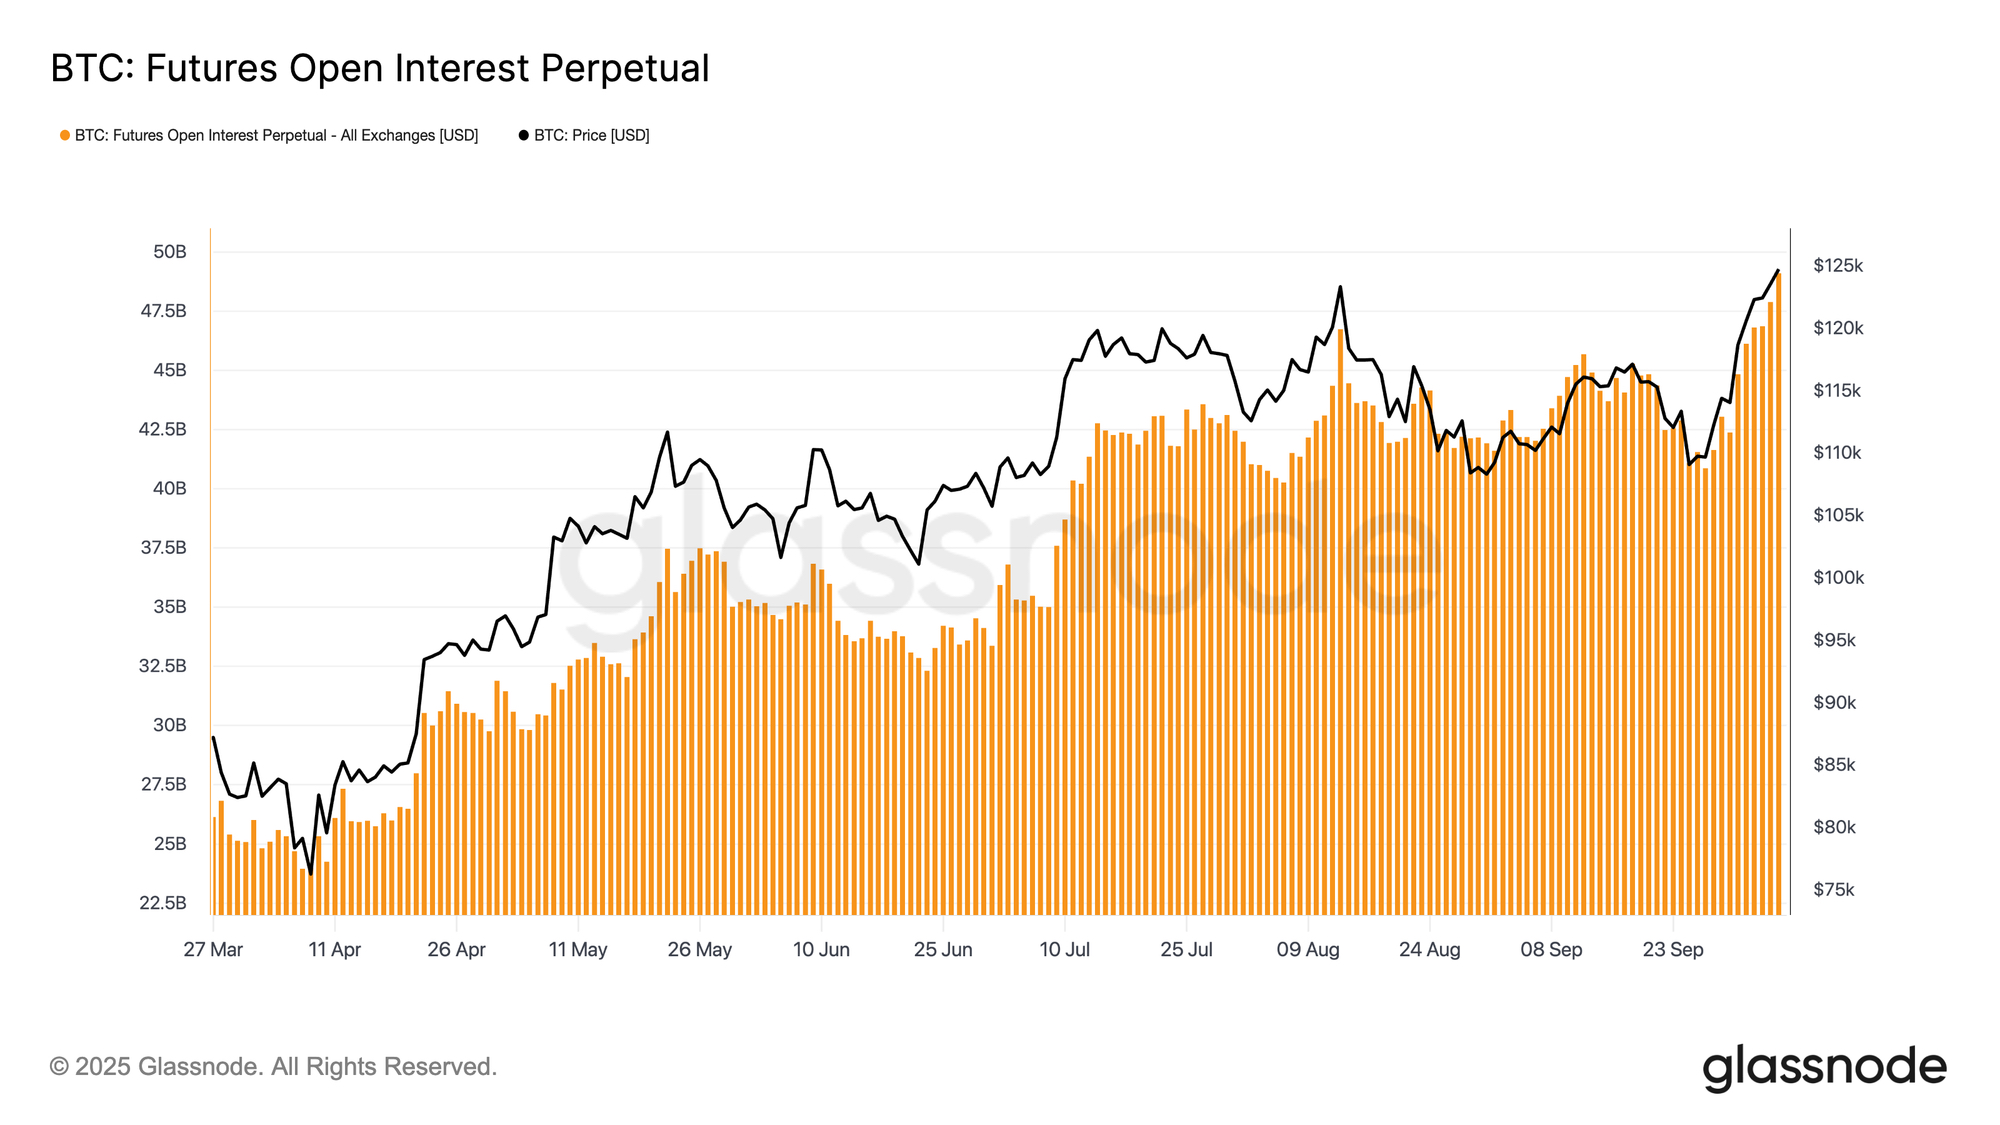
As spot market activity rises, the futures market has also heated up. When Bitcoin broke through the $120,000 mark, open interest in futures surged sharply, reaching new highs. This expansion indicates a significant influx of leveraged long positions into the market, a configuration that often exacerbates short-term volatility. Periods of rapid growth in open interest typically end with liquidations or brief cooling periods, allowing excess leverage to be unwound and positions reset before forming the next sustainable trend.
Funding Rates Continue to Climb
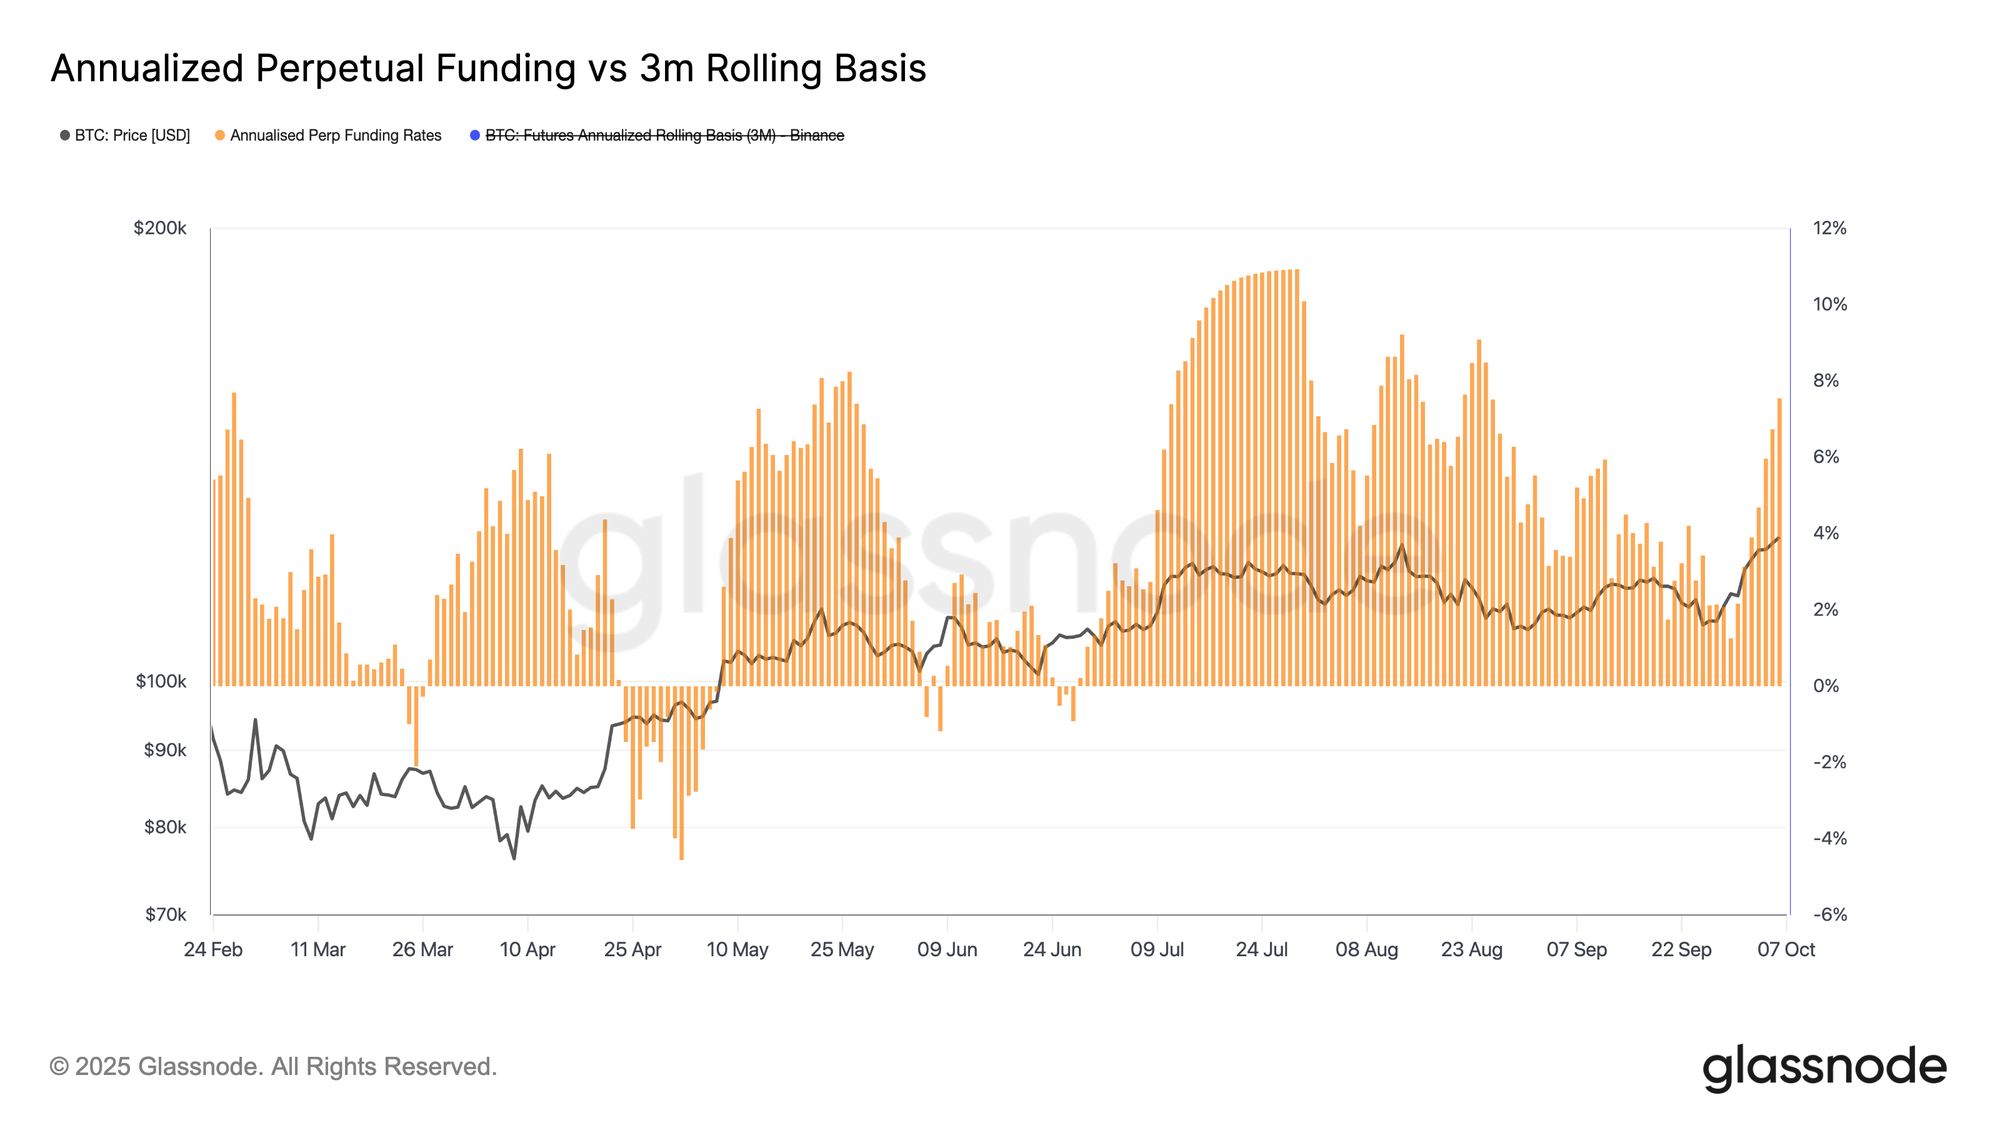
As open interest in futures expands, funding rates have also risen to new highs alongside Bitcoin's price increase. The annualized funding rate has now exceeded 8%, indicating rising demand for leveraged long exposure and increased speculative activity.
Although it has not yet reached overheating levels, a sharp increase in funding rates often precedes a short-term cooling off before leverage decreases. Based on historical experience, such phases typically lead to brief pullbacks or profit-taking before the market reestablishes a more balanced structure.
Options Market Outlook
"Uptober" Boosts Volatility Curve
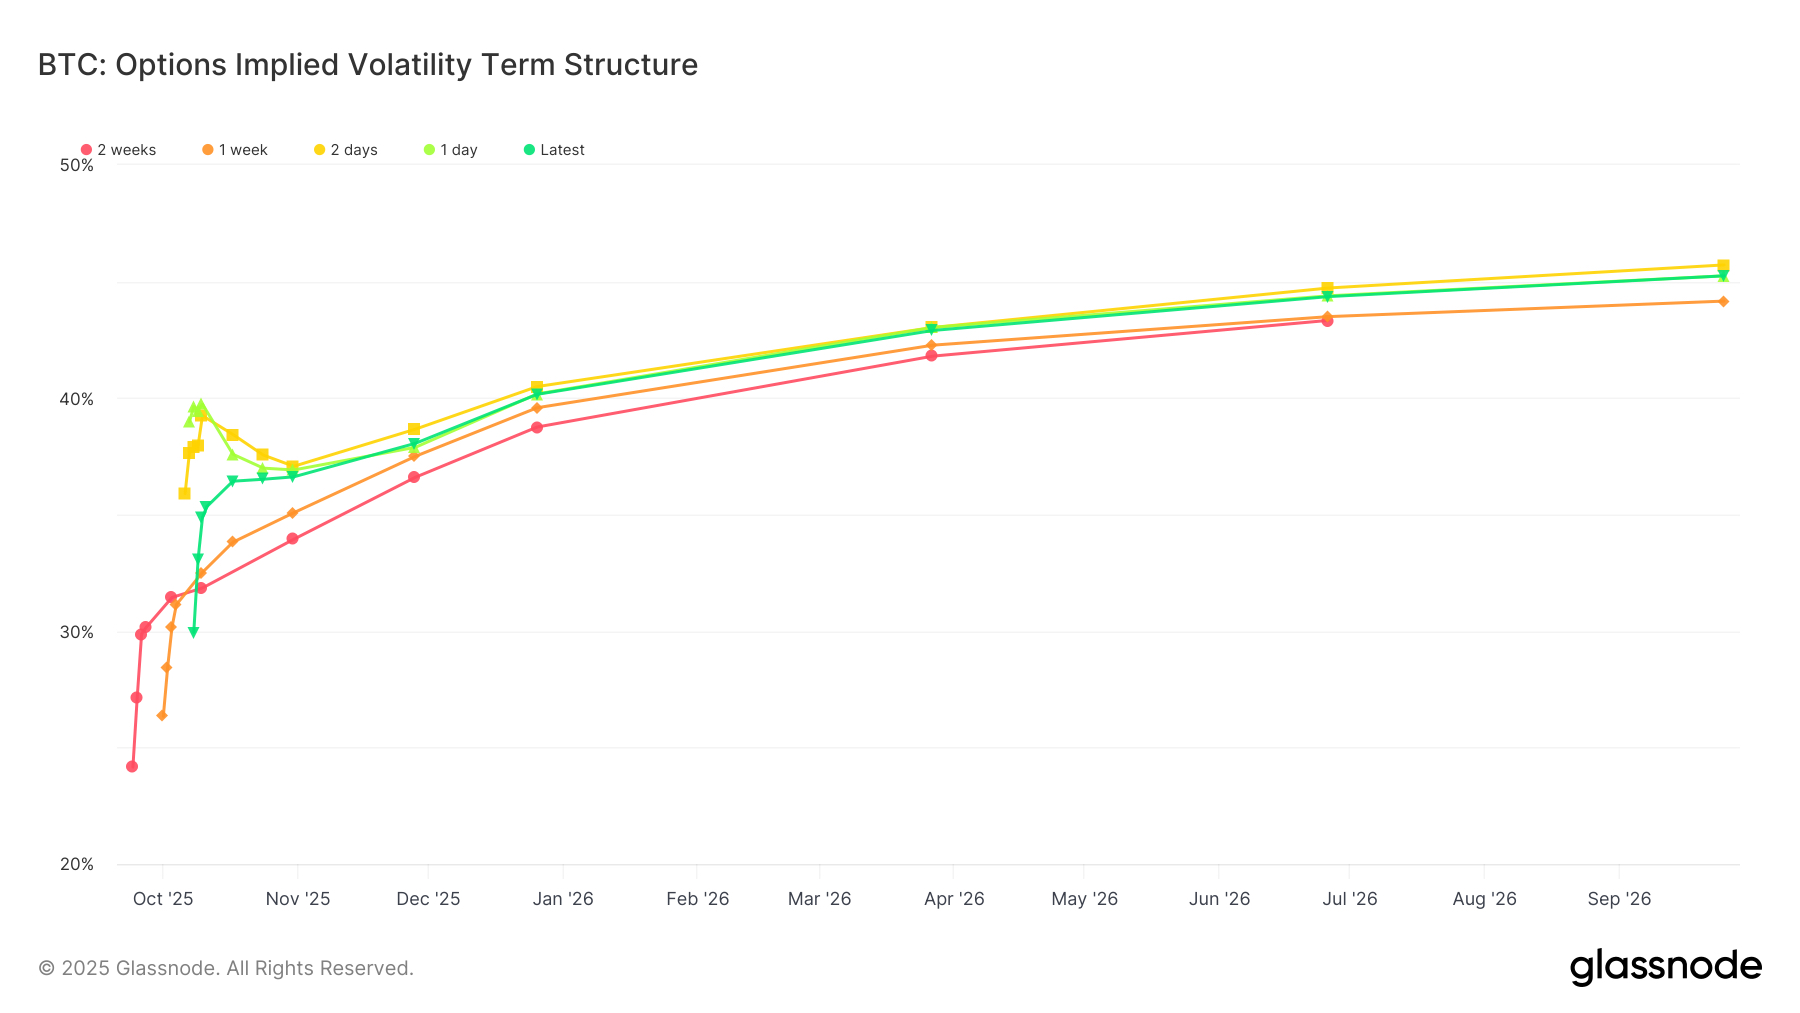
In the options market, implied volatility has firmed as traders reposition for the fourth quarter. Over the past two weeks, the entire implied volatility term structure has risen, reflecting a warming of market optimism and a recovery in options demand.
Options expiring on October 31 (a key date aligned with the "Uptober" narrative) have seen volatility rise from 34 points to 36 points, while back-end options have increased by about 1 volatility point. This upward trend not only signifies short-term bullish sentiment but also extends confidence into 2026, indicating that long-term options are regaining market interest. (Note from Techub News: "Uptober" is a unique term in the cryptocurrency market referring to the seasonal price increase observed in October.)
Short-Term Volatility Compression
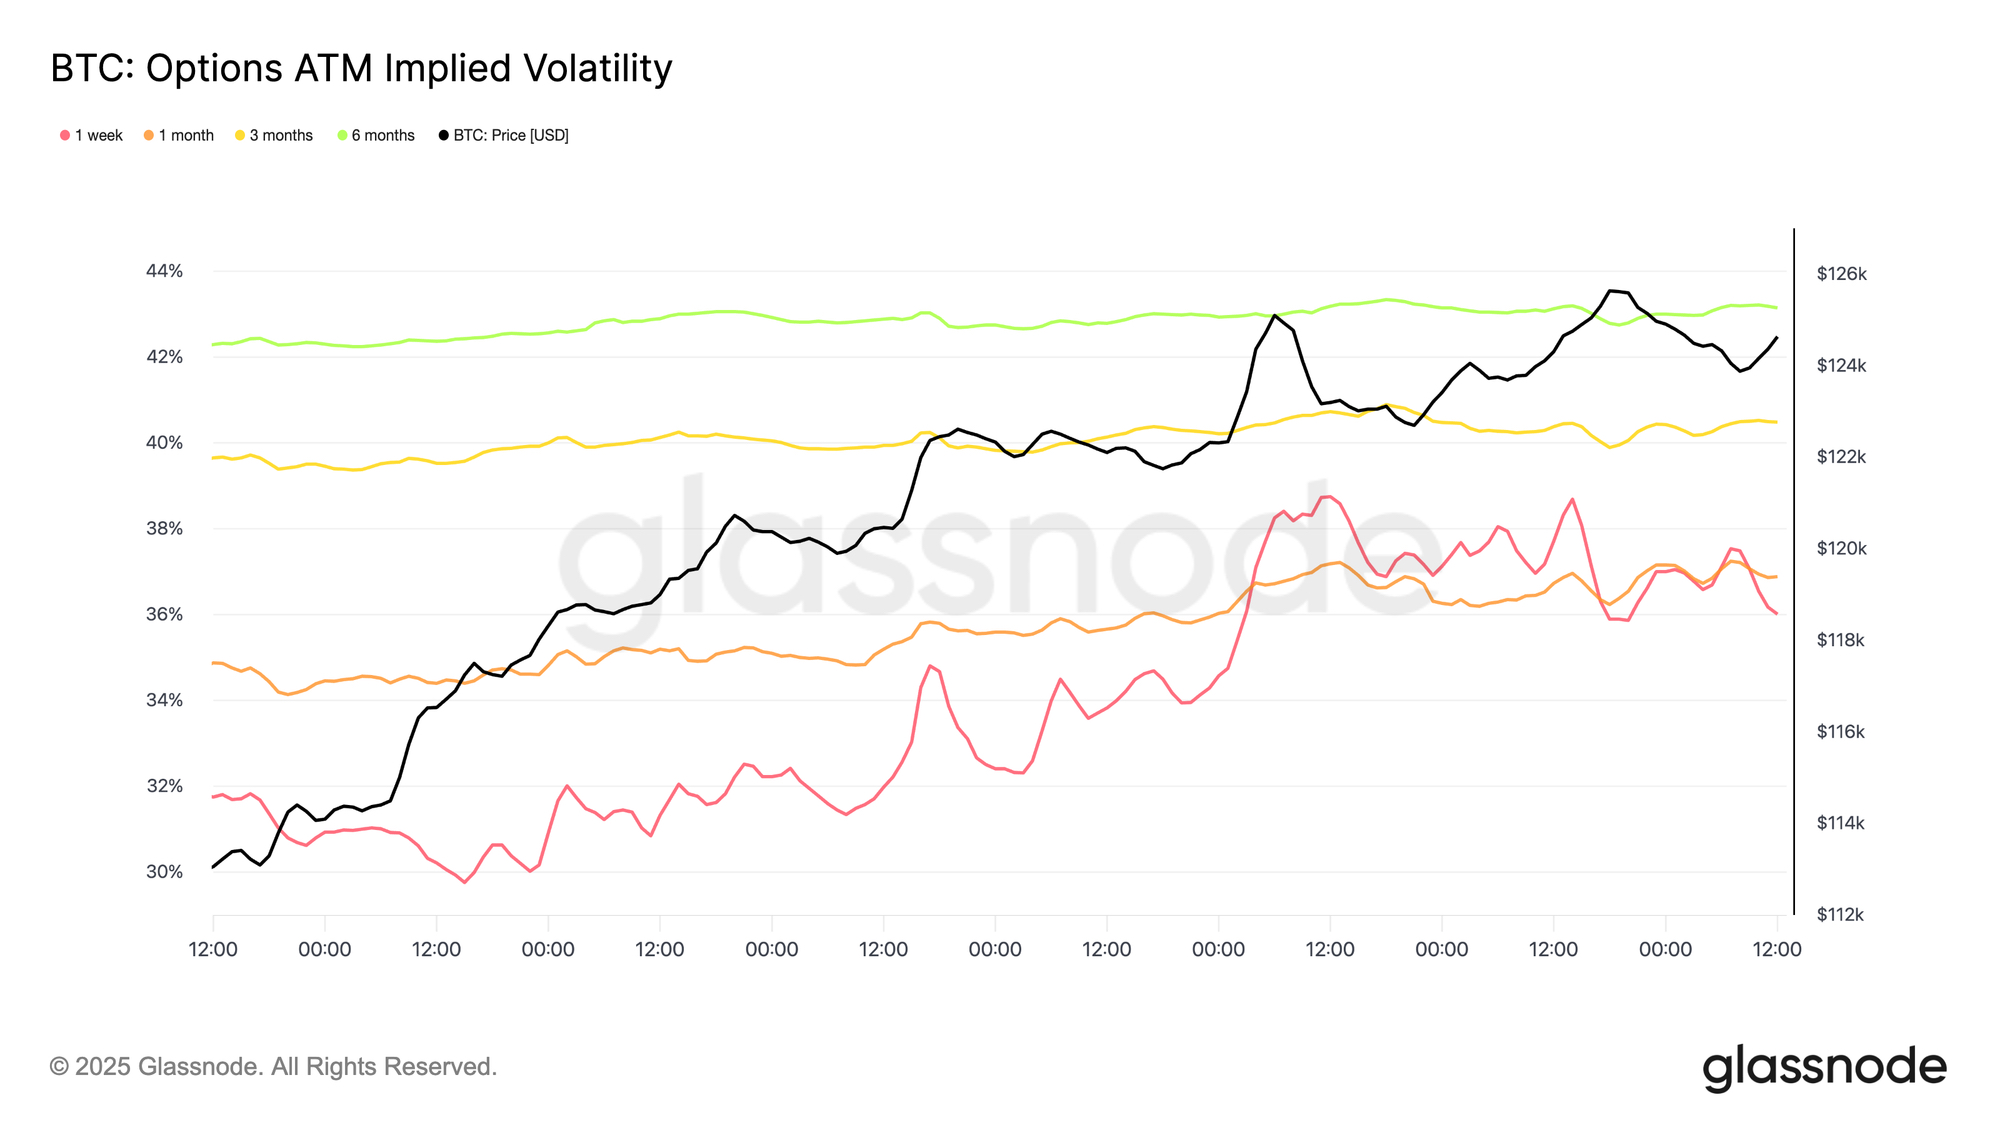
As the overall term structure shifts upward, implied volatility for all strike prices has risen by about 1 volatility point. The only exception is the one-week term, whose implied volatility surged from 31.75% to 36.01%, marking a significant short-term leap.
This large fluctuation reflects that traders have increased their gamma exposure, while sellers of volatility have been forced to cover their positions and shift to higher strike prices and longer expiration dates. The result is a typical volatility compression, primarily concentrated in short-term contracts, highlighting the market's renewed sensitivity to short-term price fluctuations and rising demand for tactical hedging.
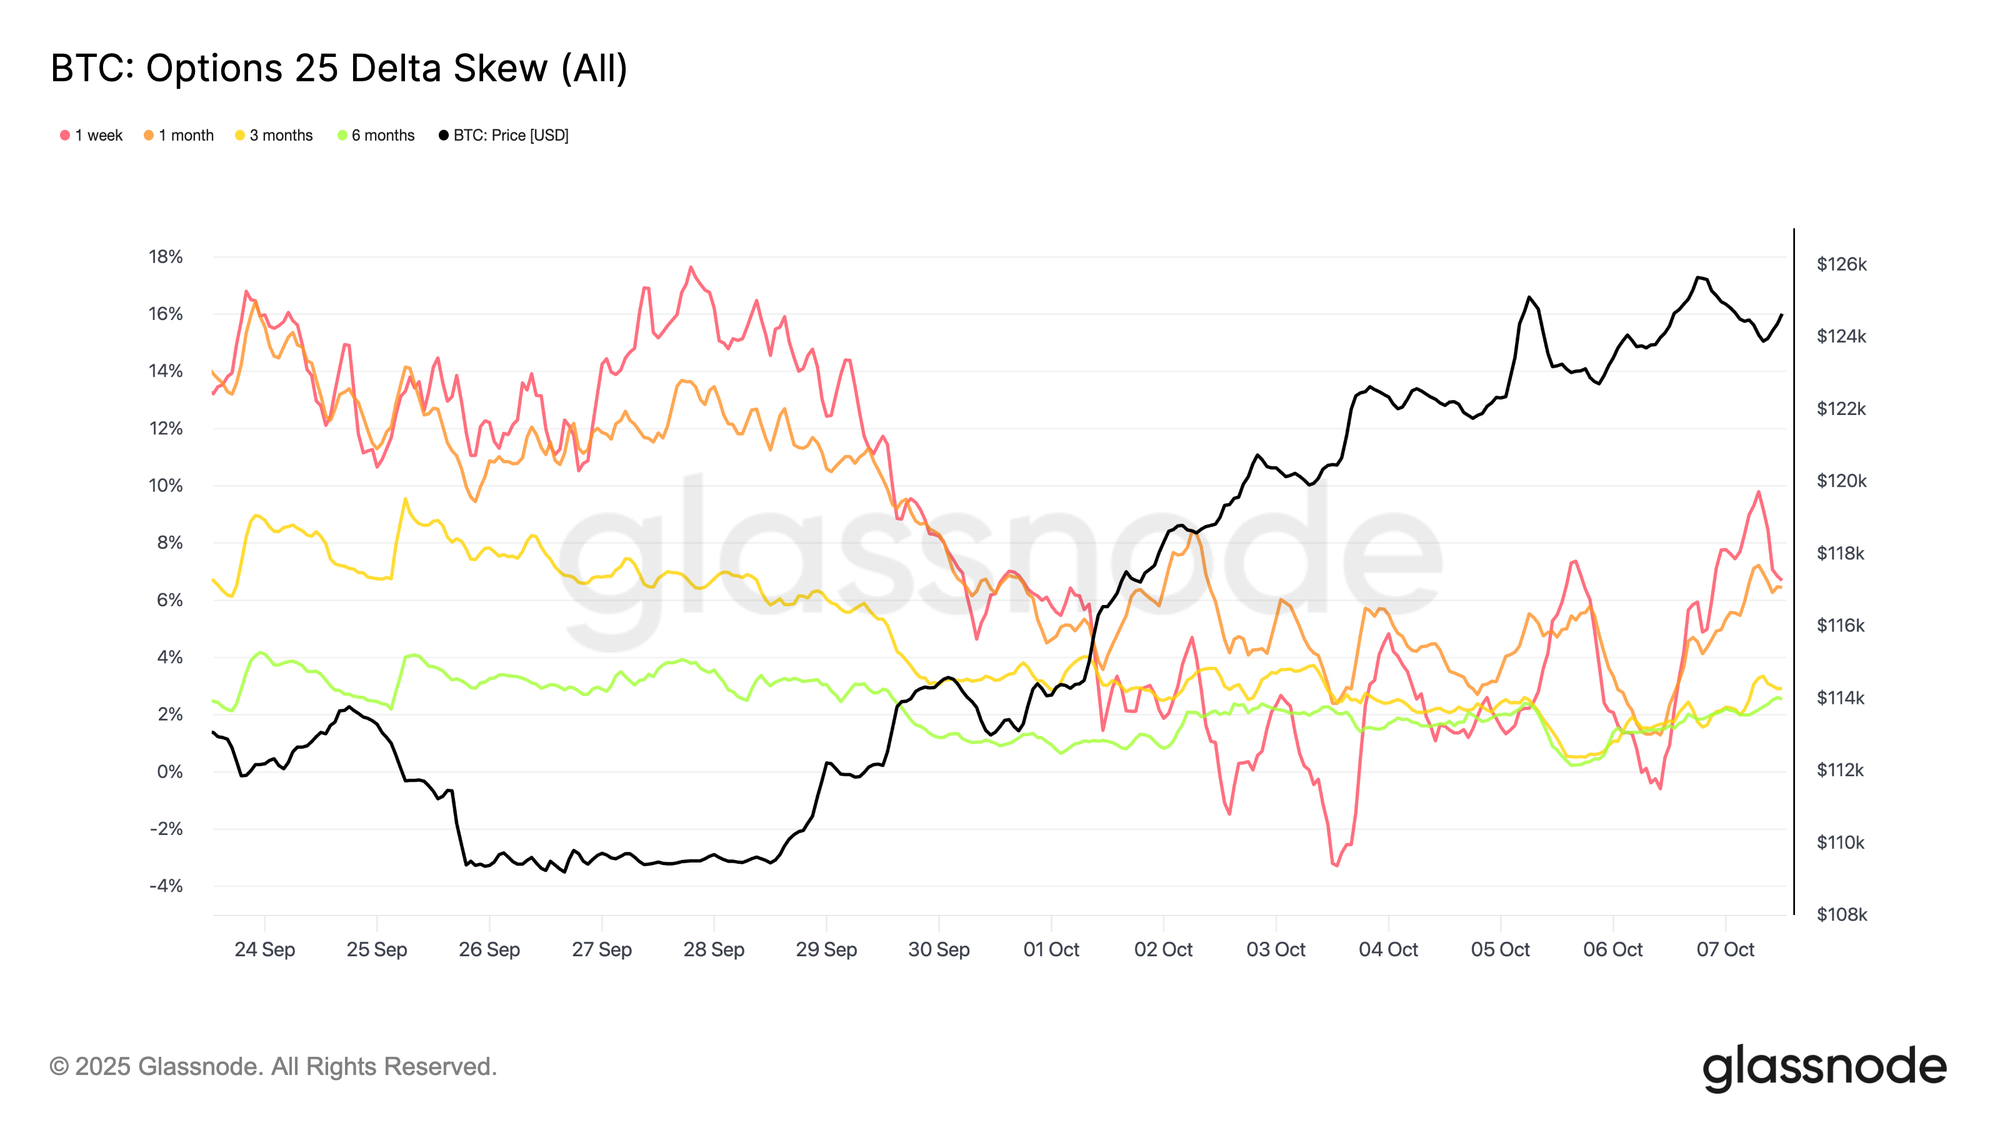
Dramatic Reversal in Options Market Sentiment
Over the past two weeks, there has been a significant shift in options market sentiment, moving from a deeply bearish structure to nearly neutral, followed by a slight rebound in hedging demand that tilted the skew back towards bearish.
Recently, the 25 Delta skew narrowed from a high of about 18 volatility points for put options to just 3 volatility points last Friday, showing an astonishing 21-point shift in less than a week. As previously mentioned, such extreme skew typically signals a reversal, and this time is no exception. With Bitcoin's breakout momentum strengthening, traders are buying call options in search of upside exposure, marking a clear shift in the market from defensive hedging to opportunistic positioning.
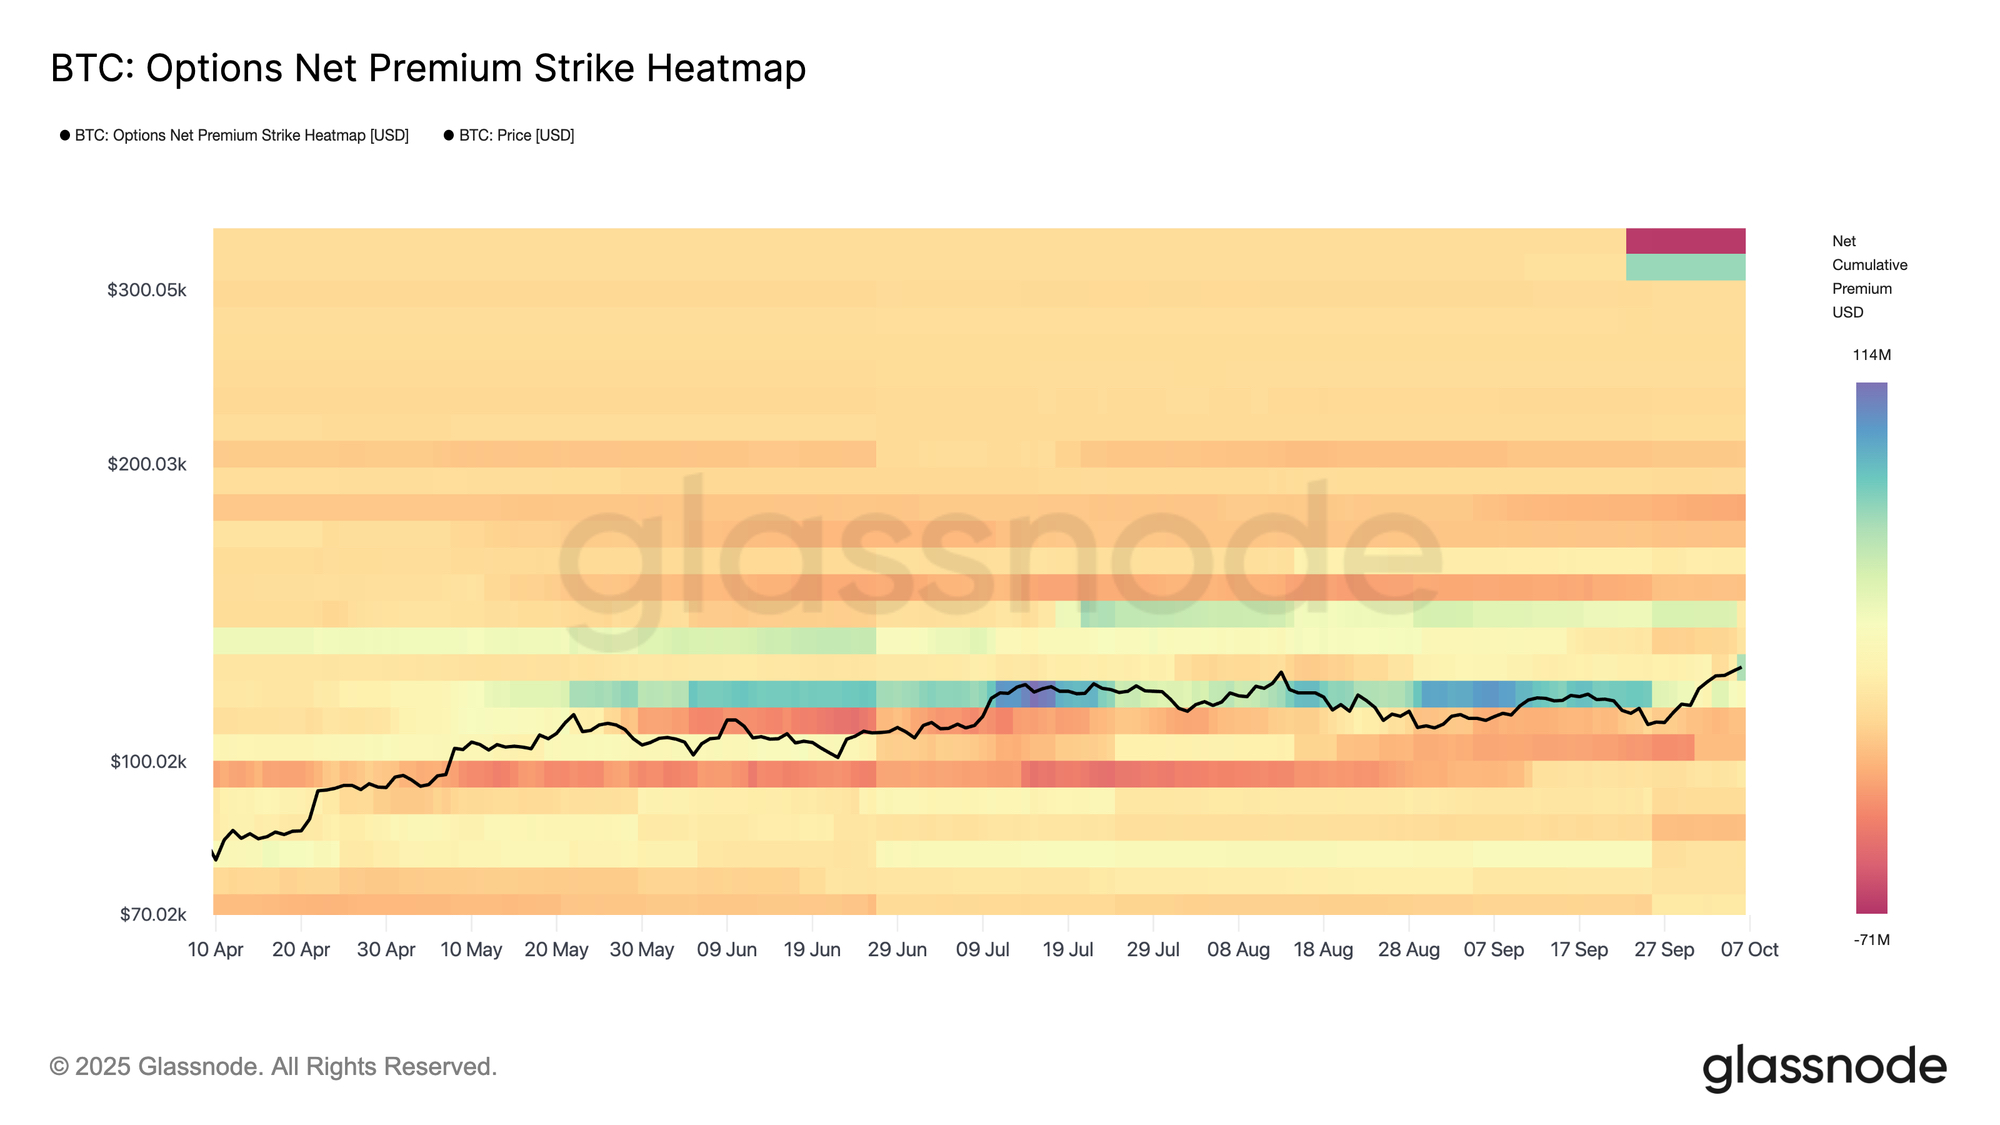
Funding Flows Pave the Way for Volatility
Recent options funding flows indicate that there is intense competition between bulls and bears near the current price levels. Call option trading activity is dominant, but both buyers and sellers are participating on a large scale, reflecting their adoption of various strategies. Some participants pursue upside convexity through call option spreads and ratios to manage costs, while others monetize volatility by selling covered call options, limiting the gains from their spot exposure.
Market makers maintain long gamma positions near these strike prices, especially as the end of the month approaches, to cope with rising volatility. This structure suggests potential bidirectional pressure: long gamma traders may take profits to secure gains, while short gamma players may be forced to chase and hedge. As a result, this configuration sets the stage for significant volatility as the market moves into unknown territory.
In summary, the options market landscape reflects a more balanced yet increasingly active market. With the skew currently close to neutral and implied volatility rising, call positions are no longer as cheap as they were a week ago. Many traders have locked in bullish exposure, driving up call option premiums and compressing the risk-reward of new volatility trades. Although market momentum remains strong and sentiment is still constructive, the positioning has become more crowded, indicating that recent volatility may continue to rise as the market digests this re-emerging optimism.
Conclusion
In conclusion, Bitcoin's breakthrough of the supply cluster between $114,000 and $117,000, reaching a historic high of $126,000, highlights the market's resurgence amid mid-market accumulation and easing whale selling pressure. On-chain data shows that key support is located between $117,000 and $120,000, where nearly 190,000 BTC changed hands. If market momentum cools, this area may attract dip buyers.
In the spot and futures markets, ETF inflows exceeding $2.2 billion and a surge in trading volume confirm strong institutional demand, but rising leverage and funding rates above 8% introduce short-term vulnerabilities. Meanwhile, the options market exhibits characteristics of rising implied volatility, neutral skew, and concentrated bullish positions, reflecting constructive but crowded sentiment.
Overall, these signals outline a strong and mature upward trend, supported as Bitcoin explores price discovery, but it is important to emphasize that the market's sensitivity to profit-taking and leverage resets is increasing.
免责声明:本文章仅代表作者个人观点,不代表本平台的立场和观点。本文章仅供信息分享,不构成对任何人的任何投资建议。用户与作者之间的任何争议,与本平台无关。如网页中刊载的文章或图片涉及侵权,请提供相关的权利证明和身份证明发送邮件到support@aicoin.com,本平台相关工作人员将会进行核查。


